| Param | Original file | Final file |
|---|---|---|
| Filename | modeM0/AS1C05_013T04_9000003660_24987cztM0_level2.evt | modeM0/AS1C05_013T04_9000003660_24987cztM0_level2_quad_clean.evt |
| Size (bytes) | 166,979,520 | 41,811,840 |
| Size | 159.2 MB | 39.9 MB |
| Events in quadrant A | 1,070,534 | 280,937 |
| Events in quadrant B | 1,083,240 | 289,159 |
| Events in quadrant C | 1,227,384 | 274,382 |
| Events in quadrant D | 1,524,792 | 263,202 |
| Mode SS | |||
|---|---|---|---|
| Quadrant | BADHDUFLAG | Total packets | Discarded packets |
| A | 0 | 46 | 0 |
| B | 0 | 46 | 0 |
| C | 0 | 46 | 0 |
| D | 0 | 46 | 0 |
| Mode M0 | |||
|---|---|---|---|
| Quadrant | BADHDUFLAG | Total packets | Discarded packets |
| A | 0 | 4675 | 2 |
| B | 0 | 4693 | 1 |
| C | 0 | 5085 | 1 |
| D | 0 | 6003 | 1 |
| Mode M9 | |||
|---|---|---|---|
| Quadrant | BADHDUFLAG | Total packets | Discarded packets |
| A | 0 | 3 | 0 |
| B | 0 | 3 | 0 |
| C | 0 | 3 | 0 |
| D | 0 | 3 | 0 |
| Quadrant | Total seconds | Saturated seconds | Saturation percentage |
|---|---|---|---|
| A | 2187 | 110 | 5.029721% |
| B | 2187 | 115 | 5.258345% |
| C | 2187 | 85 | 3.886603% |
| D | 2187 | 121 | 5.532693% |
Noise dominated data is calculated using 1-second bins in cleaned event files. If a bin has >2000 counts, and if more than 50% of those come from <1% of pixels, then it is considered to be noise-dominated and hence unusable.
| Quadrant | # 1 sec bins | Bins with >0 counts | Bins with >2000 counts | High rate bins dominated by noise | Noise dominated (total time) | Noise dominated (detector-on time) | Marked lightcurve |
|---|---|---|---|---|---|---|---|
| A | 2522 | 2188 | 0 | 0 | 0.00% | 0.00% | 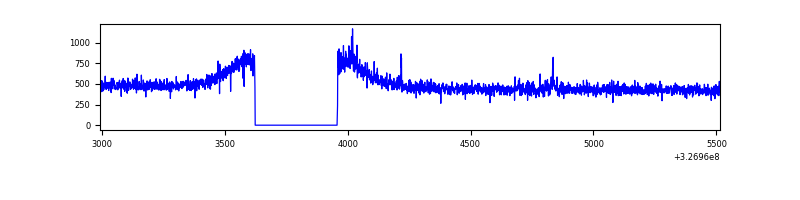 |
| B | 2522 | 2188 | 0 | 0 | 0.00% | 0.00% | 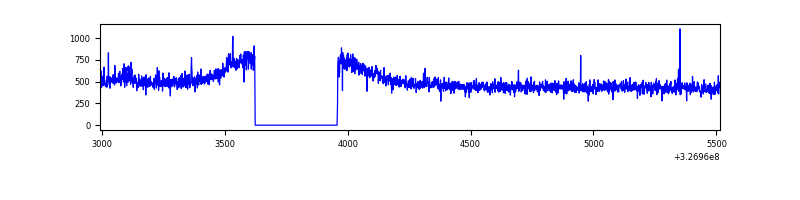 |
| C | 2522 | 2188 | 0 | 0 | 0.00% | 0.00% | 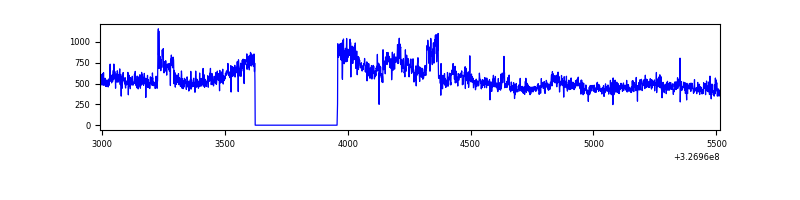 |
| D | 2522 | 2188 | 4 | 4 | 0.16% | 0.18% | 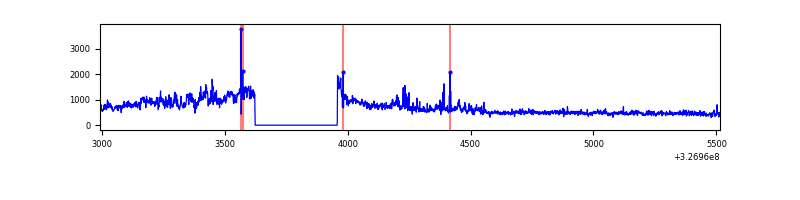 |
Top three noisy pixels from each quadrant. If the there are fewer than three noisy pixels in the level2.evt file, extra rows are filled as -1
| Pixel properties | Quadrant properties | ||||||
|---|---|---|---|---|---|---|---|
| Quadrant | DetID | PixID | Counts | Sigma | Mean | Median | Sigma |
| A | 6 | 16 | 10970 | 188.35 | 274 | 267 | 56.8 |
| A | 13 | 254 | 3459 | 56.17 | 274 | 267 | 56.8 |
| A | 3 | 137 | 2769 | 44.03 | 274 | 267 | 56.8 |
| B | 12 | 111 | 6897 | 121.8 | 273 | 266 | 54.4 |
| B | 11 | 111 | 6141 | 107.91 | 273 | 266 | 54.4 |
| B | 14 | 111 | 5842 | 102.42 | 273 | 266 | 54.4 |
| C | 7 | 247 | 172584 | 2809.53 | 259 | 259 | 61.3 |
| C | 14 | 238 | 40947 | 663.36 | 259 | 259 | 61.3 |
| C | 13 | 61 | 1899 | 26.74 | 259 | 259 | 61.3 |
| D | 7 | 238 | 460500 | 7120.15 | 258 | 248 | 64.6 |
| D | 1 | 52 | 45487 | 699.85 | 258 | 248 | 64.6 |
| D | 2 | 244 | 22286 | 340.93 | 258 | 248 | 64.6 |
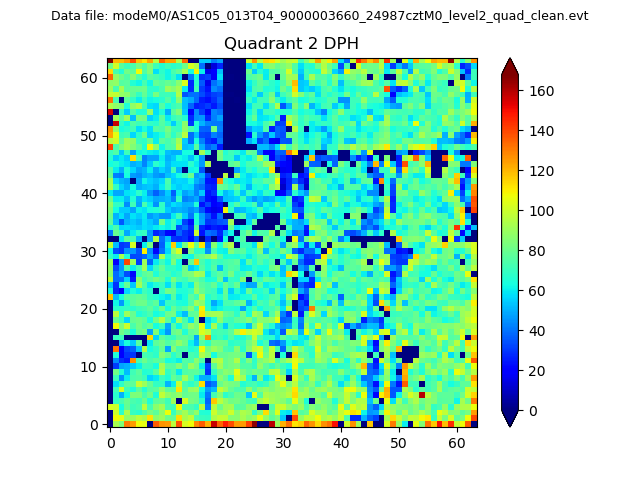
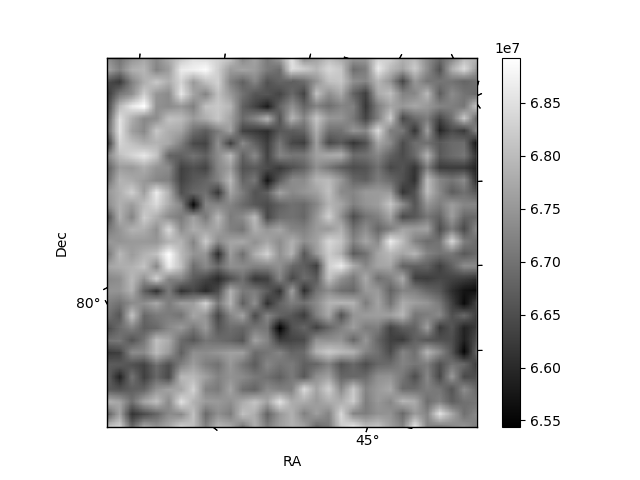
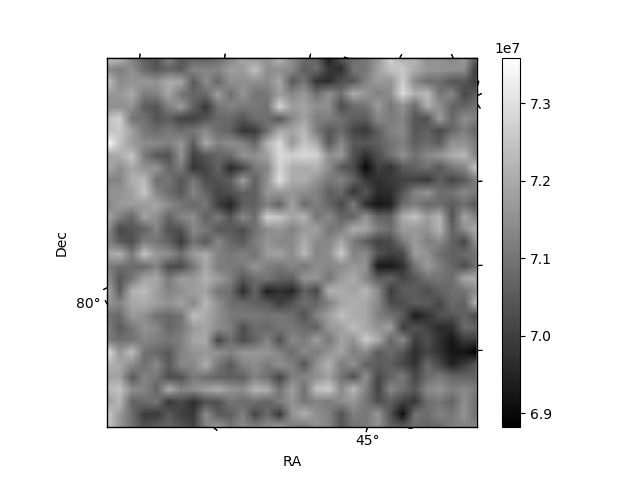
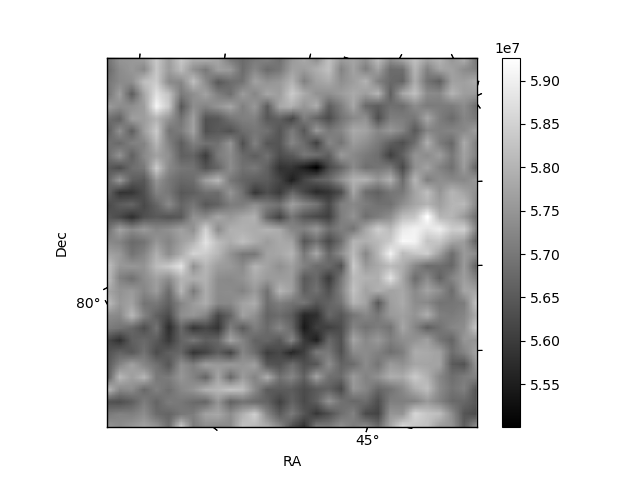
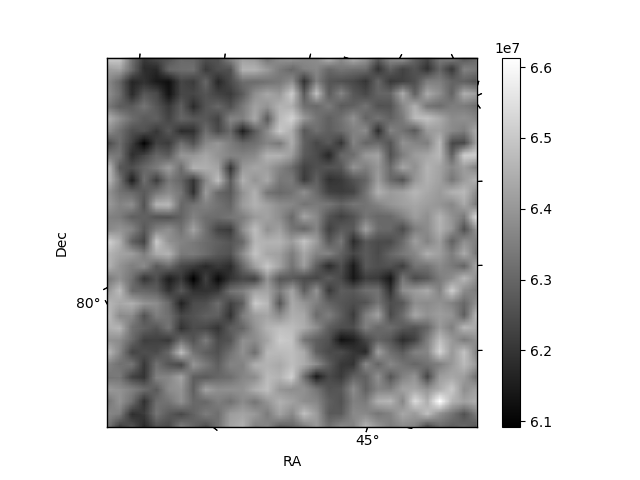
Histogram calculated using DETX and DETY for each event in the final _common_clean file
| Quadrant A |  |
 |
Quadrant B |
|---|---|---|---|
| Quadrant D | 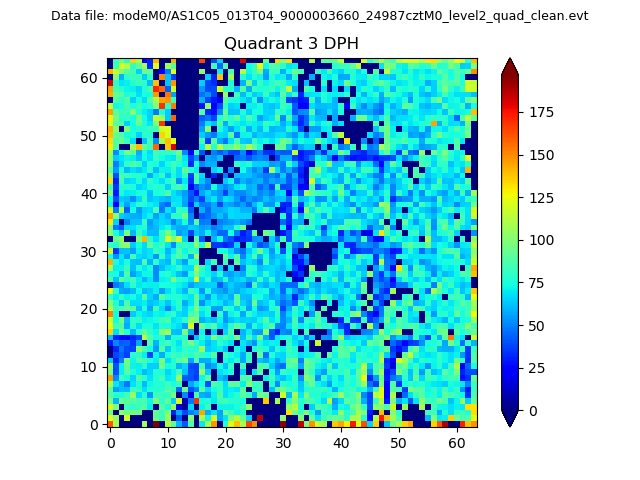 |
 |
Quadrant C |
| Plot type | Count rate plots | Images |
|---|---|---|
| Comparison with Poisson distribution Blue bars denote a histogram of data divided into 1 sec bins. Red curve is a Poisson curve with rate = median count rate of data. |
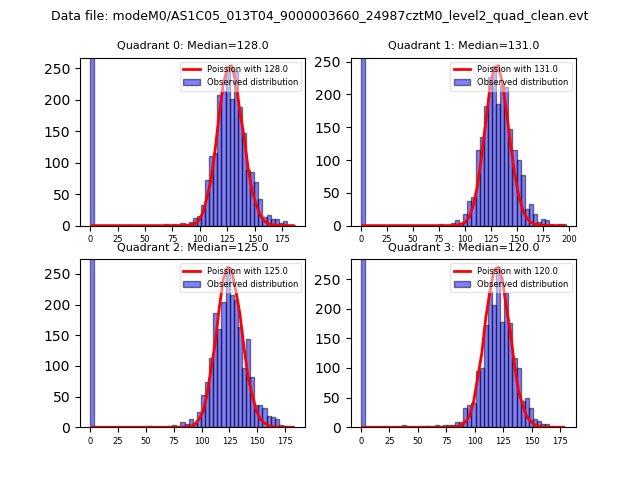 |
 |
| Quadrant-wise count rates Data is divided into 100 sec bins |
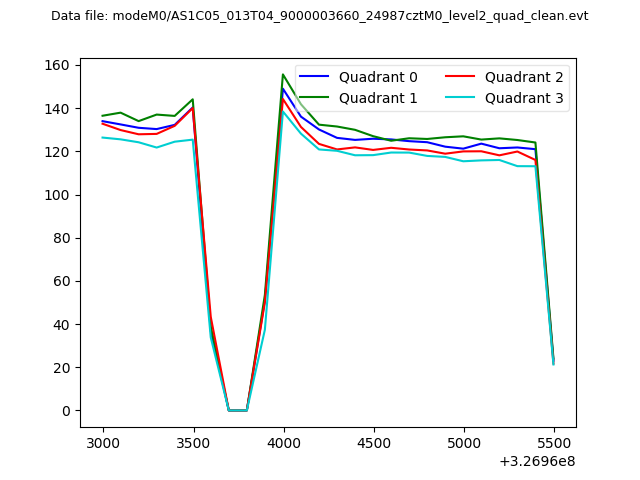 |
|
| Module-wise count rates for Quadrant A Data is divided into 100 sec bins |
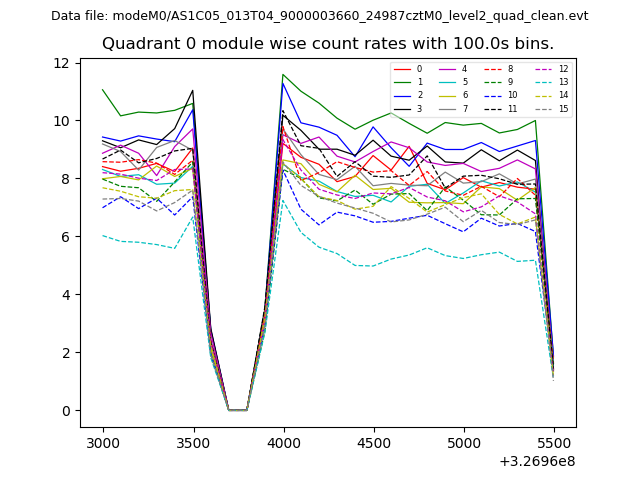 |
 |
| Module-wise count rates for Quadrant B Data is divided into 100 sec bins |
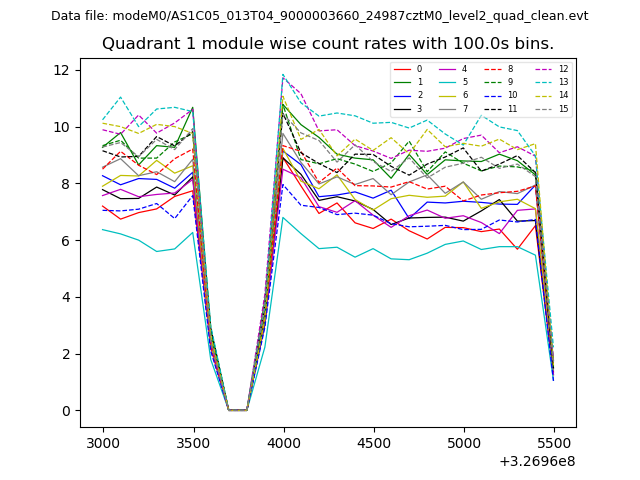 |
 |
| Module-wise count rates for Quadrant C Data is divided into 100 sec bins |
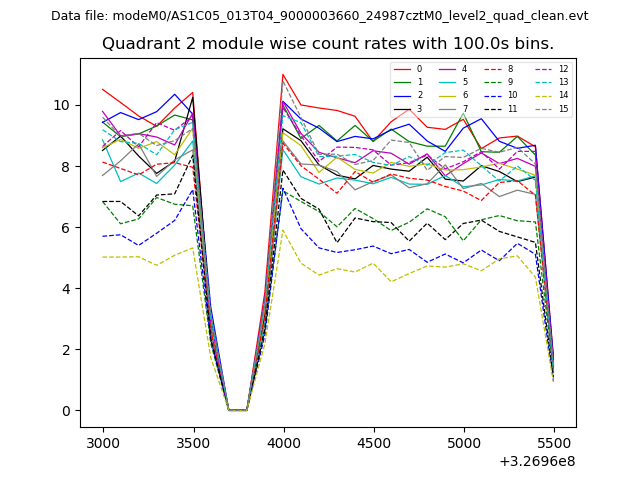 |
 |
| Module-wise count rates for Quadrant D Data is divided into 100 sec bins |
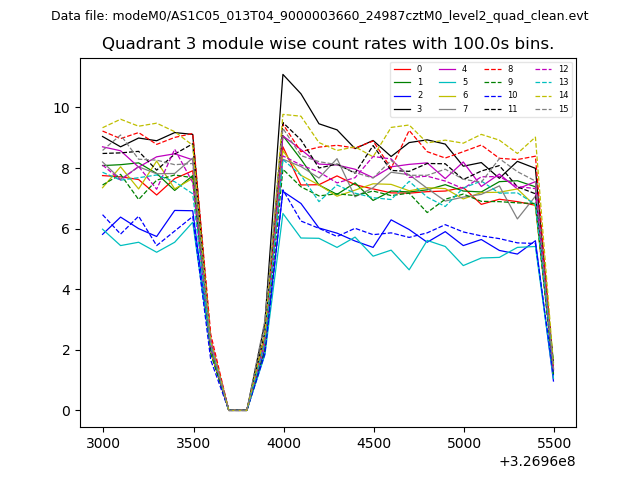 |
 |
| Parameter | Plot |
|---|---|
| CZT HV Monitor | 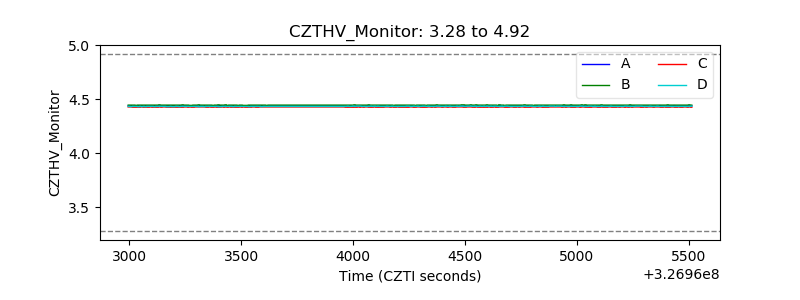 |
| D_VDD | 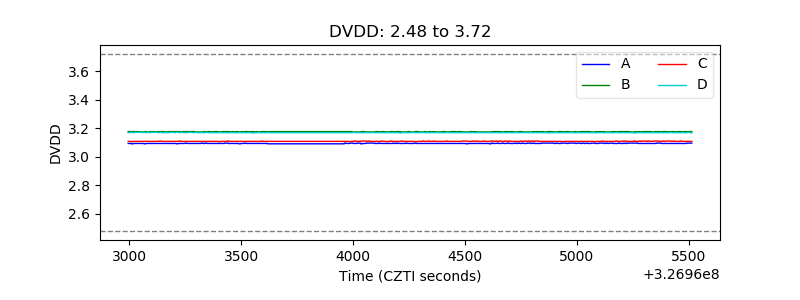 |
| Temperature 1 | 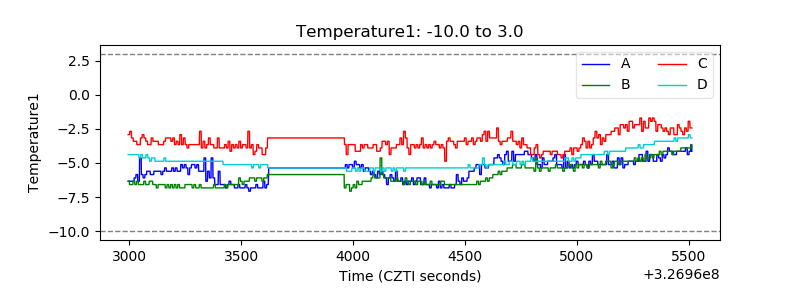 |
| Veto HV Monitor | 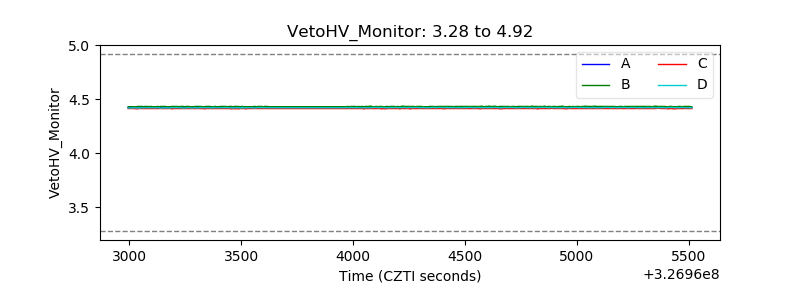 |
| Veto LLD | 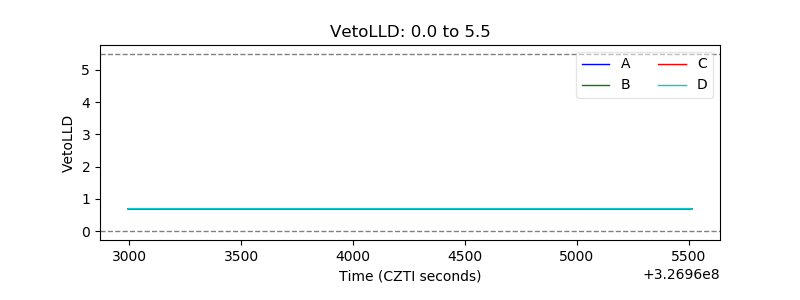 |
| Alpha Counter | 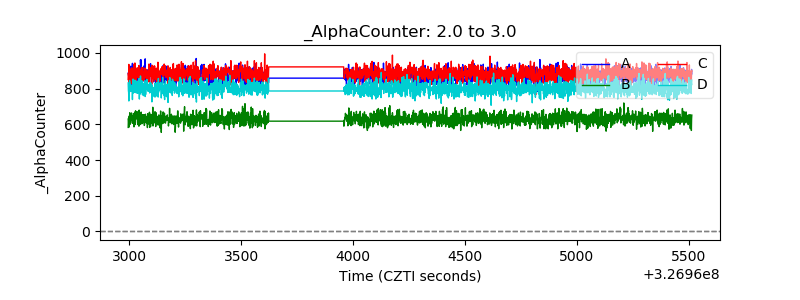 |
| _CPM_Rate | 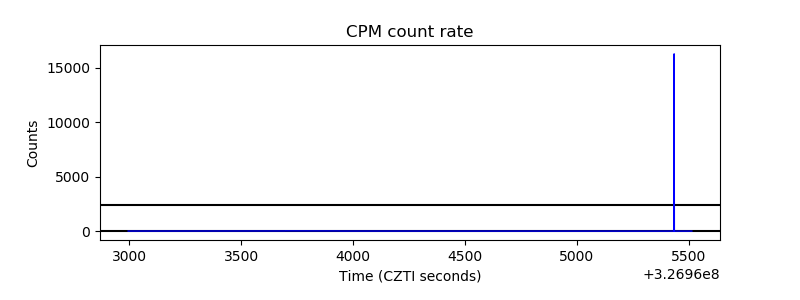 |
| CZT Counter | 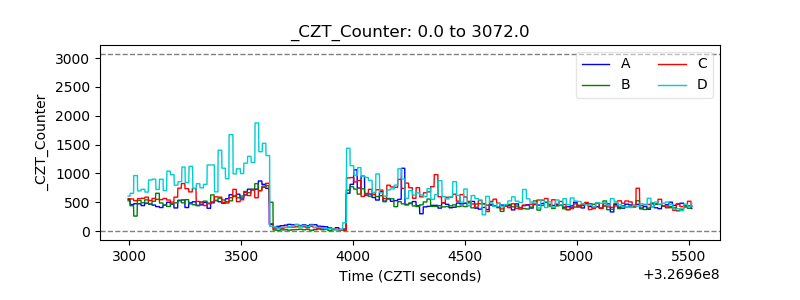 |
| +2.5 Volts monitor |  |
| +5 Volts monitor |  |
| _ROLL_ROT | 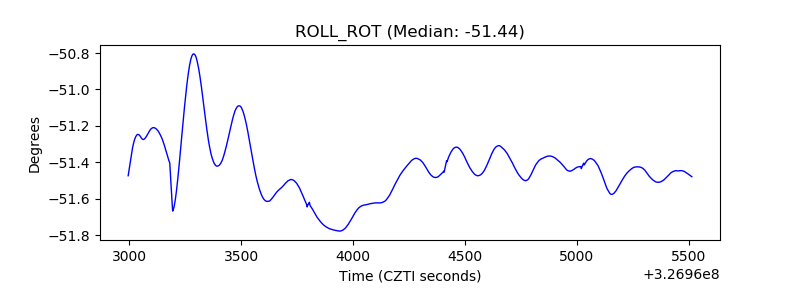 |
| _Roll_DEC | 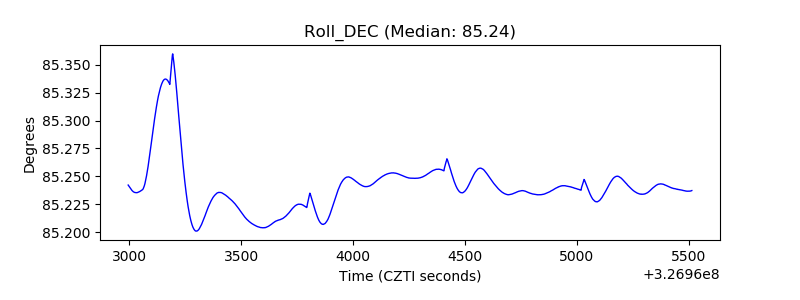 |
| _Roll_RA |  |
| Veto Counter | 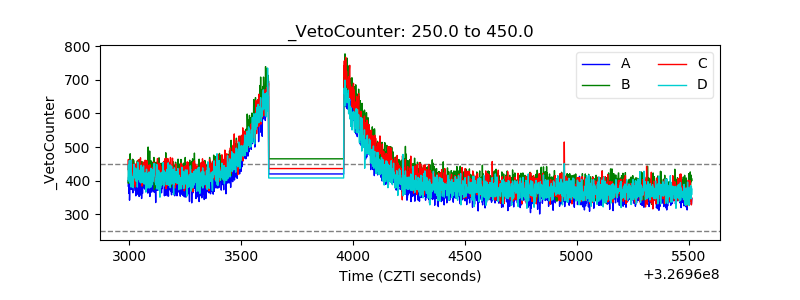 |