| Param | Original file | Final file |
|---|---|---|
| Filename | modeM0/AS1C05_013T04_9000003660_24988cztM0_level2.evt | modeM0/AS1C05_013T04_9000003660_24988cztM0_level2_quad_clean.evt |
| Size (bytes) | 409,135,680 | 112,129,920 |
| Size | 390.2 MB | 106.9 MB |
| Events in quadrant A | 2,782,346 | 760,211 |
| Events in quadrant B | 2,845,866 | 773,166 |
| Events in quadrant C | 3,020,881 | 731,885 |
| Events in quadrant D | 3,334,202 | 712,638 |
| Mode SS | |||
|---|---|---|---|
| Quadrant | BADHDUFLAG | Total packets | Discarded packets |
| A | 0 | 120 | 0 |
| B | 0 | 120 | 0 |
| C | 0 | 120 | 0 |
| D | 0 | 120 | 0 |
| Mode M0 | |||
|---|---|---|---|
| Quadrant | BADHDUFLAG | Total packets | Discarded packets |
| A | 0 | 12373 | 1 |
| B | 0 | 12468 | 1 |
| C | 0 | 12731 | 1 |
| D | 0 | 13837 | 1 |
| Quadrant | Total seconds | Saturated seconds | Saturation percentage |
|---|---|---|---|
| A | 5980 | 188 | 3.143813% |
| B | 5981 | 169 | 2.825614% |
| C | 5981 | 159 | 2.658418% |
| D | 5981 | 199 | 3.327203% |
Noise dominated data is calculated using 1-second bins in cleaned event files. If a bin has >2000 counts, and if more than 50% of those come from <1% of pixels, then it is considered to be noise-dominated and hence unusable.
| Quadrant | # 1 sec bins | Bins with >0 counts | Bins with >2000 counts | High rate bins dominated by noise | Noise dominated (total time) | Noise dominated (detector-on time) | Marked lightcurve |
|---|---|---|---|---|---|---|---|
| A | 6000 | 5981 | 0 | 0 | 0.00% | 0.00% | 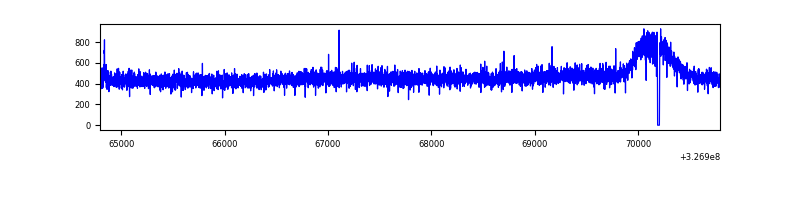 |
| B | 6001 | 5982 | 0 | 0 | 0.00% | 0.00% | 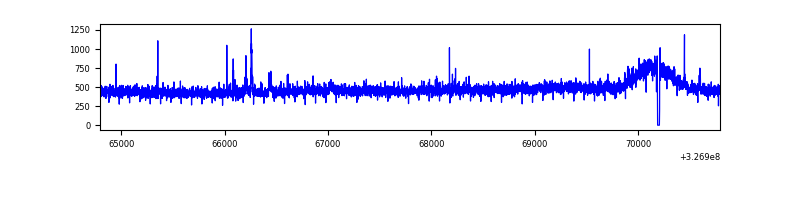 |
| C | 6001 | 5982 | 0 | 0 | 0.00% | 0.00% | 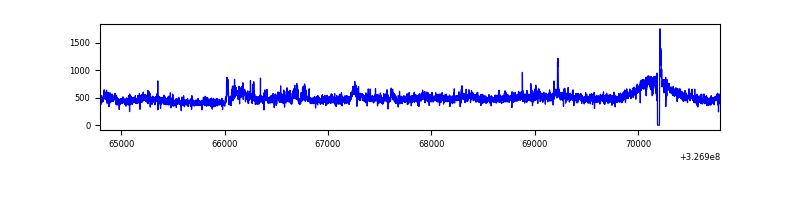 |
| D | 6001 | 5982 | 20 | 20 | 0.33% | 0.33% | 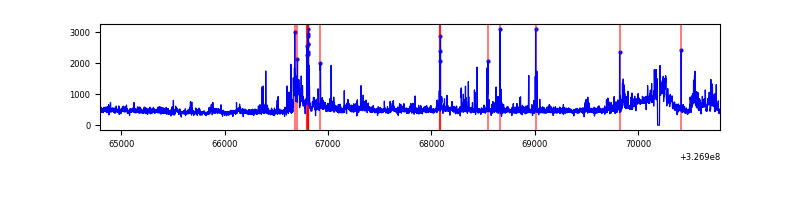 |
Top three noisy pixels from each quadrant. If the there are fewer than three noisy pixels in the level2.evt file, extra rows are filled as -1
| Pixel properties | Quadrant properties | ||||||
|---|---|---|---|---|---|---|---|
| Quadrant | DetID | PixID | Counts | Sigma | Mean | Median | Sigma |
| A | 13 | 254 | 9734 | 62.19 | 719 | 702 | 145.2 |
| A | 6 | 16 | 8120 | 51.07 | 719 | 702 | 145.2 |
| A | 3 | 137 | 6714 | 41.39 | 719 | 702 | 145.2 |
| B | 0 | 190 | 19180 | 134.78 | 714 | 695 | 137.1 |
| B | 12 | 111 | 16877 | 117.99 | 714 | 695 | 137.1 |
| B | 11 | 111 | 15300 | 106.49 | 714 | 695 | 137.1 |
| C | 7 | 247 | 226618 | 1416.51 | 683 | 685 | 159.5 |
| C | 14 | 238 | 108644 | 676.86 | 683 | 685 | 159.5 |
| C | 3 | 233 | 22518 | 136.88 | 683 | 685 | 159.5 |
| D | 1 | 52 | 274634 | 1626.32 | 693 | 669 | 168.5 |
| D | 7 | 238 | 188152 | 1112.94 | 693 | 669 | 168.5 |
| D | 8 | 195 | 126002 | 744.0 | 693 | 669 | 168.5 |
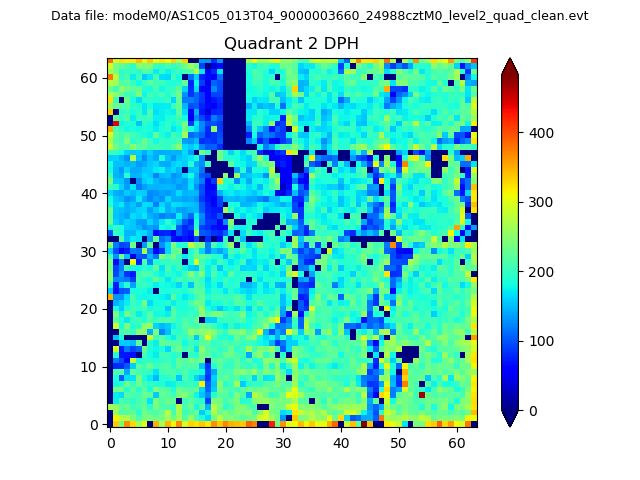
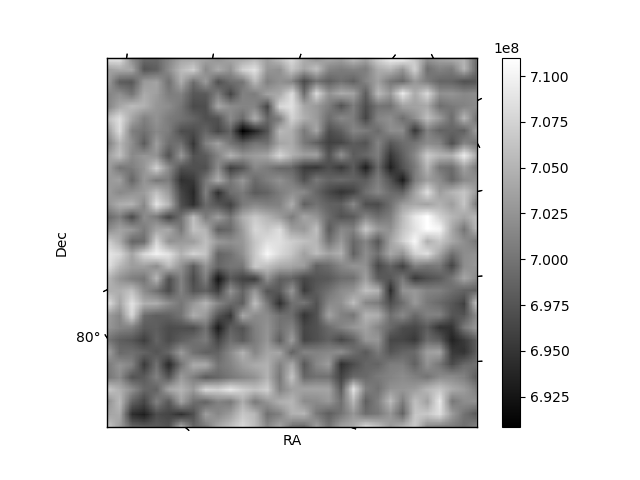
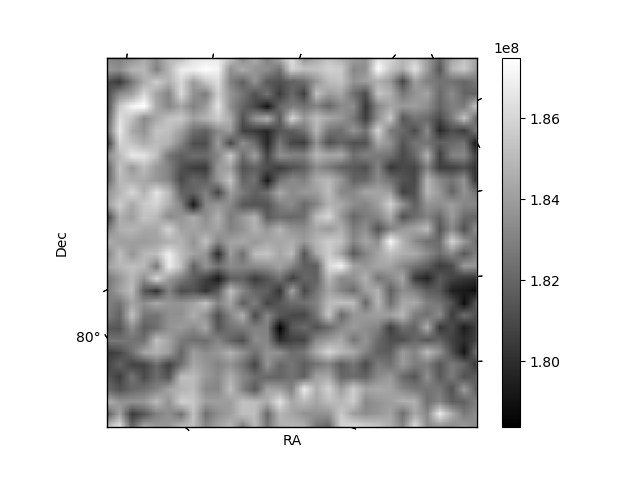
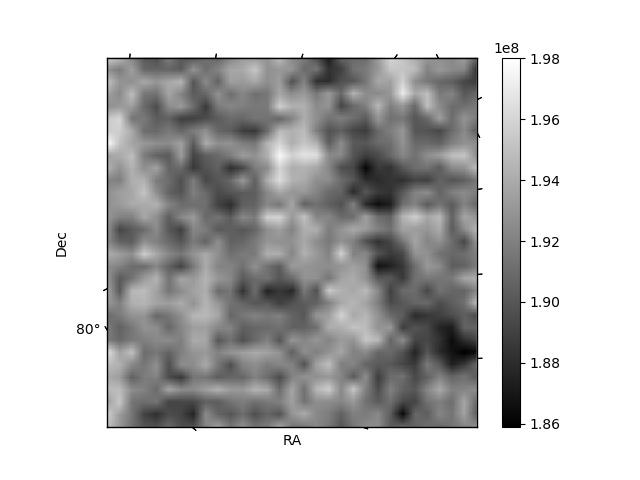
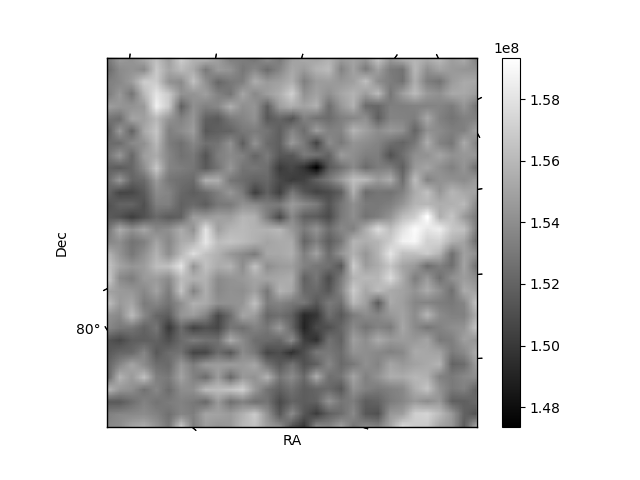
Histogram calculated using DETX and DETY for each event in the final _common_clean file
| Quadrant A | 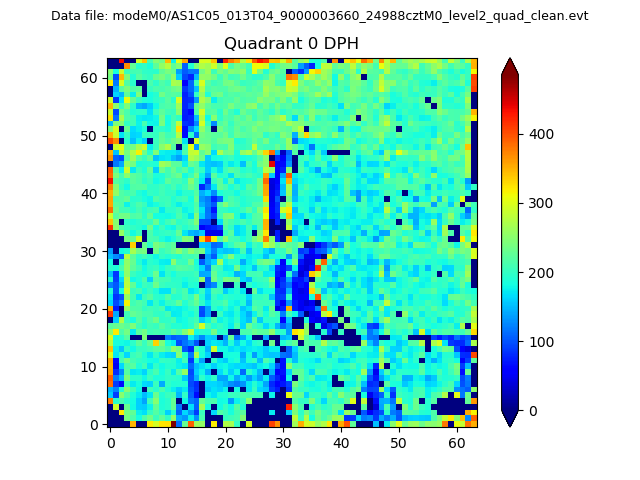 |
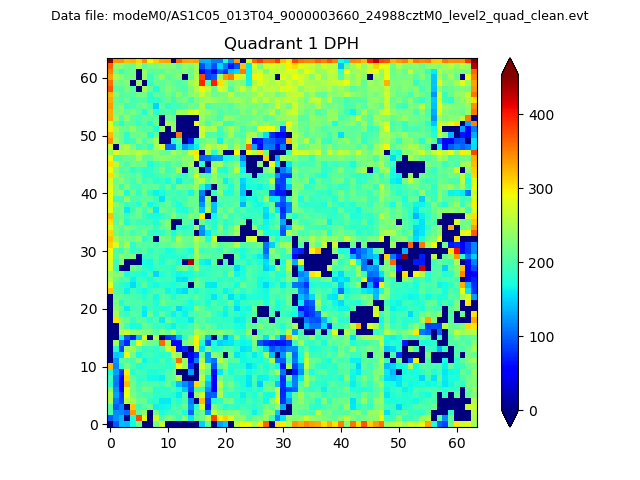 |
Quadrant B |
|---|---|---|---|
| Quadrant D | 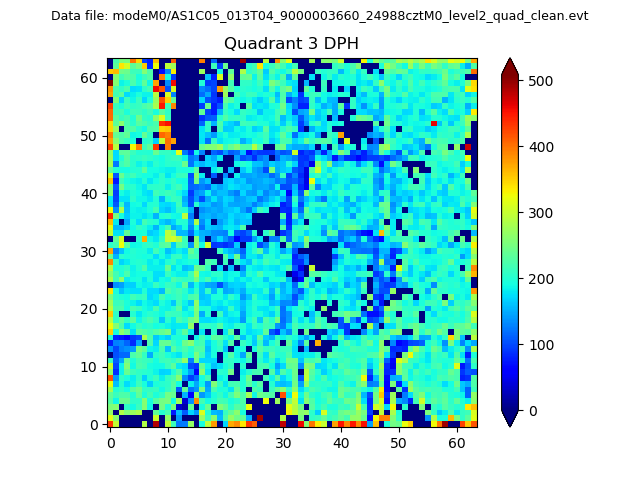 |
 |
Quadrant C |
| Plot type | Count rate plots | Images |
|---|---|---|
| Comparison with Poisson distribution Blue bars denote a histogram of data divided into 1 sec bins. Red curve is a Poisson curve with rate = median count rate of data. |
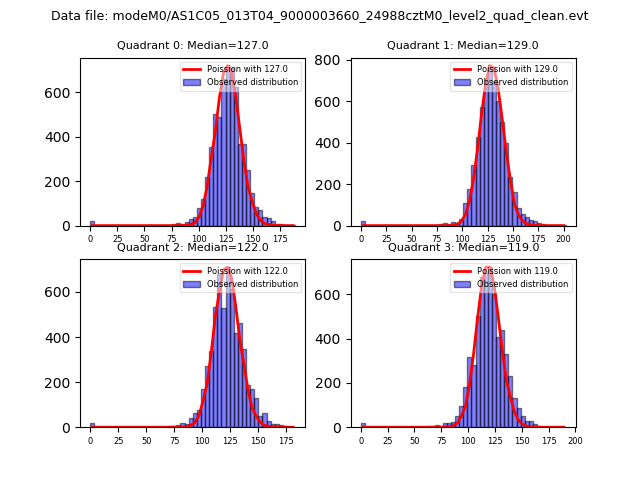 |
 |
| Quadrant-wise count rates Data is divided into 100 sec bins |
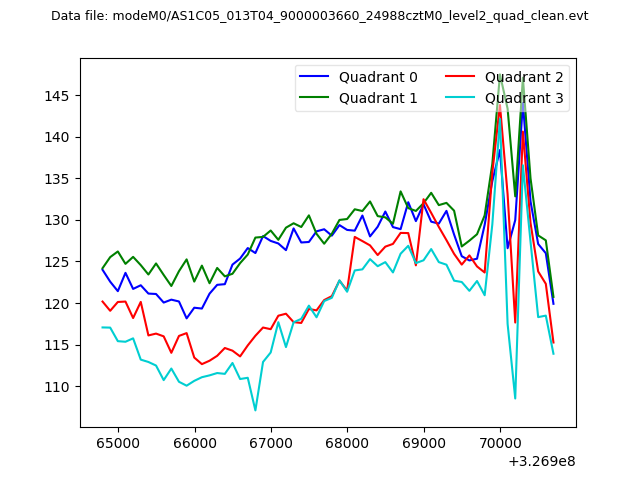 |
|
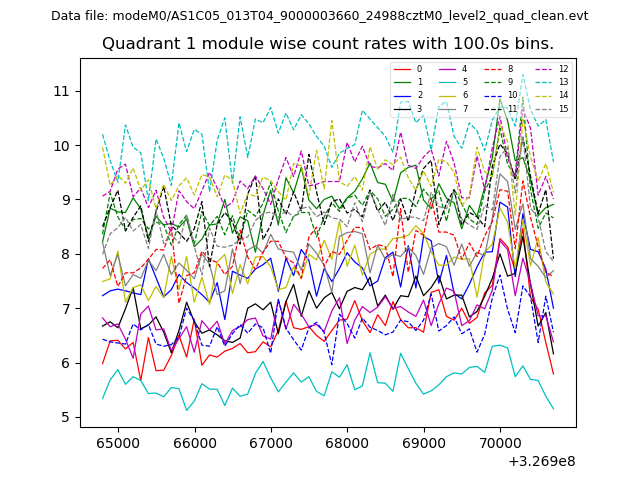
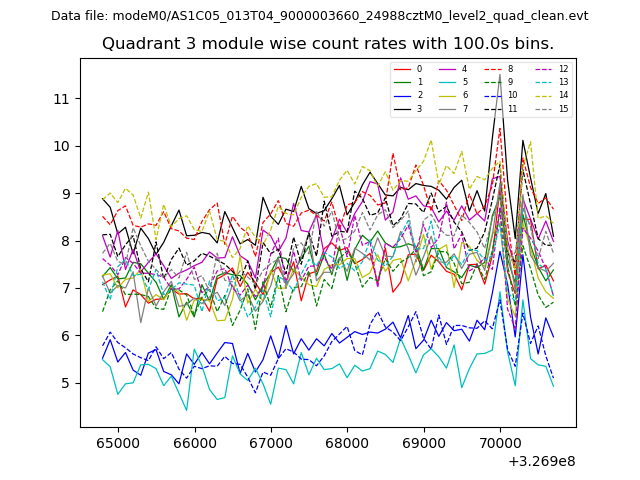
| Module-wise count rates for Quadrant A Data is divided into 100 sec bins |
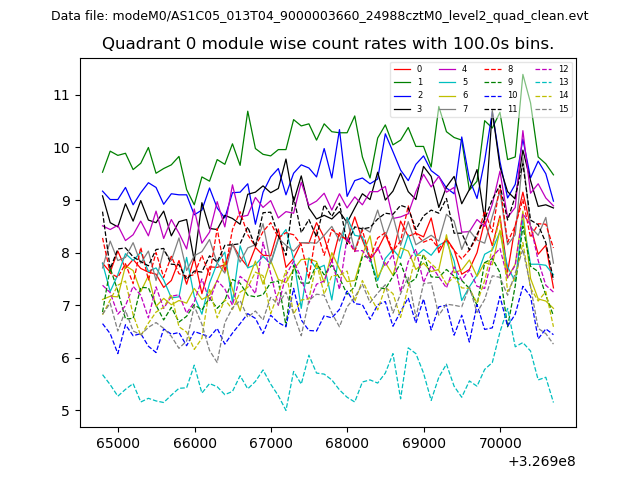 |
 |
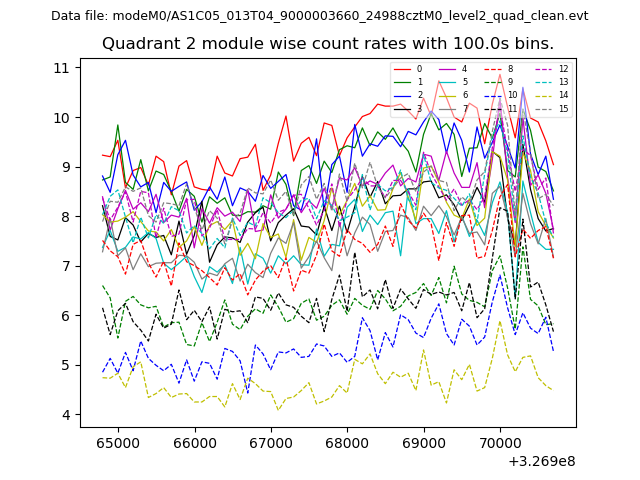
| Module-wise count rates for Quadrant B Data is divided into 100 sec bins |
 |
 |
| Module-wise count rates for Quadrant C Data is divided into 100 sec bins |
 |
 |
| Module-wise count rates for Quadrant D Data is divided into 100 sec bins |
 |
 |
| Parameter | Plot |
|---|---|
| CZT HV Monitor | 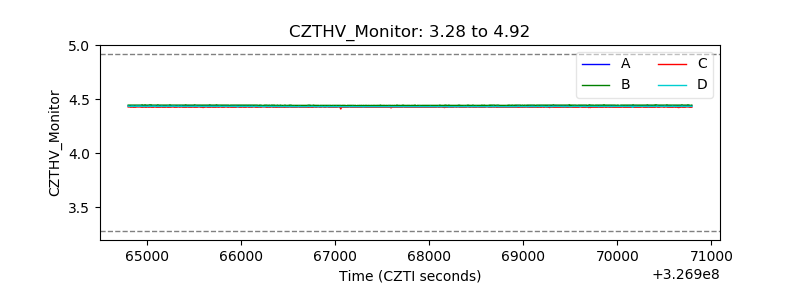 |
| D_VDD | 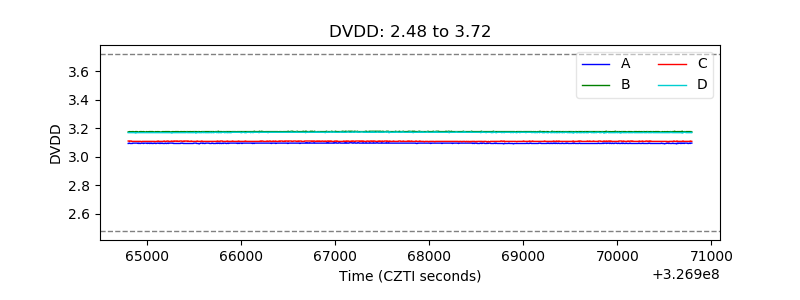 |
| Temperature 1 | 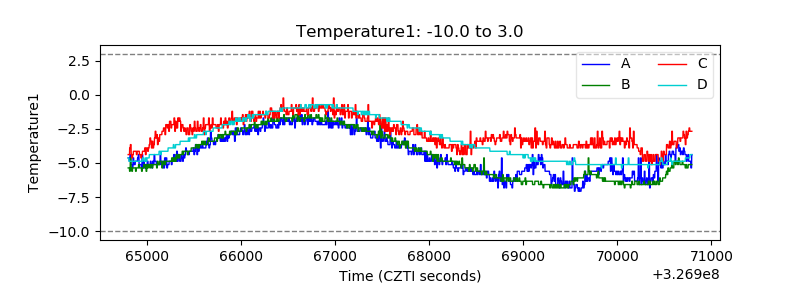 |
| Veto HV Monitor | 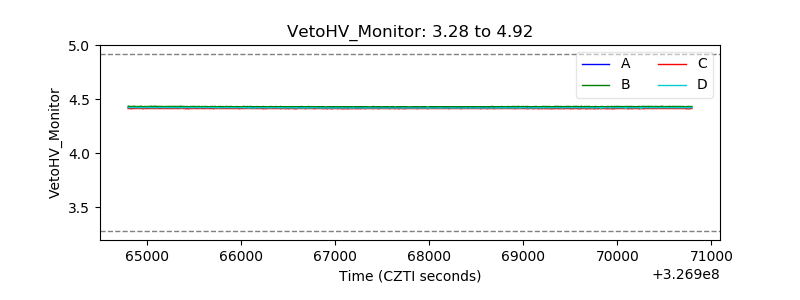 |
| Veto LLD | 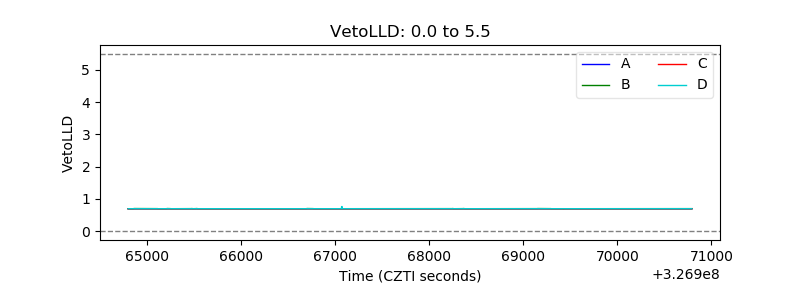 |
| Alpha Counter | 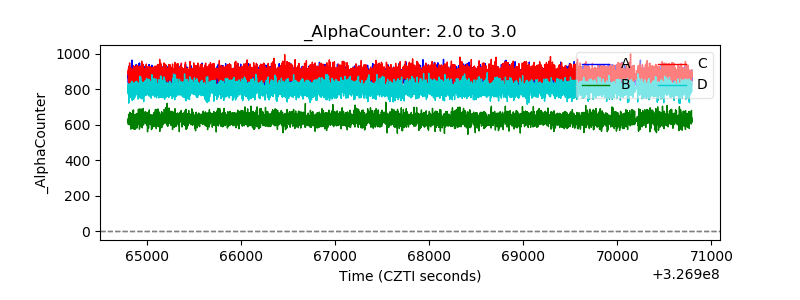 |
| _CPM_Rate | 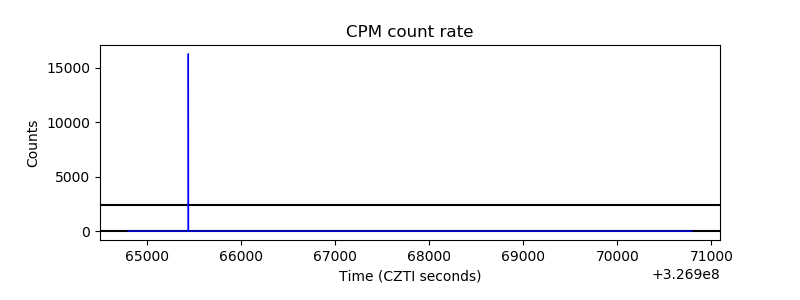 |
| CZT Counter | 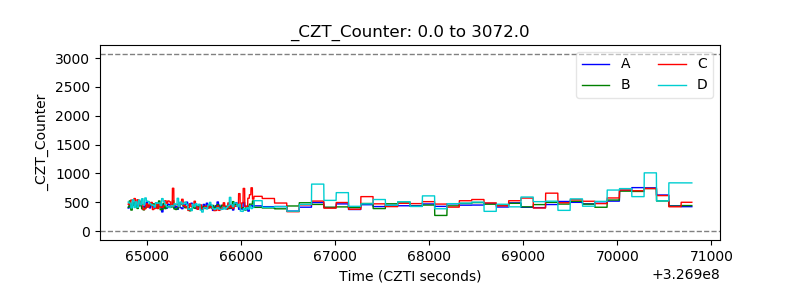 |
| +2.5 Volts monitor | 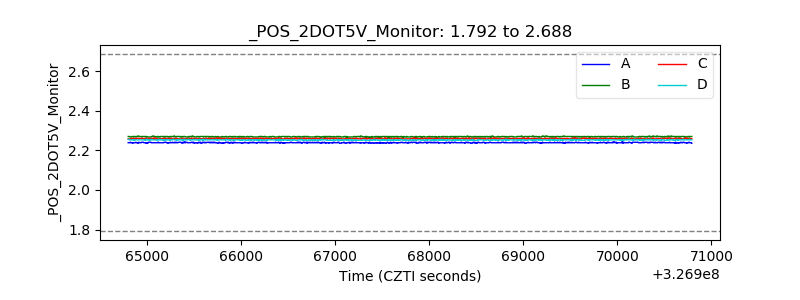 |
| +5 Volts monitor |  |
| _ROLL_ROT | 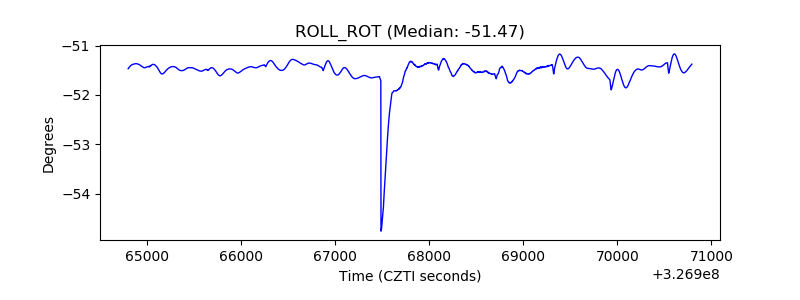 |
| _Roll_DEC | 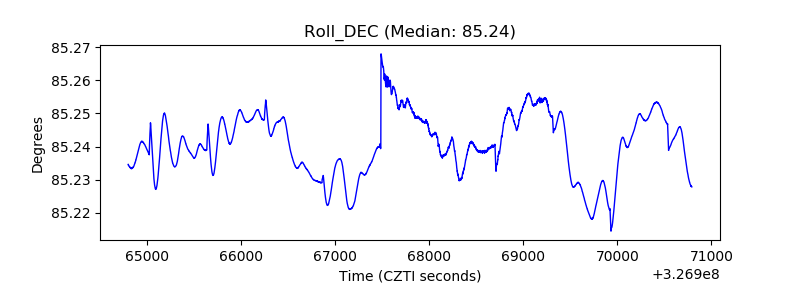 |
| _Roll_RA |  |
| Veto Counter | 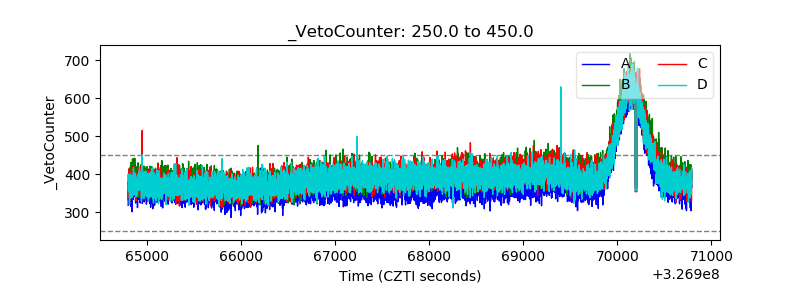 |