| Param | Original file | Final file |
|---|---|---|
| Filename | modeM0/AS1A07_027T12_9000003664_25012cztM0_level2.evt | modeM0/AS1A07_027T12_9000003664_25012cztM0_level2_quad_clean.evt |
| Size (bytes) | 394,839,360 | 81,650,880 |
| Size | 376.5 MB | 77.9 MB |
| Events in quadrant A | 2,854,527 | 530,424 |
| Events in quadrant B | 2,925,186 | 547,620 |
| Events in quadrant C | 2,925,274 | 512,901 |
| Events in quadrant D | 2,877,293 | 495,466 |
| Mode SS | |||
|---|---|---|---|
| Quadrant | BADHDUFLAG | Total packets | Discarded packets |
| A | 0 | 112 | 0 |
| B | 0 | 112 | 0 |
| C | 0 | 112 | 0 |
| D | 0 | 112 | 0 |
| Mode M0 | |||
|---|---|---|---|
| Quadrant | BADHDUFLAG | Total packets | Discarded packets |
| A | 0 | 12049 | 2 |
| B | 0 | 12176 | 2 |
| C | 0 | 12187 | 2 |
| D | 0 | 12201 | 2 |
| Mode M9 | |||
|---|---|---|---|
| Quadrant | BADHDUFLAG | Total packets | Discarded packets |
| A | 0 | 14 | 0 |
| B | 0 | 15 | 0 |
| C | 0 | 15 | 0 |
| D | 0 | 15 | 0 |
| Quadrant | Total seconds | Saturated seconds | Saturation percentage |
|---|---|---|---|
| A | 5521 | 29 | 0.525267% |
| B | 5521 | 40 | 0.724506% |
| C | 5521 | 74 | 1.340337% |
| D | 5521 | 42 | 0.760732% |
Noise dominated data is calculated using 1-second bins in cleaned event files. If a bin has >2000 counts, and if more than 50% of those come from <1% of pixels, then it is considered to be noise-dominated and hence unusable.
| Quadrant | # 1 sec bins | Bins with >0 counts | Bins with >2000 counts | High rate bins dominated by noise | Noise dominated (total time) | Noise dominated (detector-on time) | Marked lightcurve |
|---|---|---|---|---|---|---|---|
| A | 6851 | 5522 | 0 | 0 | 0.00% | 0.00% | 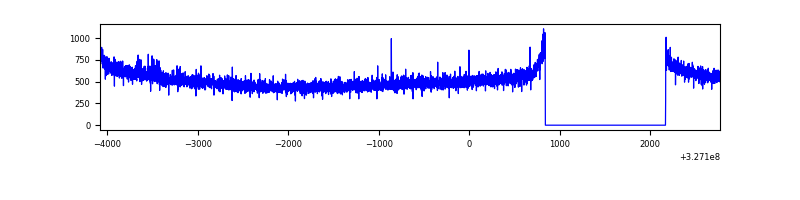 |
| B | 6851 | 5522 | 4 | 4 | 0.06% | 0.07% | 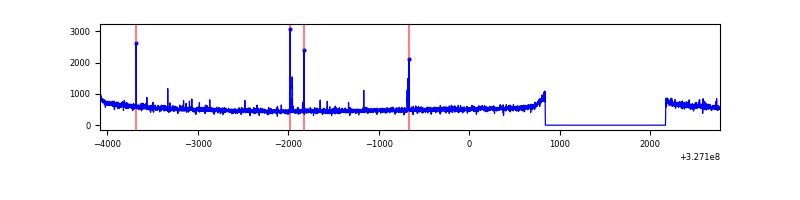 |
| C | 6851 | 5522 | 1 | 1 | 0.01% | 0.02% | 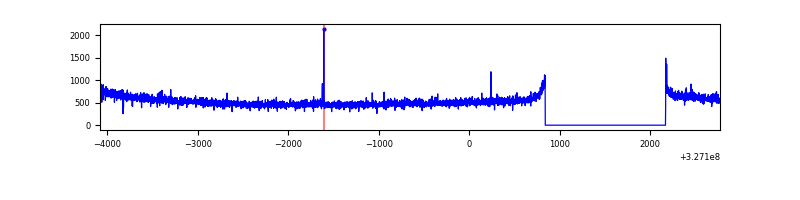 |
| D | 6851 | 5522 | 16 | 16 | 0.23% | 0.29% | 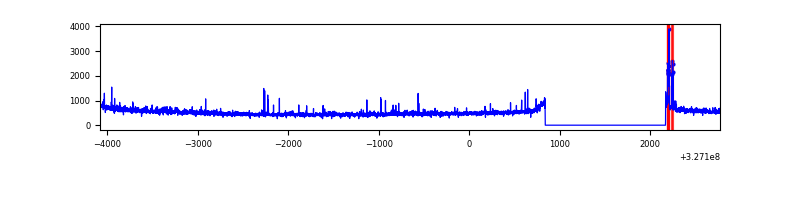 |
Top three noisy pixels from each quadrant. If the there are fewer than three noisy pixels in the level2.evt file, extra rows are filled as -1
| Pixel properties | Quadrant properties | ||||||
|---|---|---|---|---|---|---|---|
| Quadrant | DetID | PixID | Counts | Sigma | Mean | Median | Sigma |
| A | 6 | 16 | 13819 | 89.81 | 737 | 725 | 145.8 |
| A | 13 | 254 | 7675 | 47.67 | 737 | 725 | 145.8 |
| A | 0 | 226 | 6320 | 38.38 | 737 | 725 | 145.8 |
| B | 4 | 173 | 28423 | 199.92 | 739 | 722 | 138.6 |
| B | 12 | 111 | 16219 | 111.84 | 739 | 722 | 138.6 |
| B | 11 | 111 | 14636 | 100.42 | 739 | 722 | 138.6 |
| C | 14 | 238 | 115135 | 689.26 | 711 | 718 | 166.0 |
| C | 7 | 247 | 33270 | 196.1 | 711 | 718 | 166.0 |
| C | 13 | 61 | 4925 | 25.34 | 711 | 718 | 166.0 |
| D | 8 | 195 | 76363 | 440.93 | 710 | 692 | 171.6 |
| D | 10 | 70 | 59371 | 341.92 | 710 | 692 | 171.6 |
| D | 7 | 238 | 26118 | 148.16 | 710 | 692 | 171.6 |
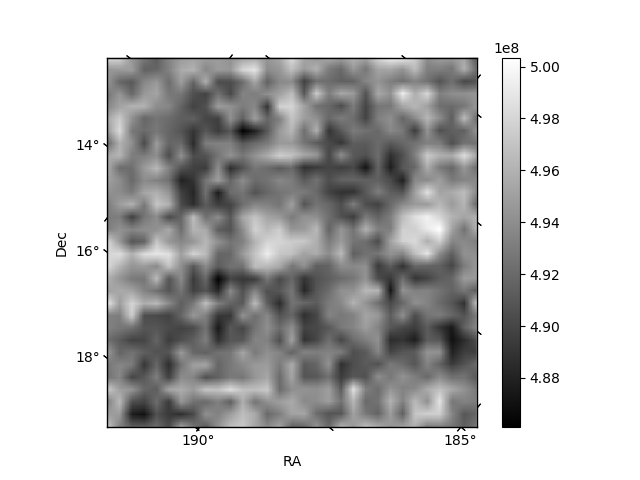
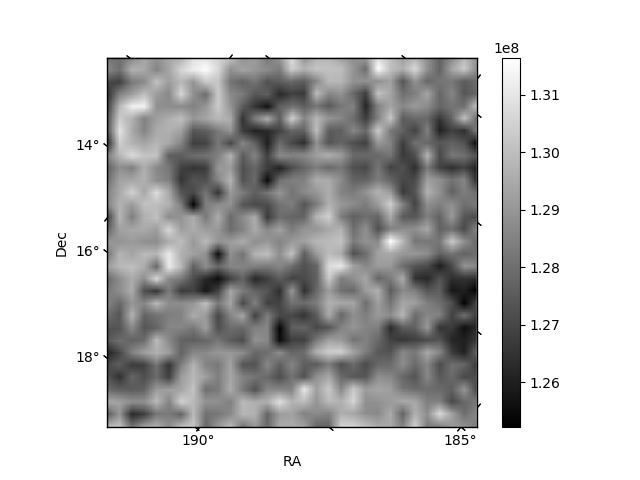
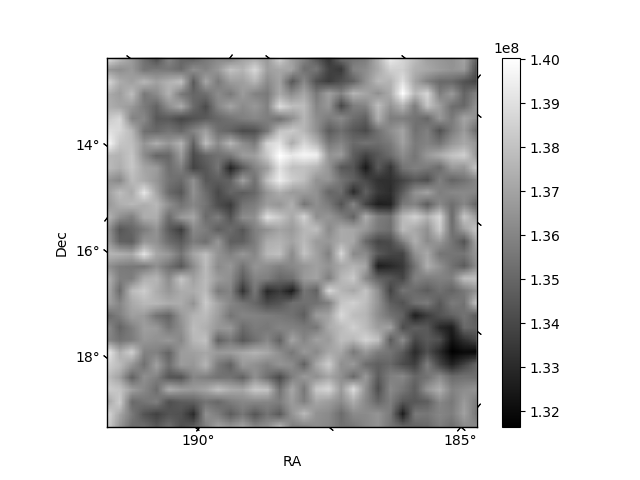
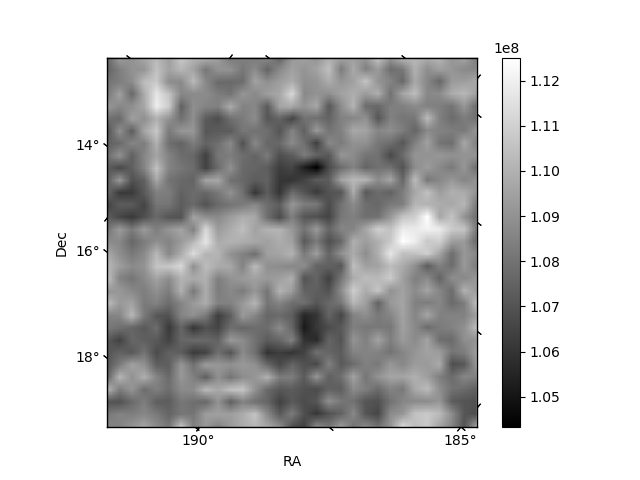
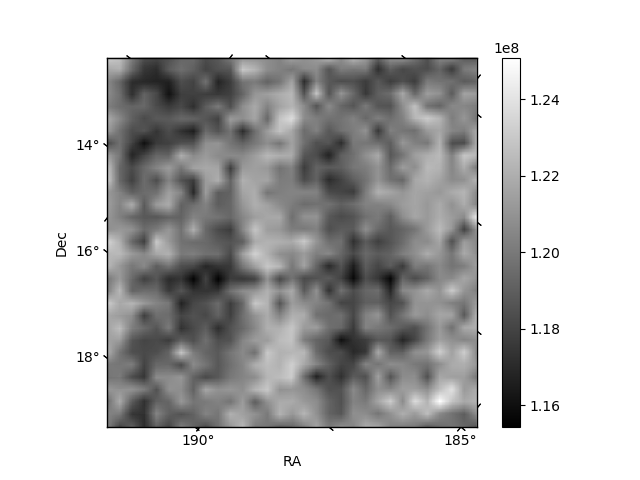
Histogram calculated using DETX and DETY for each event in the final _common_clean file
| Quadrant A | 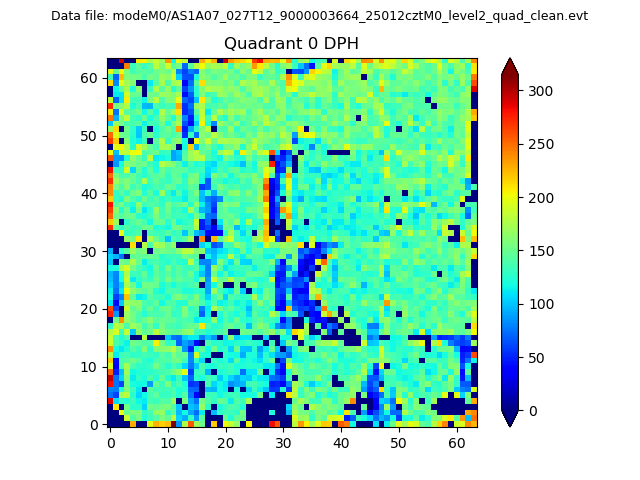 |
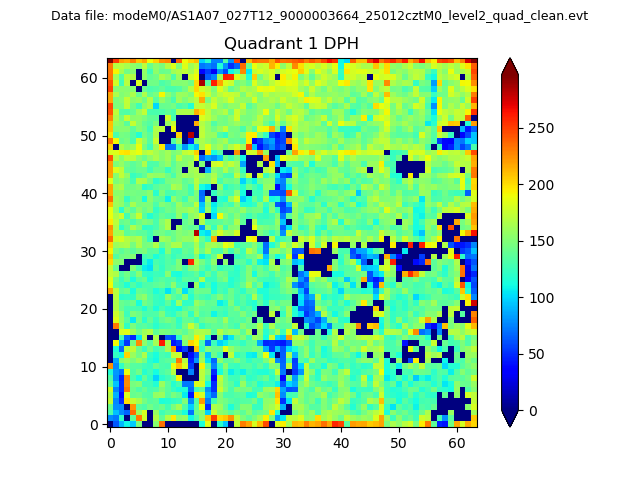 |
Quadrant B |
|---|---|---|---|
| Quadrant D | 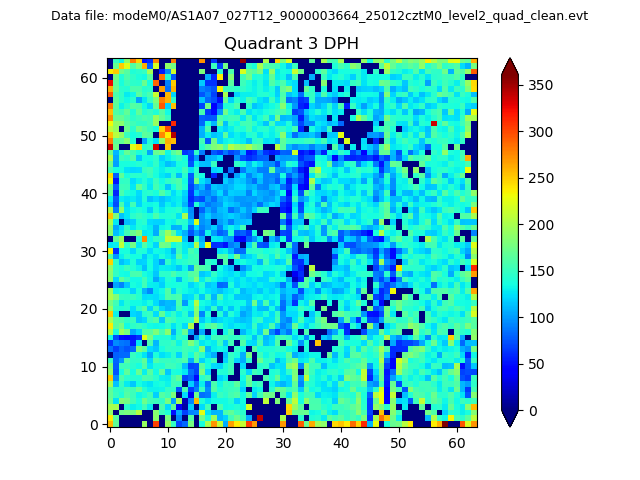 |
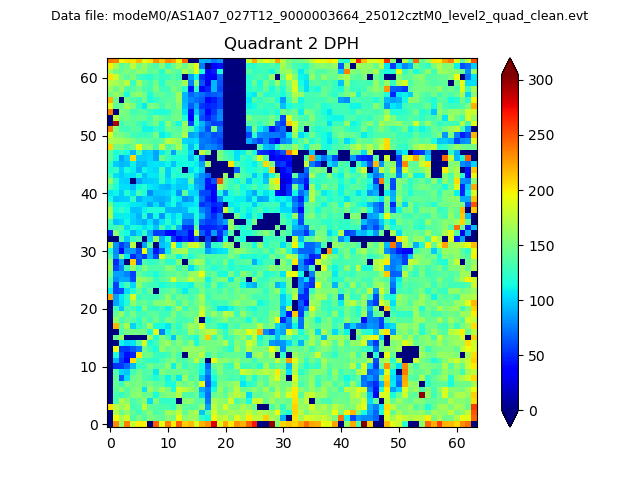 |
Quadrant C |
| Plot type | Count rate plots | Images |
|---|---|---|
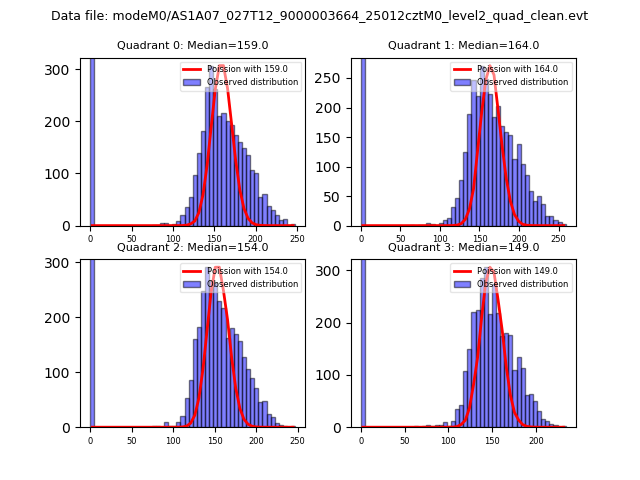
| Comparison with Poisson distribution Blue bars denote a histogram of data divided into 1 sec bins. Red curve is a Poisson curve with rate = median count rate of data. |
 |
 |
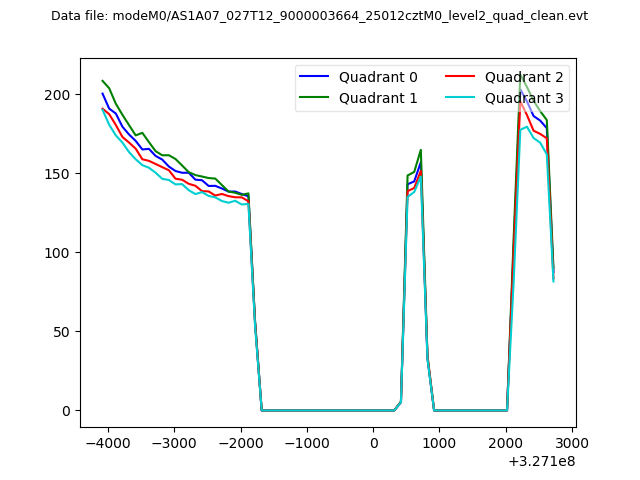
| Quadrant-wise count rates Data is divided into 100 sec bins |
 |
|
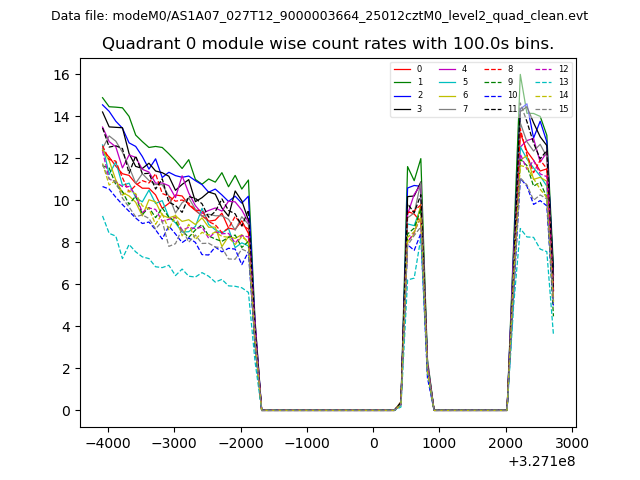
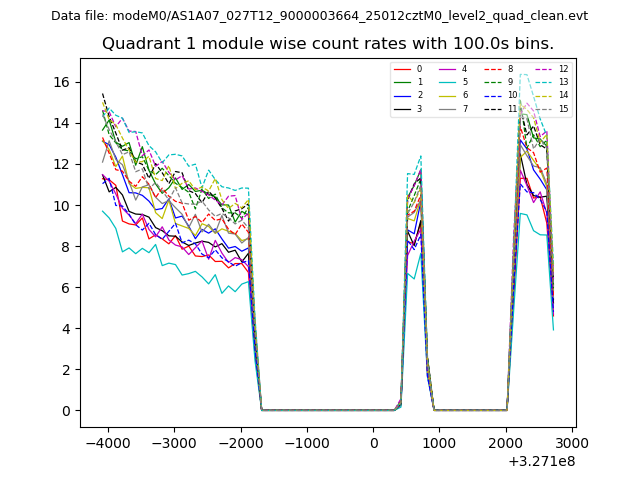
| Module-wise count rates for Quadrant A Data is divided into 100 sec bins |
 |
 |
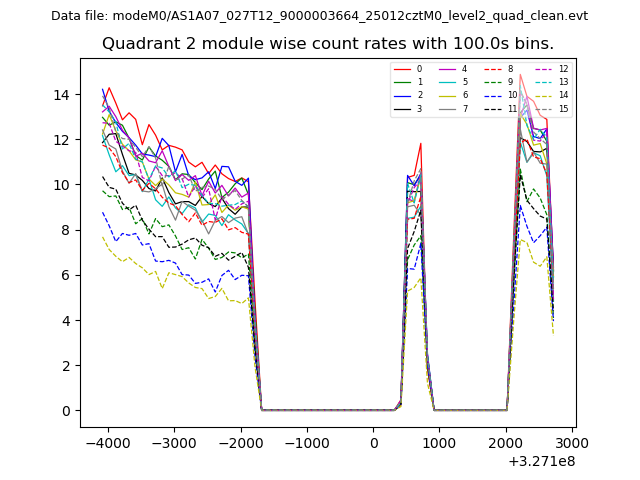
| Module-wise count rates for Quadrant B Data is divided into 100 sec bins |
 |
 |
| Module-wise count rates for Quadrant C Data is divided into 100 sec bins |
 |
 |
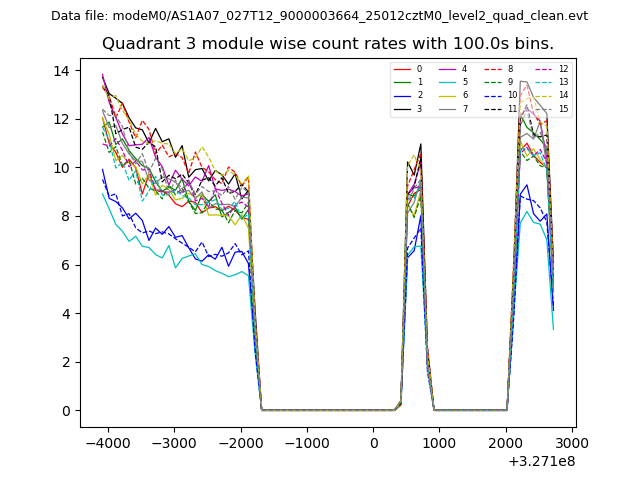
| Module-wise count rates for Quadrant D Data is divided into 100 sec bins |
 |
 |
| Parameter | Plot |
|---|---|
| CZT HV Monitor | 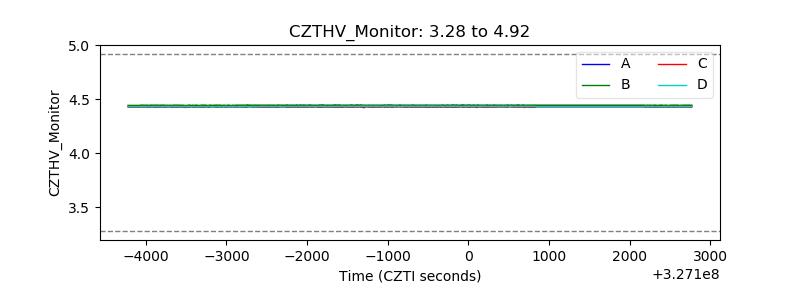 |
| D_VDD | 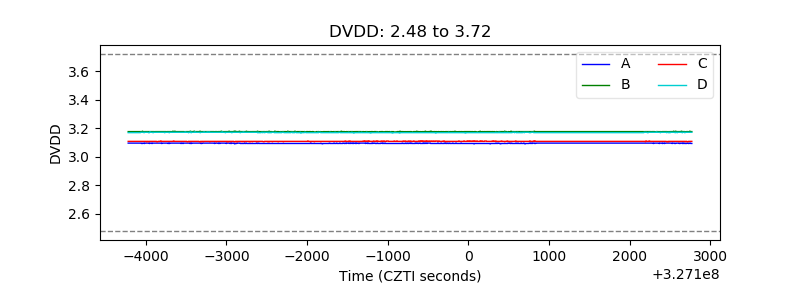 |
| Temperature 1 |  |
| Veto HV Monitor | 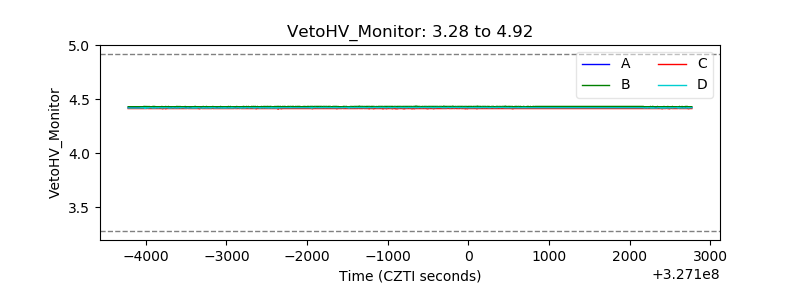 |
| Veto LLD | 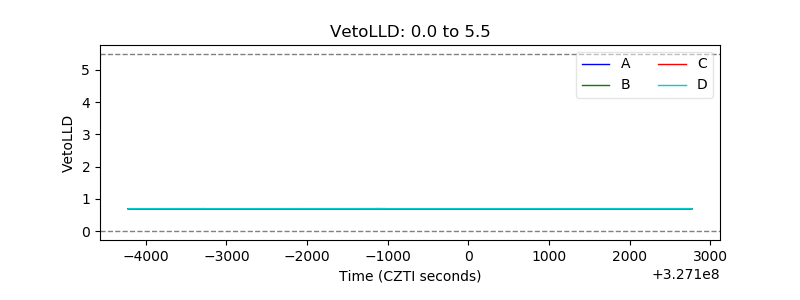 |
| Alpha Counter | 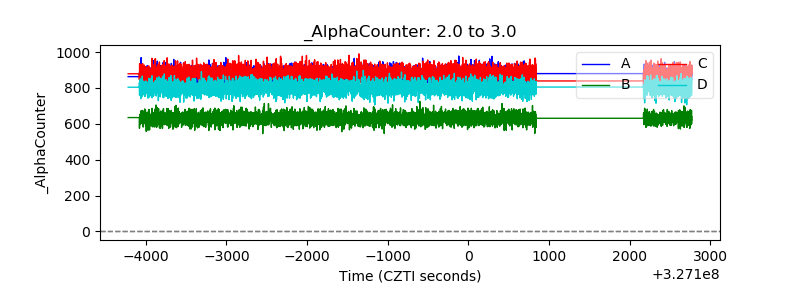 |
| _CPM_Rate | 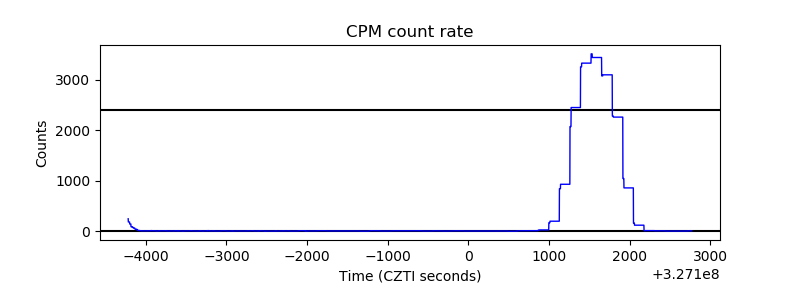 |
| CZT Counter | 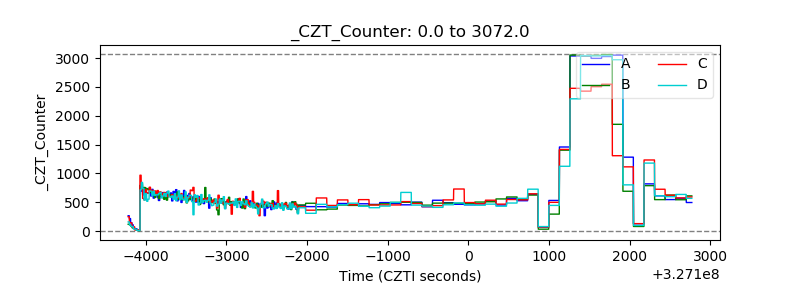 |
| +2.5 Volts monitor |  |
| +5 Volts monitor |  |
| _ROLL_ROT | 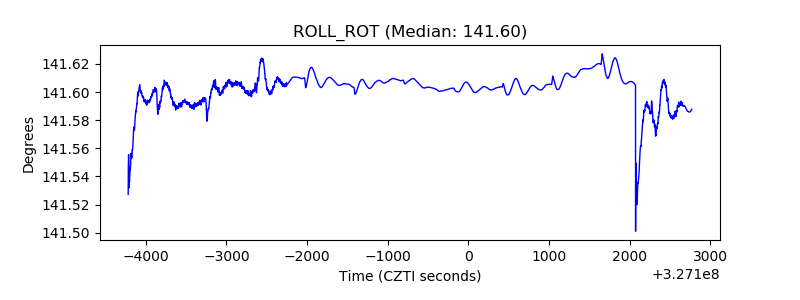 |
| _Roll_DEC |  |
| _Roll_RA | 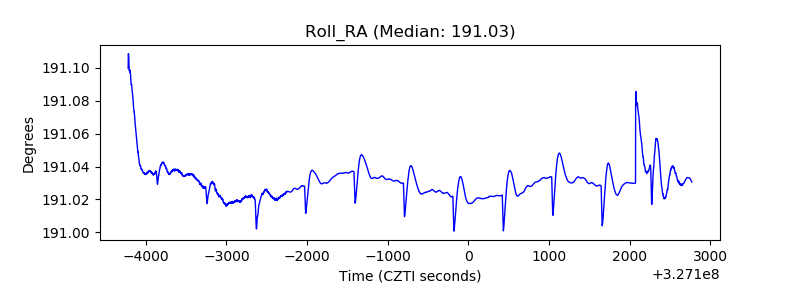 |
| Veto Counter | 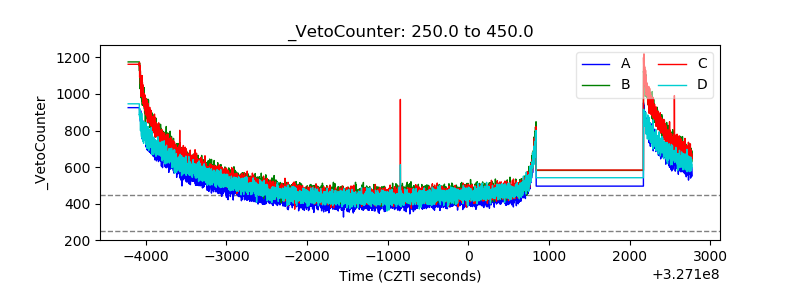 |