| Param | Original file | Final file |
|---|---|---|
| Filename | modeM0/AS1A07_027T16_9000003666cztM0_level2.fits | modeM0/AS1A07_027T16_9000003666cztM0_level2_quad_clean.evt |
| Size (bytes) | 540,927,360 | 461,033,280 |
| Size | 515.9 MB | 439.7 MB |
| Events in quadrant A | 3,374,982 | 2,779,250 |
| Events in quadrant B | 3,239,898 | 2,799,948 |
| Events in quadrant C | 3,043,990 | 2,133,067 |
| Events in quadrant D | 2,880,516 | 2,411,774 |
| Mode SS | |||
|---|---|---|---|
| Quadrant | BADHDUFLAG | Total packets | Discarded packets |
| A | 0 | 1136 | 0 |
| B | 0 | 1136 | 0 |
| C | 0 | 1136 | 0 |
| D | 0 | 1136 | 0 |
| Mode M9 | |||
|---|---|---|---|
| Quadrant | BADHDUFLAG | Total packets | Discarded packets |
| A | 0 | 76 | 0 |
| B | 0 | 76 | 0 |
| C | 0 | 76 | 0 |
| D | 0 | 76 | 0 |
| Mode M0 | |||
|---|---|---|---|
| Quadrant | BADHDUFLAG | Total packets | Discarded packets |
| A | 0 | 115082 | 0 |
| B | 0 | 117777 | 0 |
| C | 0 | 221802 | 0 |
| D | 0 | 139706 | 0 |
| Quadrant | Total seconds | Saturated seconds | Saturation percentage |
|---|---|---|---|
| A | 55921 | 640 | 1.144472% |
| B | 55921 | 905 | 1.618354% |
| C | 55921 | 12730 | 22.764257% |
| D | 55921 | 2185 | 3.907298% |
Noise dominated data is calculated using 1-second bins in cleaned event files. If a bin has >2000 counts, and if more than 50% of those come from <1% of pixels, then it is considered to be noise-dominated and hence unusable.
| Quadrant | # 1 sec bins | Bins with >0 counts | Bins with >2000 counts | High rate bins dominated by noise | Noise dominated (total time) | Noise dominated (detector-on time) | Marked lightcurve |
|---|---|---|---|---|---|---|---|
| A | 63496 | 55920 | 0 | 0 | 0.00% | 0.00% | 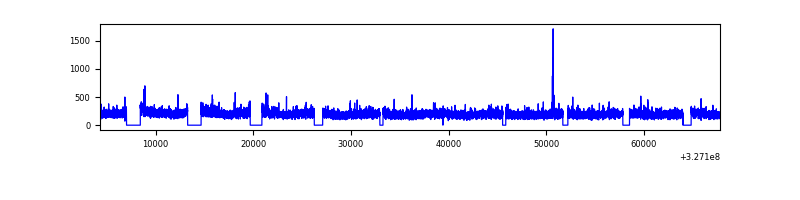 |
| B | 63496 | 55920 | 0 | 0 | 0.00% | 0.00% |  |
| C | 63495 | 55918 | 0 | 0 | 0.00% | 0.00% | 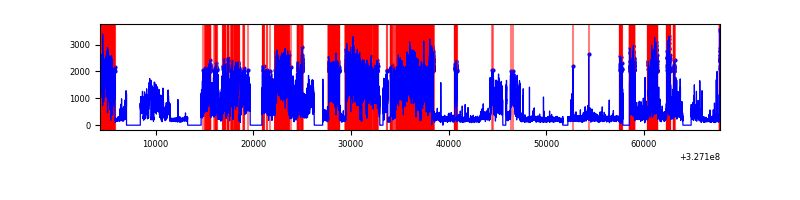 |
| D | 63496 | 55642 | 0 | 0 | 0.00% | 0.00% | 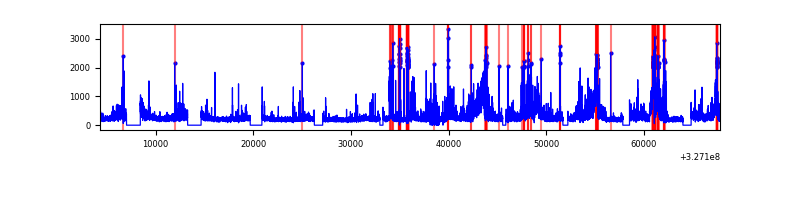 |
Top three noisy pixels from each quadrant. If the there are fewer than three noisy pixels in the level2.evt file, extra rows are filled as -1
| Pixel properties | Quadrant properties | ||||||
|---|---|---|---|---|---|---|---|
| Quadrant | DetID | PixID | Counts | Sigma | Mean | Median | Sigma |
| A | 0 | 29 | 3261 | 11.33 | 878 | 827 | 214.9 |
| A | 7 | 110 | 2763 | 9.01 | 878 | 827 | 214.9 |
| A | 0 | 30 | 2620 | 8.35 | 878 | 827 | 214.9 |
| B | 2 | 9 | 2602 | 10.67 | 856 | 818 | 167.2 |
| B | 2 | 8 | 2270 | 8.68 | 856 | 818 | 167.2 |
| B | 3 | 80 | 2205 | 8.29 | 856 | 818 | 167.2 |
| C | 1 | 80 | 2364 | 7.85 | 803 | 753 | 205.2 |
| C | 1 | 81 | 2343 | 7.75 | 803 | 753 | 205.2 |
| C | 12 | 241 | 2184 | 6.97 | 803 | 753 | 205.2 |
| D | 15 | 46 | 2095 | 6.2 | 820 | 747 | 217.4 |
| D | 3 | 14 | 2073 | 6.1 | 820 | 747 | 217.4 |
| D | 6 | 231 | 2031 | 5.9 | 820 | 747 | 217.4 |
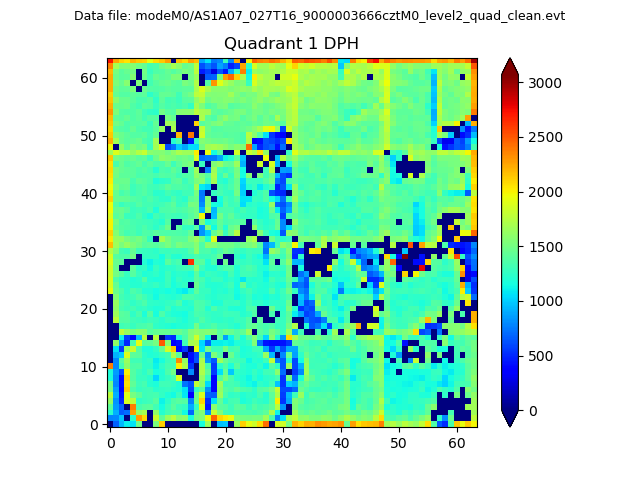
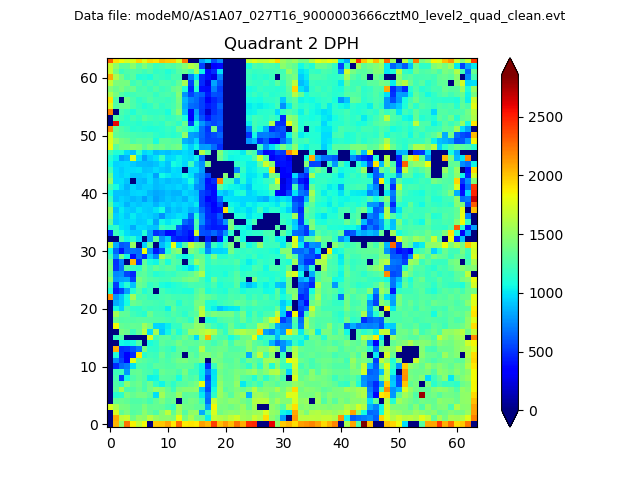
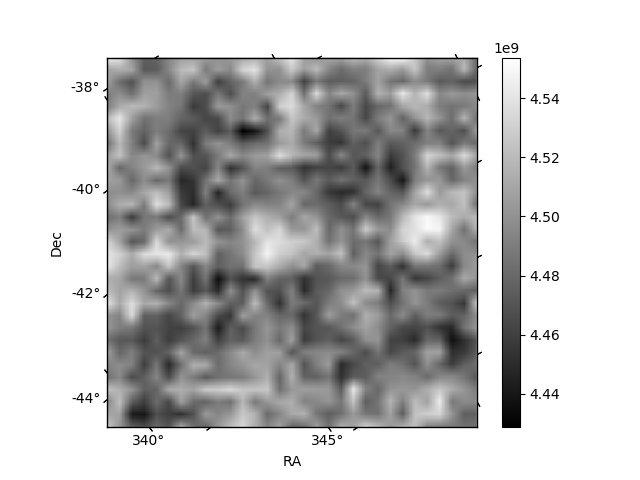
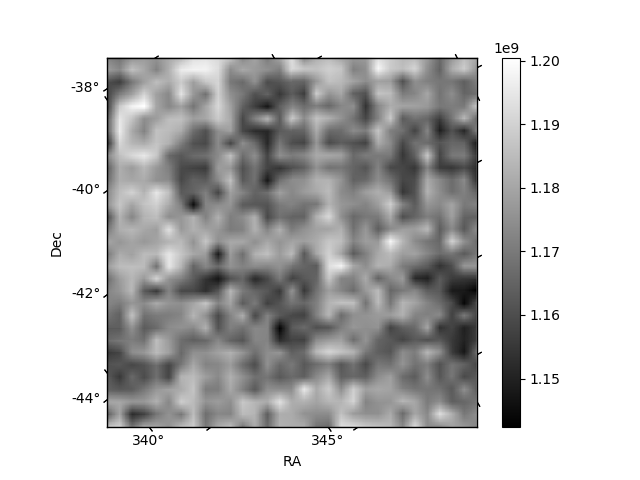
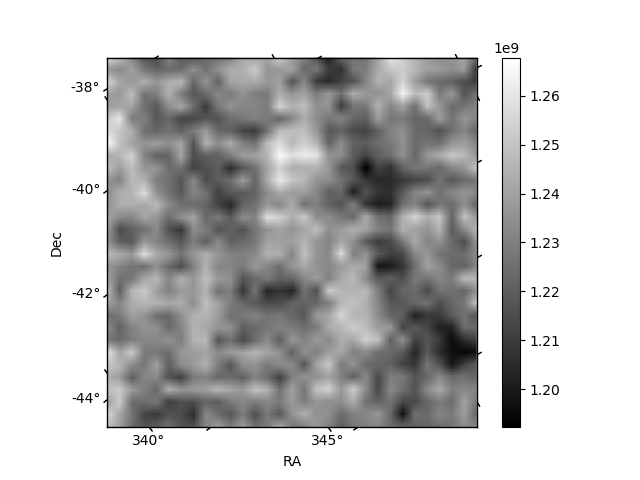
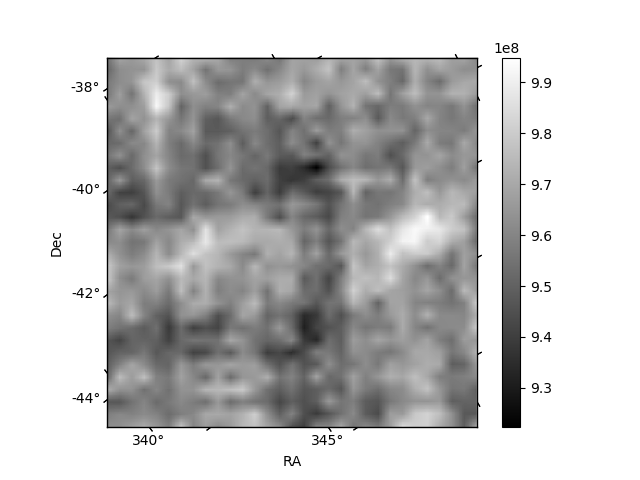
Histogram calculated using DETX and DETY for each event in the final _common_clean file
| Quadrant A | 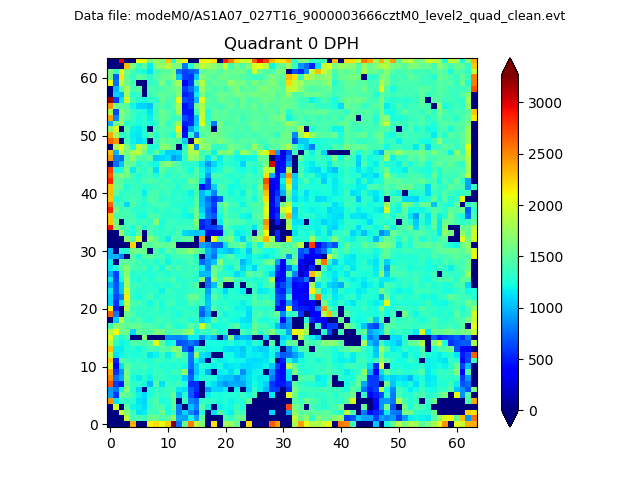 |
 |
Quadrant B |
|---|---|---|---|
| Quadrant D | 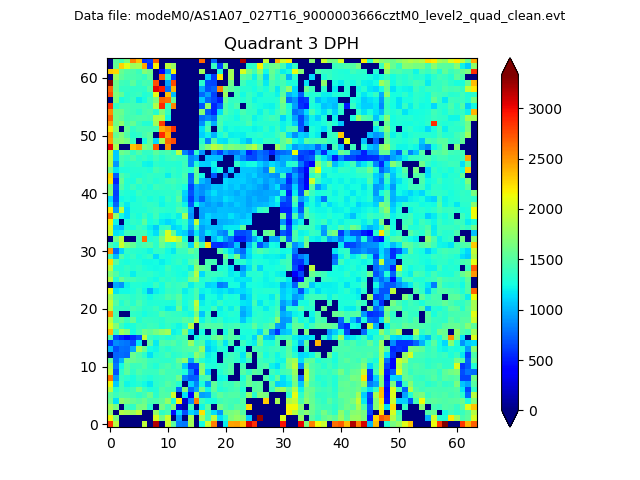 |
 |
Quadrant C |
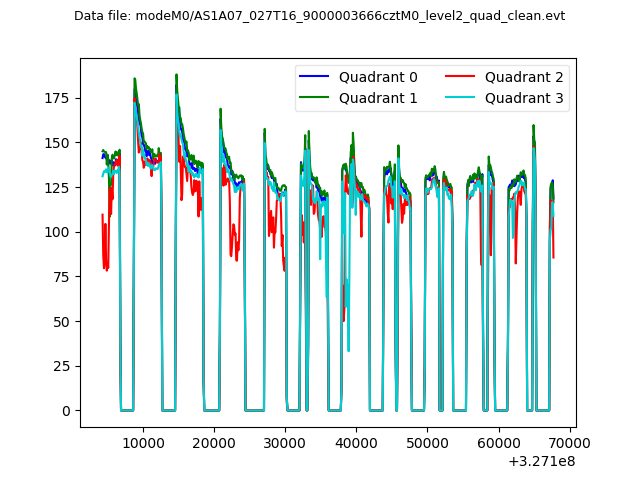
| Plot type | Count rate plots | Images |
|---|---|---|
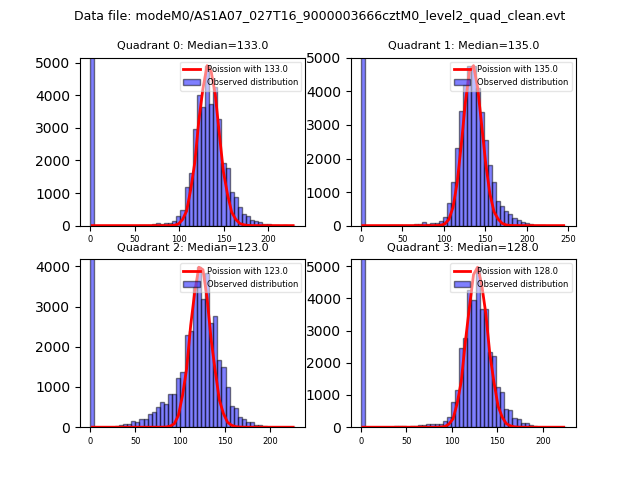
| Comparison with Poisson distribution Blue bars denote a histogram of data divided into 1 sec bins. Red curve is a Poisson curve with rate = median count rate of data. |
 |
 |
| Quadrant-wise count rates Data is divided into 100 sec bins |
 |
|
| Module-wise count rates for Quadrant A Data is divided into 100 sec bins |
 |
 |
| Module-wise count rates for Quadrant B Data is divided into 100 sec bins |
 |
 |
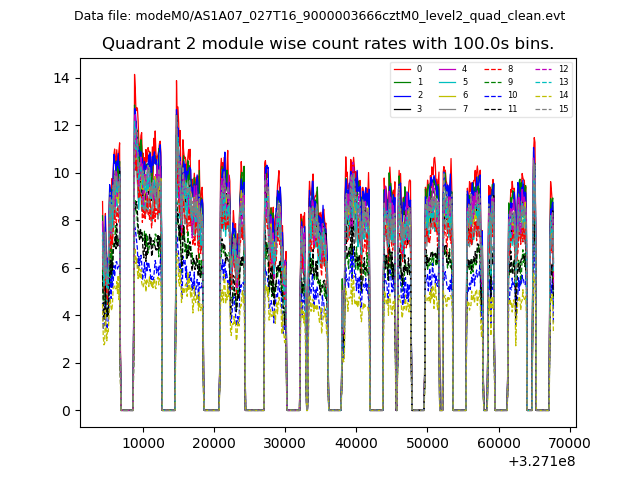
| Module-wise count rates for Quadrant C Data is divided into 100 sec bins |
 |
 |
| Module-wise count rates for Quadrant D Data is divided into 100 sec bins |
 |
 |
| Parameter | Plot |
|---|---|
| CZT HV Monitor | 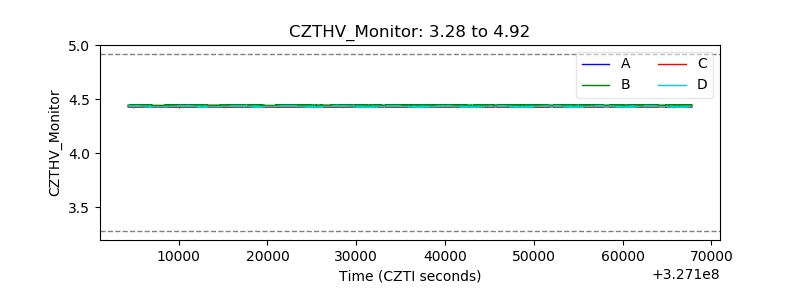 |
| D_VDD | 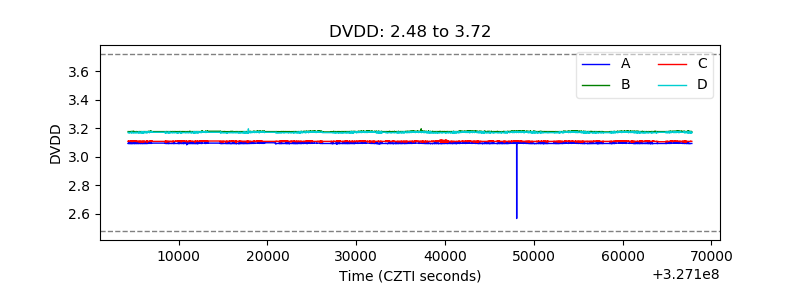 |
| Temperature 1 |  |
| Veto HV Monitor | 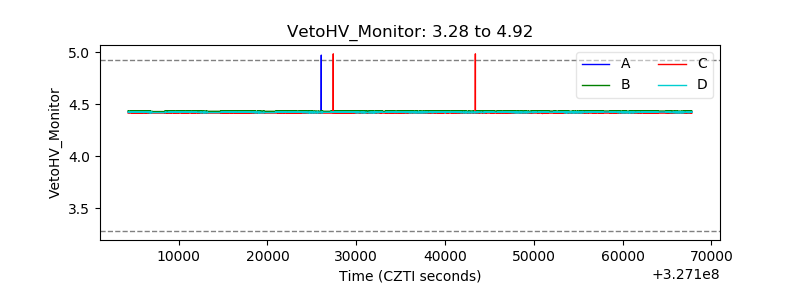 |
| Veto LLD | 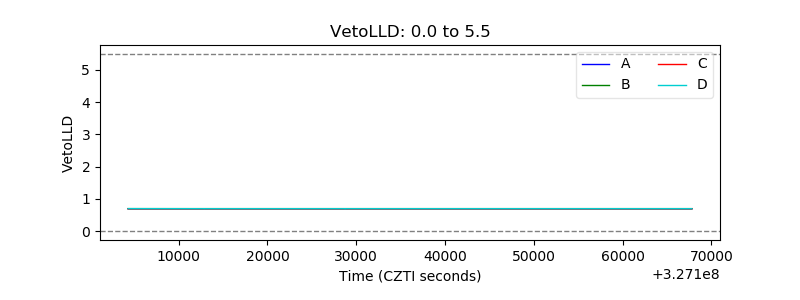 |
| Alpha Counter |  |
| _CPM_Rate | 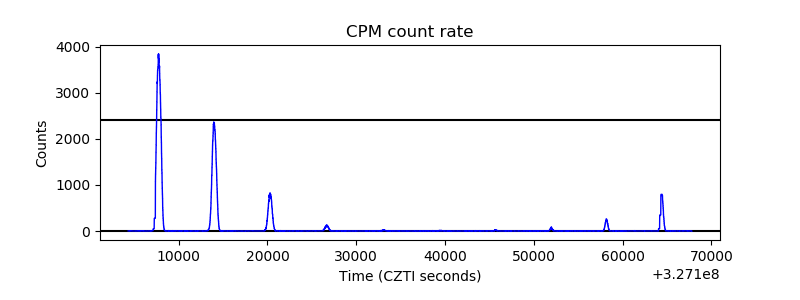 |
| CZT Counter | 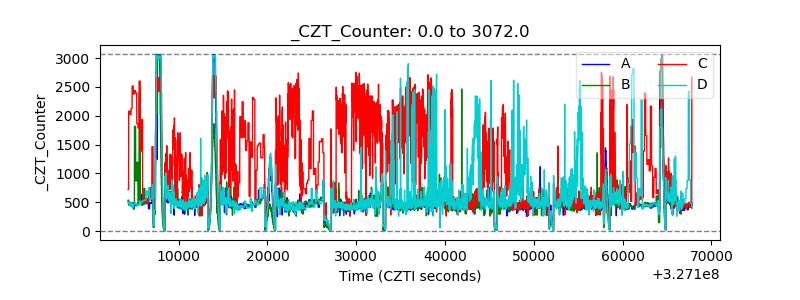 |
| +2.5 Volts monitor |  |
| +5 Volts monitor | 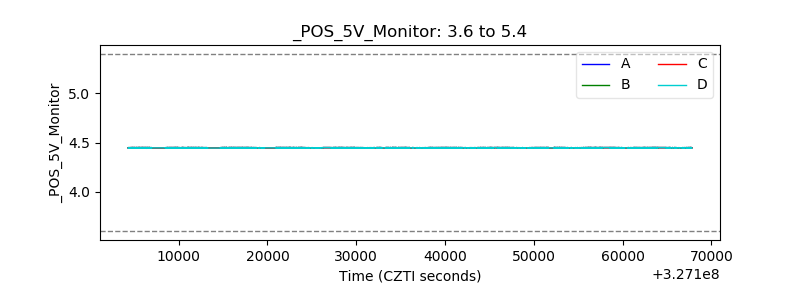 |
| _ROLL_ROT | 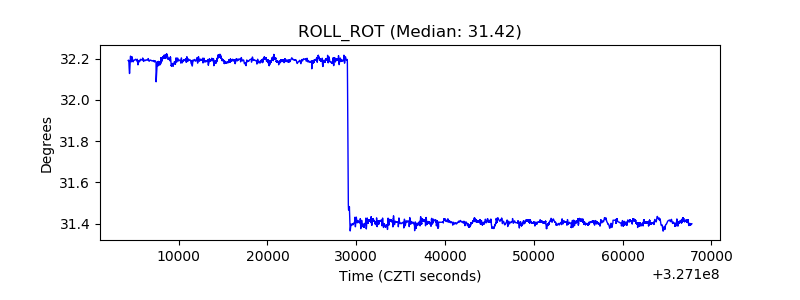 |
| _Roll_DEC | 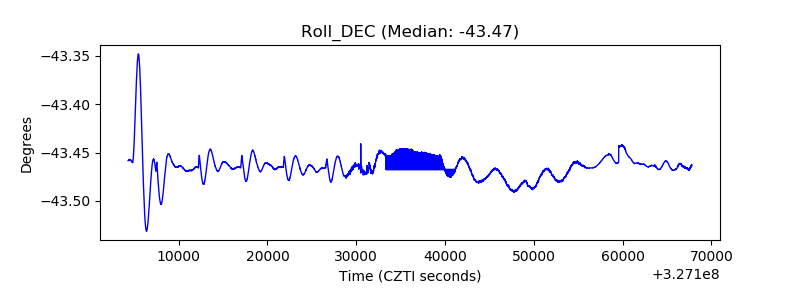 |
| _Roll_RA | 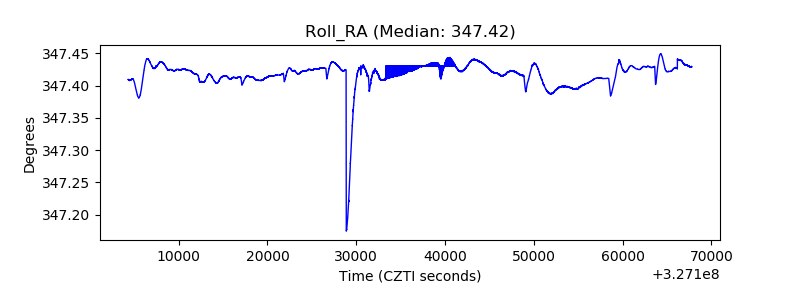 |
| Veto Counter | 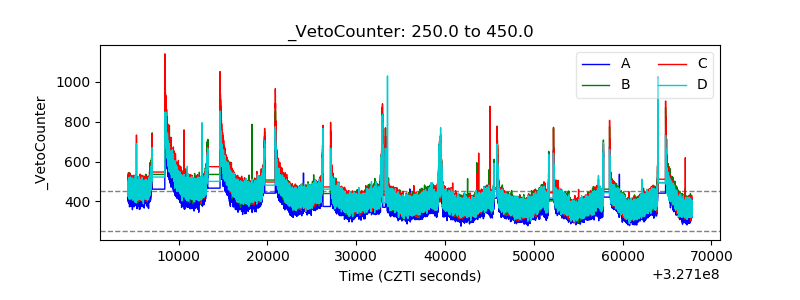 |