| Param | Original file | Final file |
|---|---|---|
| Filename | modeM0/AS1A07_027T16_9000003666_25012cztM0_level2.evt | modeM0/AS1A07_027T16_9000003666_25012cztM0_level2_quad_clean.evt |
| Size (bytes) | 405,469,440 | 72,987,840 |
| Size | 386.7 MB | 69.6 MB |
| Events in quadrant A | 2,022,687 | 506,123 |
| Events in quadrant B | 2,543,411 | 511,247 |
| Events in quadrant C | 5,227,462 | 432,816 |
| Events in quadrant D | 2,218,262 | 481,817 |
| Mode SS | |||
|---|---|---|---|
| Quadrant | BADHDUFLAG | Total packets | Discarded packets |
| A | 0 | 80 | 0 |
| B | 0 | 80 | 0 |
| C | 0 | 80 | 0 |
| D | 0 | 80 | 0 |
| Mode M9 | |||
|---|---|---|---|
| Quadrant | BADHDUFLAG | Total packets | Discarded packets |
| A | 0 | 14 | 0 |
| B | 0 | 14 | 0 |
| C | 0 | 14 | 0 |
| D | 0 | 14 | 0 |
| Mode M0 | |||
|---|---|---|---|
| Quadrant | BADHDUFLAG | Total packets | Discarded packets |
| A | 0 | 8443 | 1 |
| B | 0 | 10056 | 1 |
| C | 0 | 18227 | 1 |
| D | 0 | 9129 | 1 |
| Quadrant | Total seconds | Saturated seconds | Saturation percentage |
|---|---|---|---|
| A | 3937 | 26 | 0.660401% |
| B | 3937 | 179 | 4.546609% |
| C | 3937 | 1234 | 31.343663% |
| D | 3937 | 20 | 0.508001% |
Noise dominated data is calculated using 1-second bins in cleaned event files. If a bin has >2000 counts, and if more than 50% of those come from <1% of pixels, then it is considered to be noise-dominated and hence unusable.
| Quadrant | # 1 sec bins | Bins with >0 counts | Bins with >2000 counts | High rate bins dominated by noise | Noise dominated (total time) | Noise dominated (detector-on time) | Marked lightcurve |
|---|---|---|---|---|---|---|---|
| A | 5352 | 3938 | 0 | 0 | 0.00% | 0.00% | 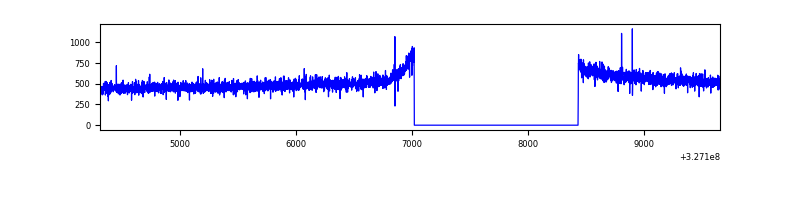 |
| B | 5352 | 3938 | 97 | 97 | 1.81% | 2.46% | 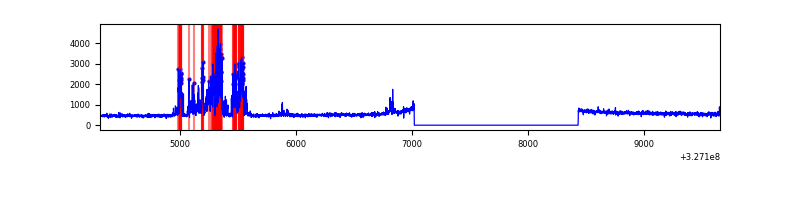 |
| C | 5352 | 3938 | 930 | 930 | 17.38% | 23.62% | 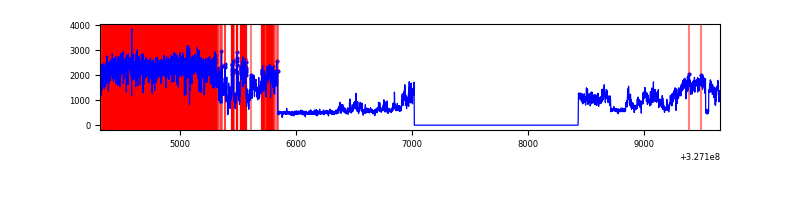 |
| D | 5352 | 3938 | 6 | 6 | 0.11% | 0.15% | 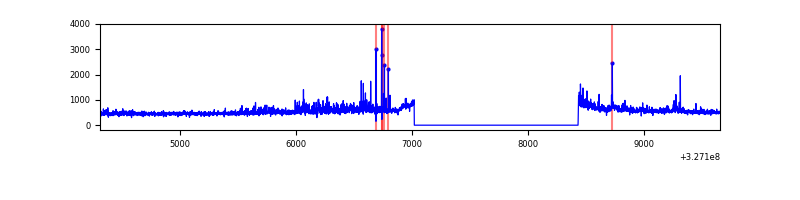 |
Top three noisy pixels from each quadrant. If the there are fewer than three noisy pixels in the level2.evt file, extra rows are filled as -1
| Pixel properties | Quadrant properties | ||||||
|---|---|---|---|---|---|---|---|
| Quadrant | DetID | PixID | Counts | Sigma | Mean | Median | Sigma |
| A | 13 | 254 | 5785 | 50.36 | 525 | 515 | 104.7 |
| A | 0 | 226 | 4603 | 39.06 | 525 | 515 | 104.7 |
| A | 3 | 137 | 4520 | 38.27 | 525 | 515 | 104.7 |
| B | 6 | 36 | 490986 | 5053.27 | 519 | 508 | 97.1 |
| B | 0 | 190 | 19522 | 195.9 | 519 | 508 | 97.1 |
| B | 12 | 111 | 11445 | 112.68 | 519 | 508 | 97.1 |
| C | 7 | 247 | 3292677 | 30103.46 | 472 | 476 | 109.4 |
| C | 14 | 238 | 76638 | 696.42 | 472 | 476 | 109.4 |
| C | 7 | 226 | 9334 | 81.0 | 472 | 476 | 109.4 |
| D | 8 | 195 | 171321 | 1381.15 | 514 | 500 | 123.7 |
| D | 10 | 70 | 66327 | 532.24 | 514 | 500 | 123.7 |
| D | 2 | 153 | 19773 | 155.83 | 514 | 500 | 123.7 |
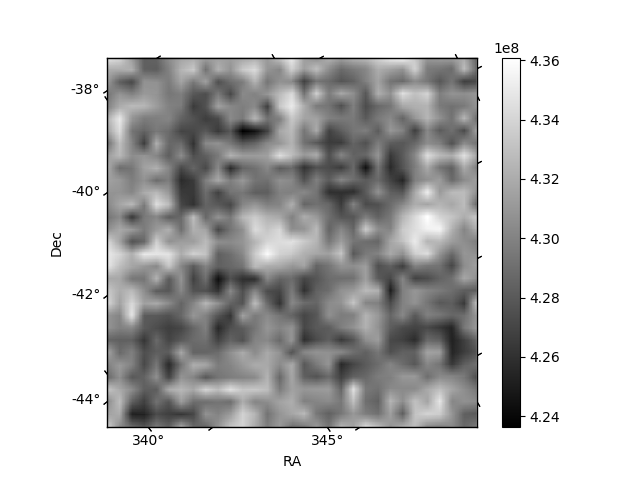
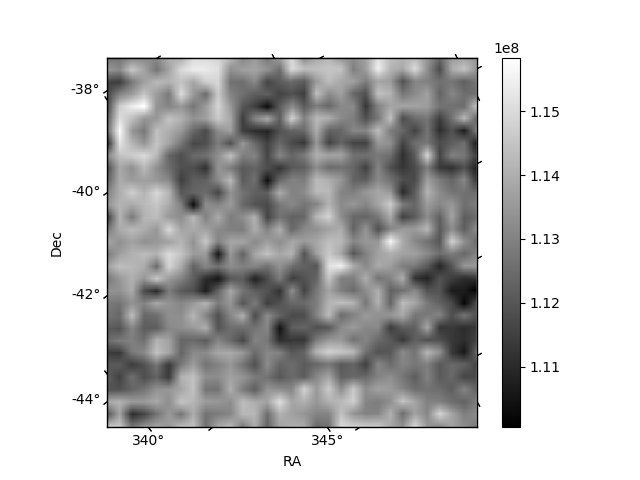
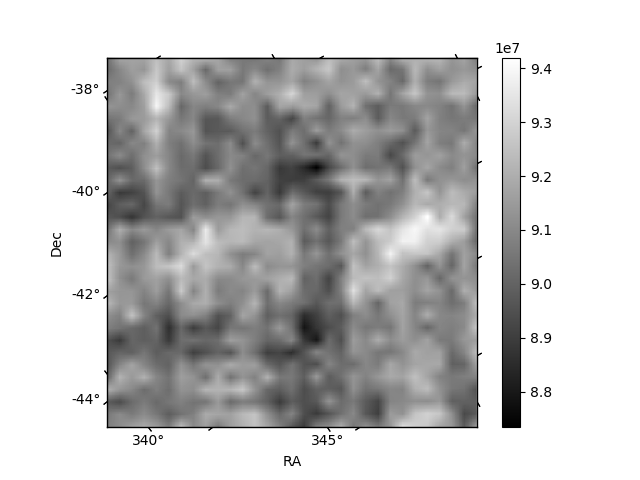
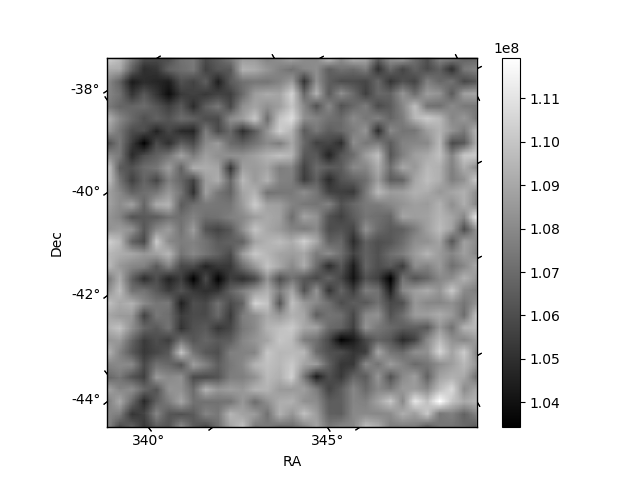
Histogram calculated using DETX and DETY for each event in the final _common_clean file
| Quadrant A | 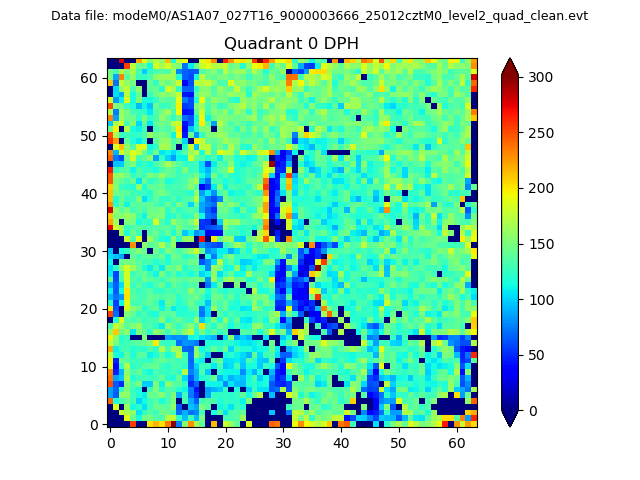 |
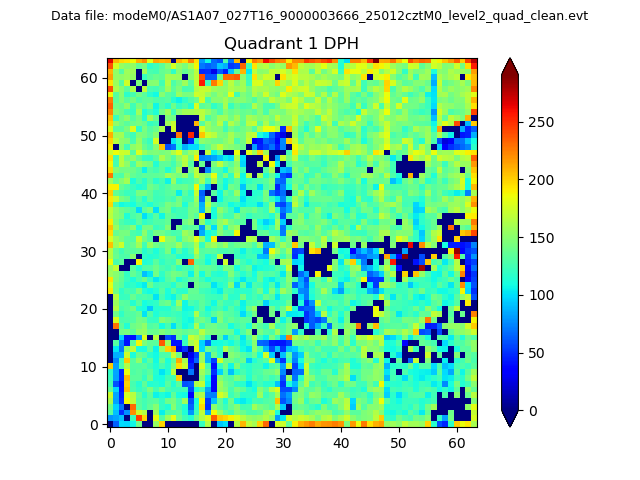 |
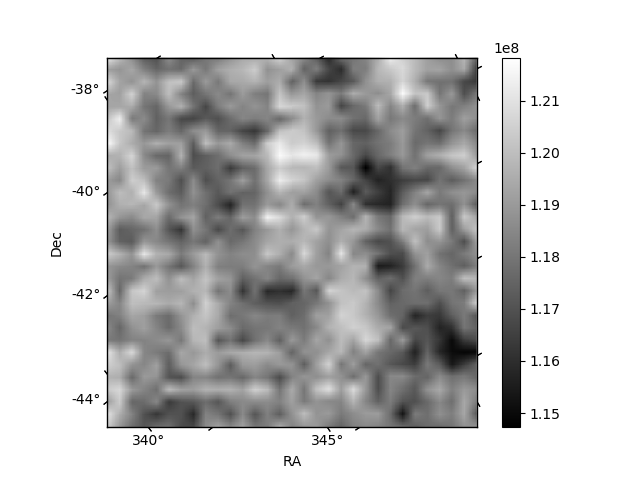
Quadrant B |
|---|---|---|---|
| Quadrant D | 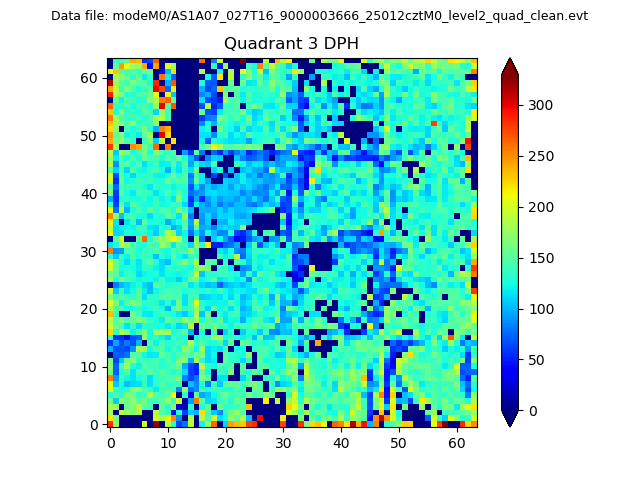 |
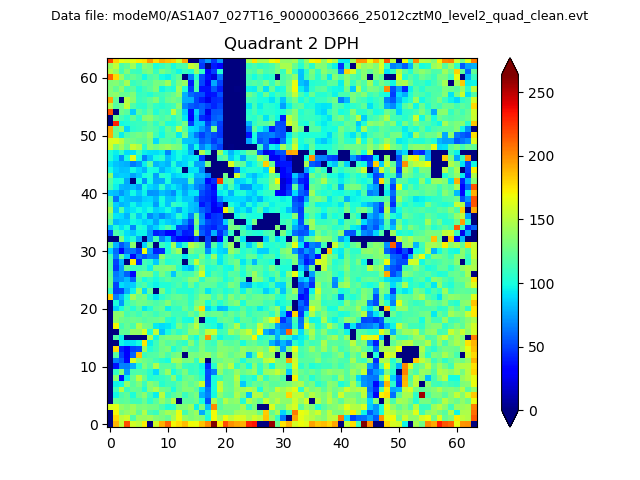 |
Quadrant C |
| Plot type | Count rate plots | Images |
|---|---|---|
| Comparison with Poisson distribution Blue bars denote a histogram of data divided into 1 sec bins. Red curve is a Poisson curve with rate = median count rate of data. |
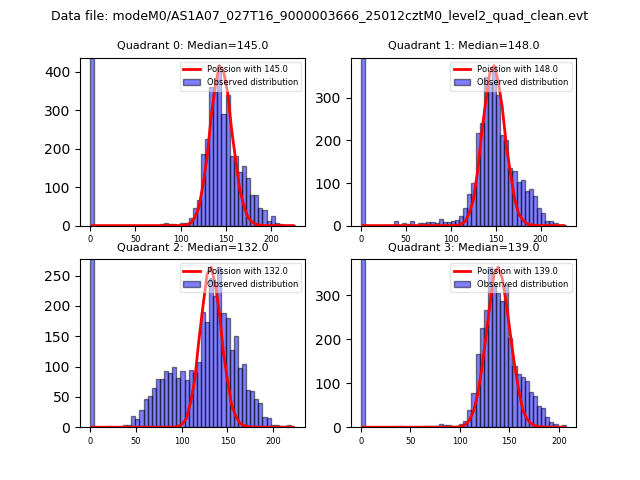 |
 |
| Quadrant-wise count rates Data is divided into 100 sec bins |
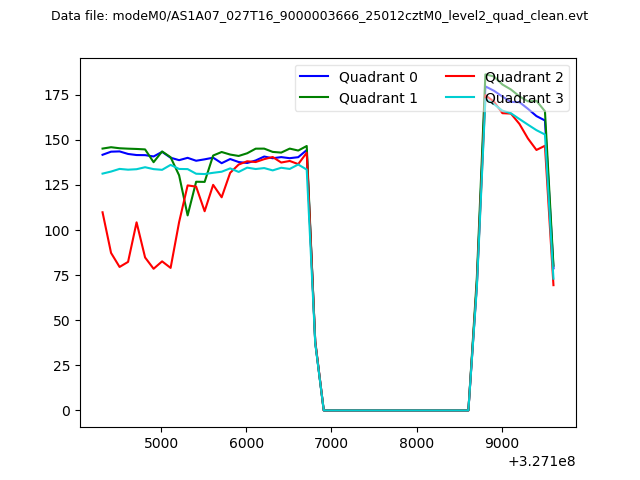 |
|
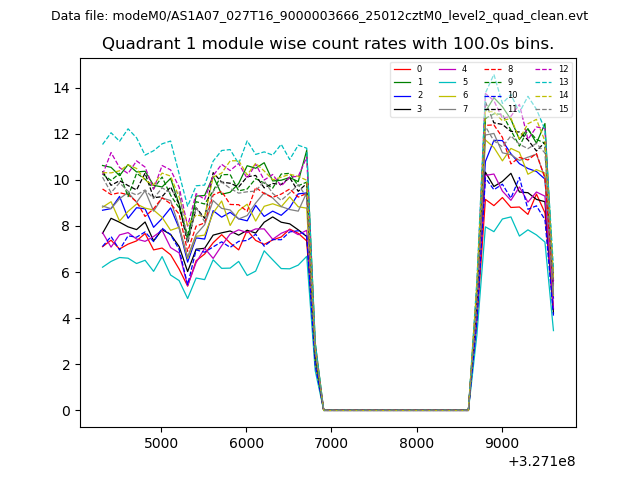
| Module-wise count rates for Quadrant A Data is divided into 100 sec bins |
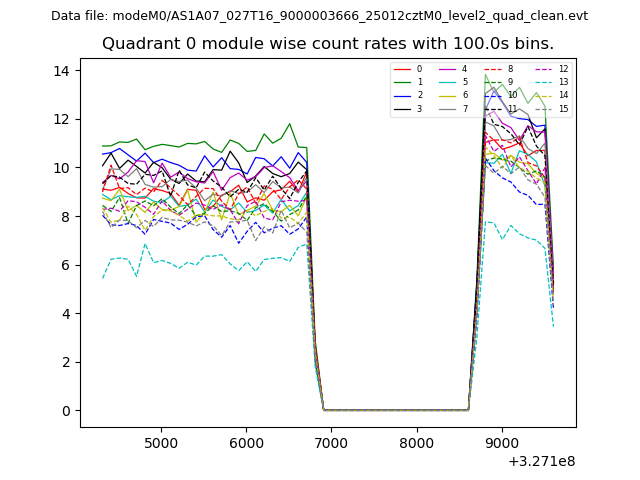 |
 |
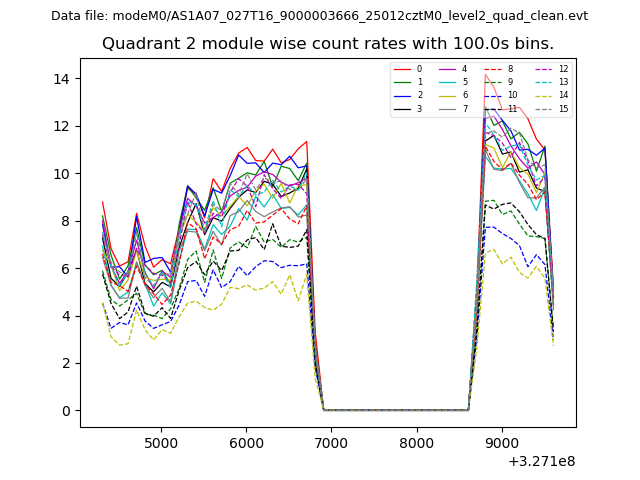
| Module-wise count rates for Quadrant B Data is divided into 100 sec bins |
 |
 |
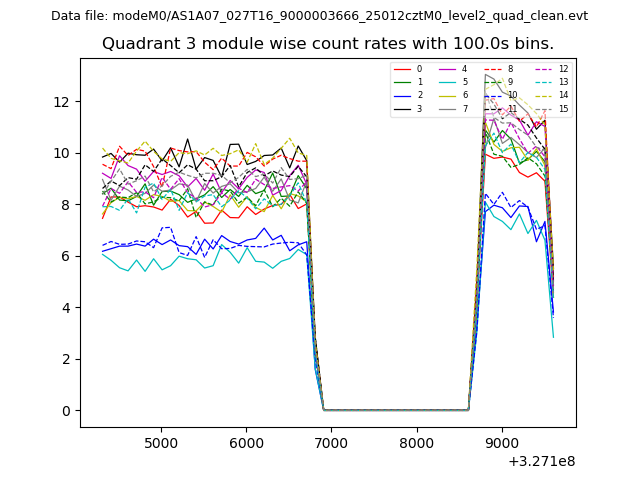
| Module-wise count rates for Quadrant C Data is divided into 100 sec bins |
 |
 |
| Module-wise count rates for Quadrant D Data is divided into 100 sec bins |
 |
 |
| Parameter | Plot |
|---|---|
| CZT HV Monitor | 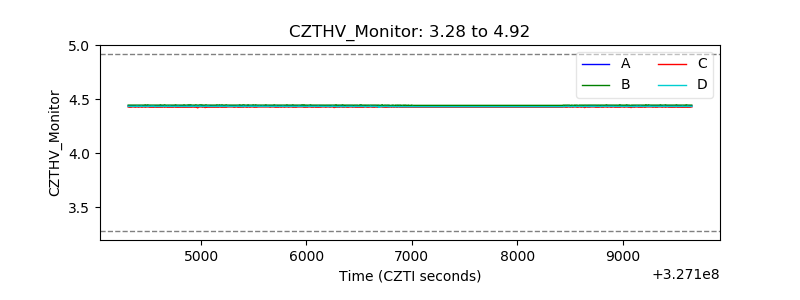 |
| D_VDD | 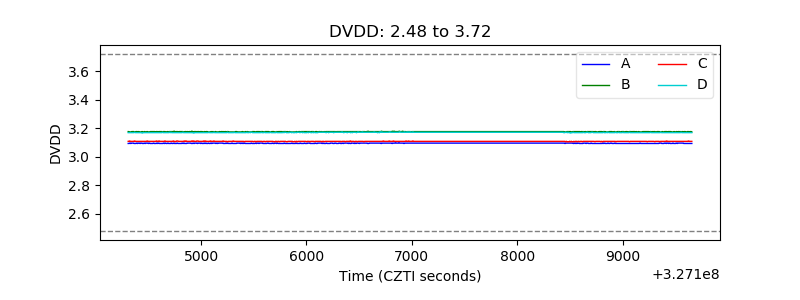 |
| Temperature 1 | 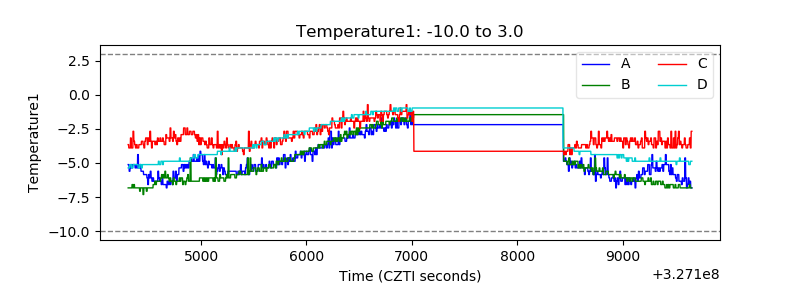 |
| Veto HV Monitor | 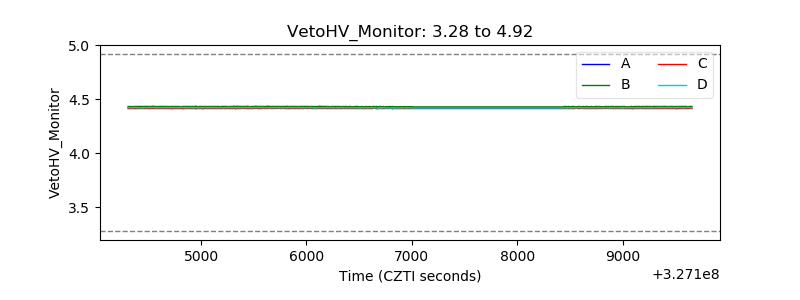 |
| Veto LLD | 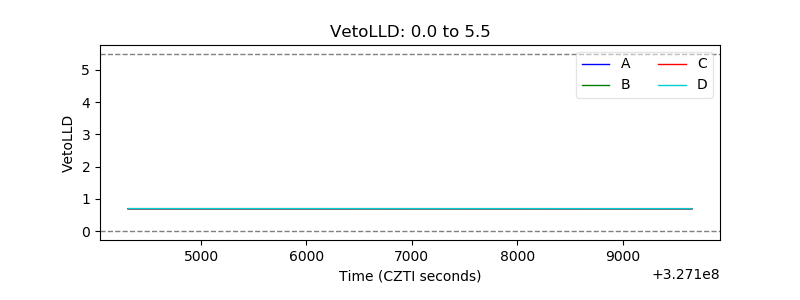 |
| Alpha Counter | 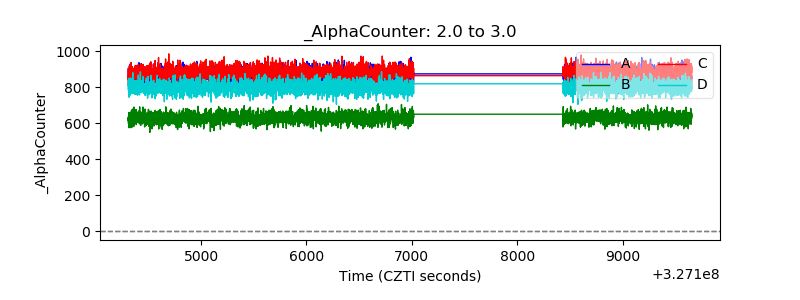 |
| _CPM_Rate | 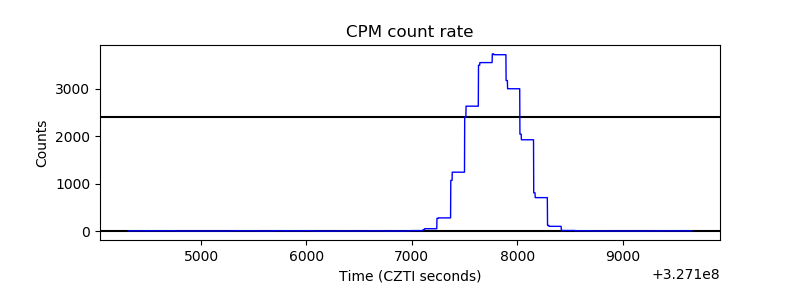 |
| CZT Counter | 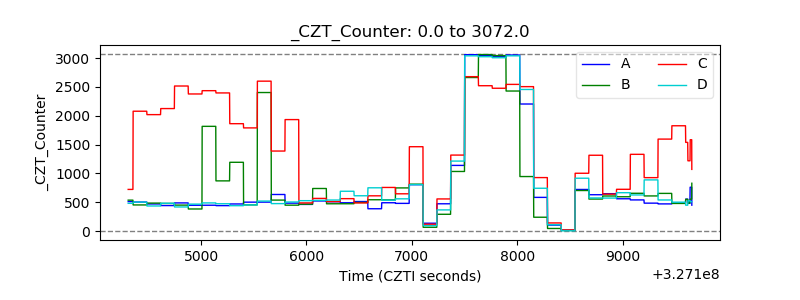 |
| +2.5 Volts monitor |  |
| +5 Volts monitor |  |
| _ROLL_ROT | 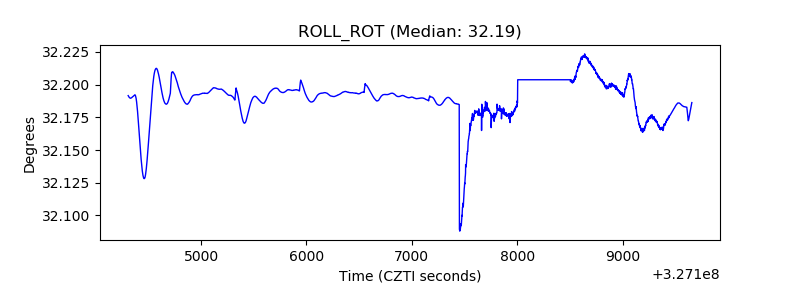 |
| _Roll_DEC |  |
| _Roll_RA | 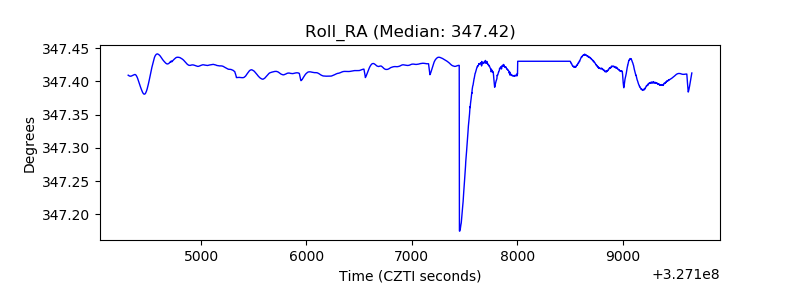 |
| Veto Counter | 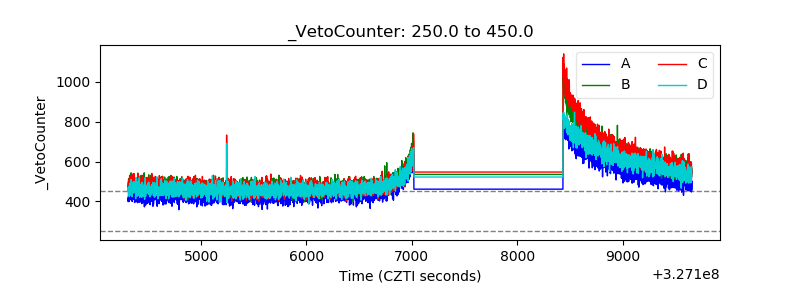 |