| Param | Original file | Final file |
|---|---|---|
| Filename | modeM0/AS1A07_027T16_9000003666_25015cztM0_level2.evt | modeM0/AS1A07_027T16_9000003666_25015cztM0_level2_quad_clean.evt |
| Size (bytes) | 665,239,680 | 99,388,800 |
| Size | 634.4 MB | 94.8 MB |
| Events in quadrant A | 3,244,380 | 662,340 |
| Events in quadrant B | 3,326,811 | 675,175 |
| Events in quadrant C | 9,882,299 | 562,767 |
| Events in quadrant D | 3,236,309 | 638,348 |
| Mode SS | |||
|---|---|---|---|
| Quadrant | BADHDUFLAG | Total packets | Discarded packets |
| A | 0 | 136 | 0 |
| B | 0 | 136 | 0 |
| C | 0 | 136 | 0 |
| D | 0 | 136 | 0 |
| Mode M9 | |||
|---|---|---|---|
| Quadrant | BADHDUFLAG | Total packets | Discarded packets |
| A | 0 | 15 | 0 |
| B | 0 | 16 | 0 |
| C | 0 | 16 | 0 |
| D | 0 | 16 | 0 |
| Mode M0 | |||
|---|---|---|---|
| Quadrant | BADHDUFLAG | Total packets | Discarded packets |
| A | 0 | 13895 | 2 |
| B | 0 | 14117 | 2 |
| C | 0 | 34172 | 9 |
| D | 0 | 13954 | 2 |
| Quadrant | Total seconds | Saturated seconds | Saturation percentage |
|---|---|---|---|
| A | 6752 | 23 | 0.340640% |
| B | 6752 | 46 | 0.681280% |
| C | 6751 | 2401 | 35.565101% |
| D | 6751 | 37 | 0.548067% |
Noise dominated data is calculated using 1-second bins in cleaned event files. If a bin has >2000 counts, and if more than 50% of those come from <1% of pixels, then it is considered to be noise-dominated and hence unusable.
| Quadrant | # 1 sec bins | Bins with >0 counts | Bins with >2000 counts | High rate bins dominated by noise | Noise dominated (total time) | Noise dominated (detector-on time) | Marked lightcurve |
|---|---|---|---|---|---|---|---|
| A | 7617 | 6753 | 0 | 0 | 0.00% | 0.00% | 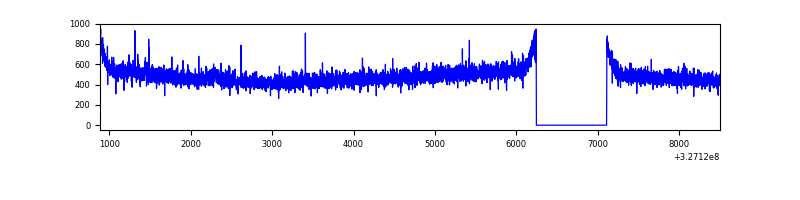 |
| B | 7617 | 6753 | 0 | 0 | 0.00% | 0.00% | 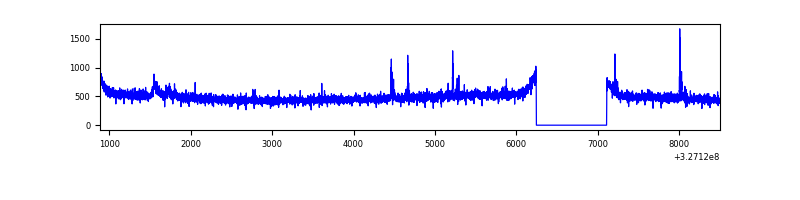 |
| C | 7616 | 6752 | 1703 | 1703 | 22.36% | 25.22% | 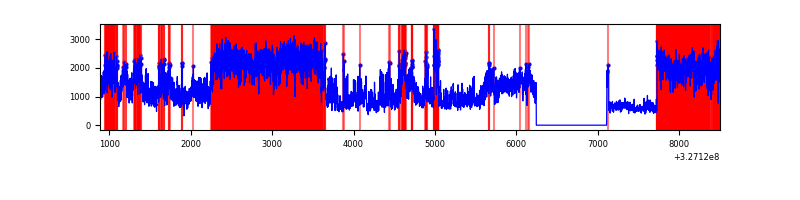 |
| D | 7616 | 6752 | 5 | 5 | 0.07% | 0.07% | 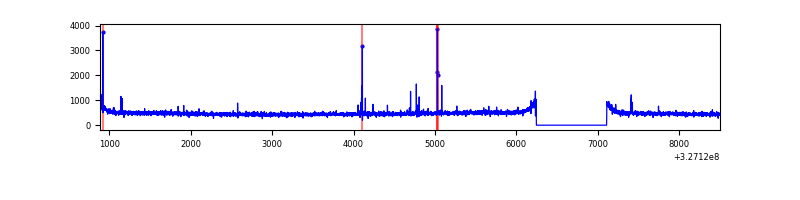 |
Top three noisy pixels from each quadrant. If the there are fewer than three noisy pixels in the level2.evt file, extra rows are filled as -1
| Pixel properties | Quadrant properties | ||||||
|---|---|---|---|---|---|---|---|
| Quadrant | DetID | PixID | Counts | Sigma | Mean | Median | Sigma |
| A | 6 | 16 | 14082 | 79.15 | 838 | 822 | 167.5 |
| A | 13 | 254 | 8890 | 48.16 | 838 | 822 | 167.5 |
| A | 3 | 137 | 7408 | 39.31 | 838 | 822 | 167.5 |
| B | 3 | 209 | 25735 | 155.22 | 835 | 811 | 160.6 |
| B | 12 | 111 | 19046 | 113.56 | 835 | 811 | 160.6 |
| B | 11 | 111 | 17267 | 102.48 | 835 | 811 | 160.6 |
| C | 7 | 247 | 6755077 | 38128.37 | 759 | 765 | 177.1 |
| C | 14 | 238 | 118126 | 662.51 | 759 | 765 | 177.1 |
| C | 2 | 16 | 28037 | 153.95 | 759 | 765 | 177.1 |
| D | 8 | 195 | 47456 | 233.09 | 831 | 808 | 200.1 |
| D | 2 | 234 | 25433 | 123.05 | 831 | 808 | 200.1 |
| D | 2 | 153 | 23909 | 115.43 | 831 | 808 | 200.1 |
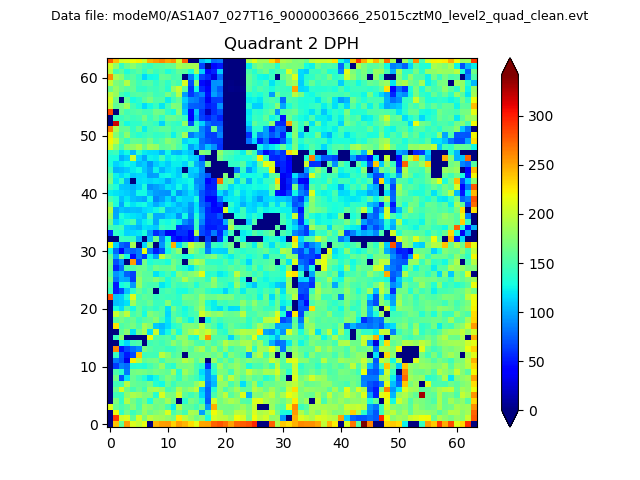
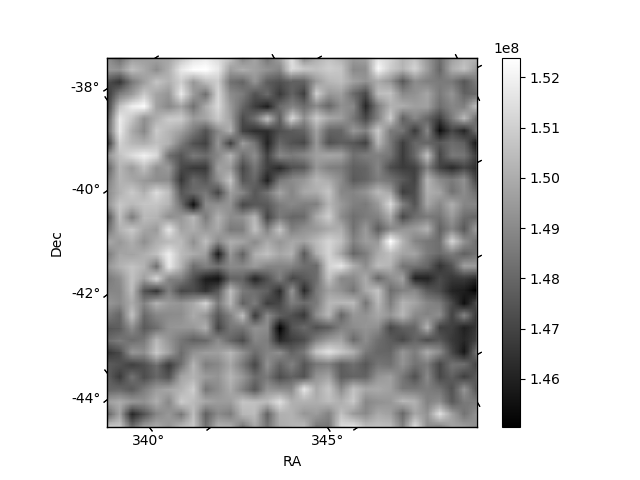
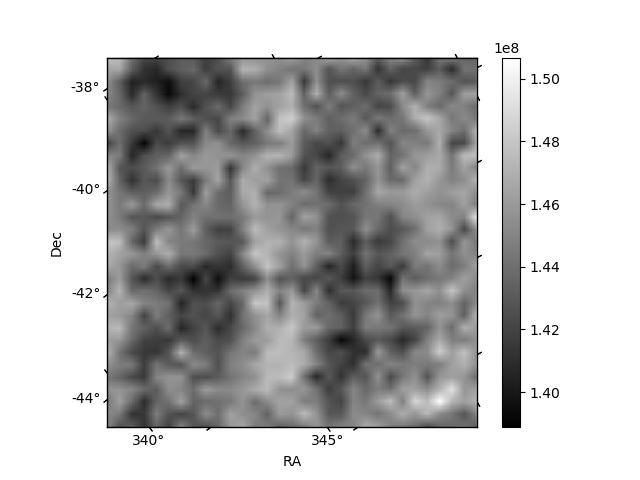
Histogram calculated using DETX and DETY for each event in the final _common_clean file
| Quadrant A | 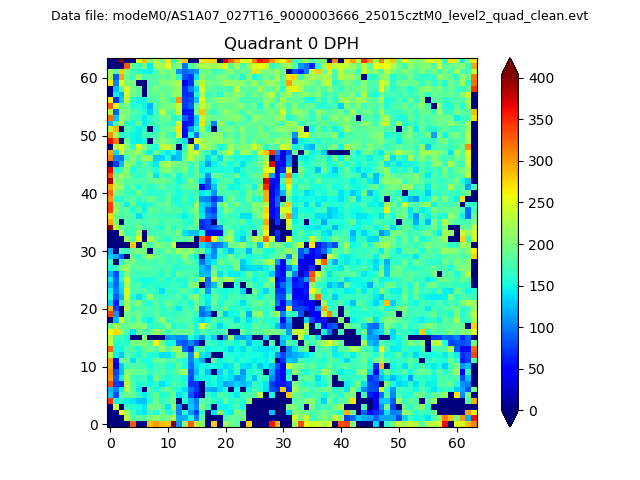 |
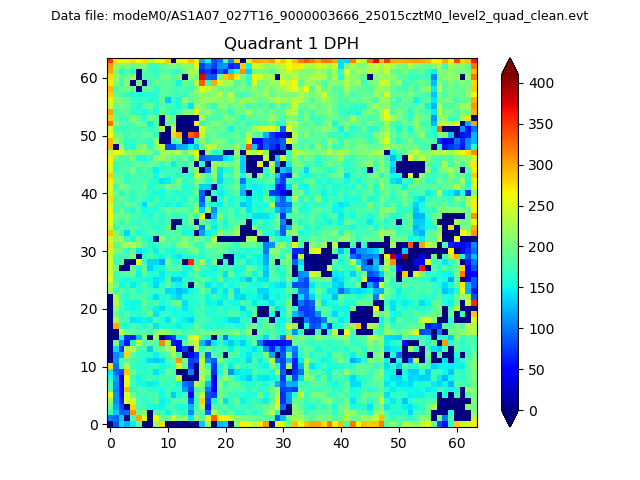 |
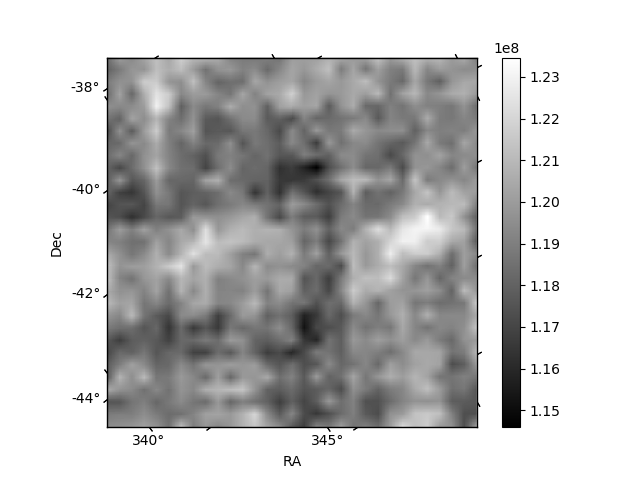
Quadrant B |
|---|---|---|---|
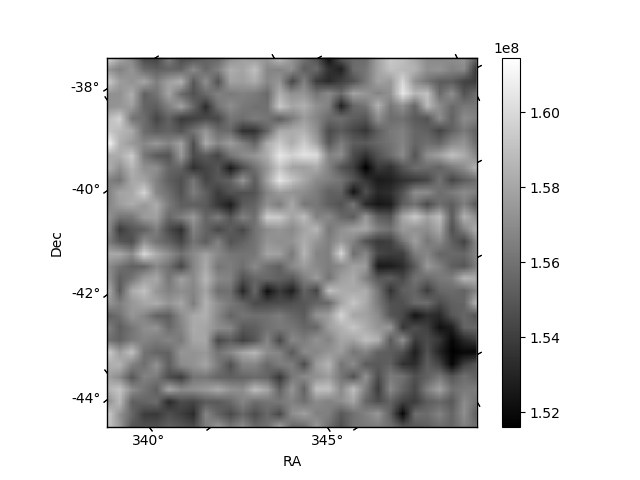
| Quadrant D | 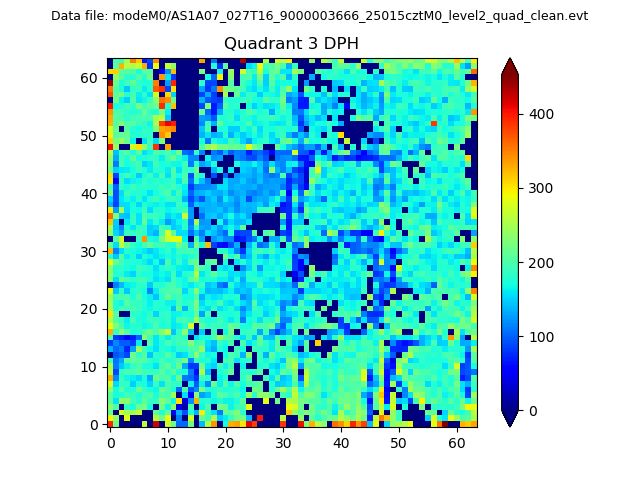 |
 |
Quadrant C |
| Plot type | Count rate plots | Images |
|---|---|---|
| Comparison with Poisson distribution Blue bars denote a histogram of data divided into 1 sec bins. Red curve is a Poisson curve with rate = median count rate of data. |
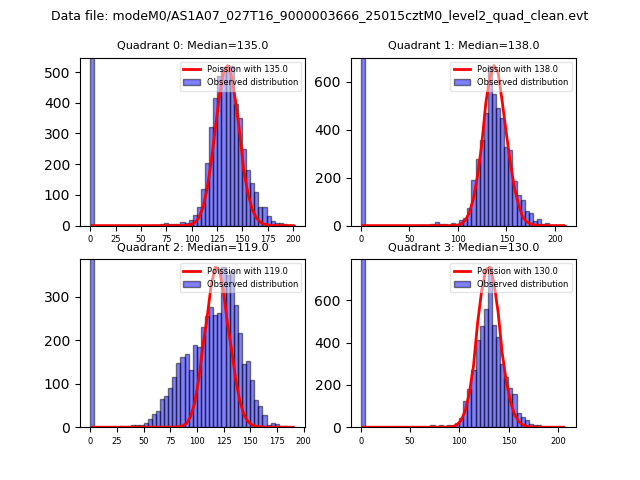 |
 |
| Quadrant-wise count rates Data is divided into 100 sec bins |
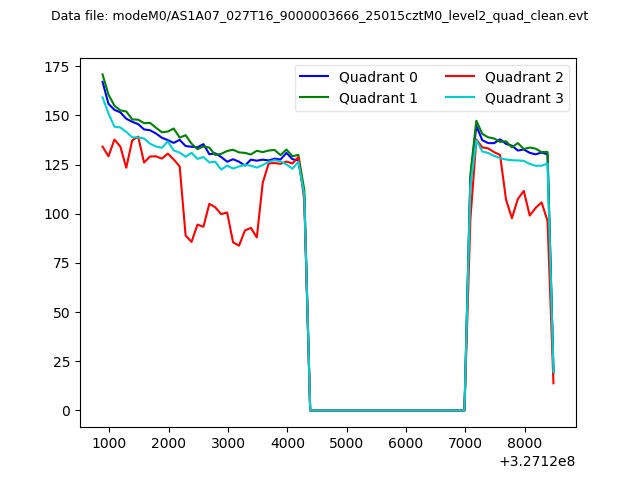 |
|
| Module-wise count rates for Quadrant A Data is divided into 100 sec bins |
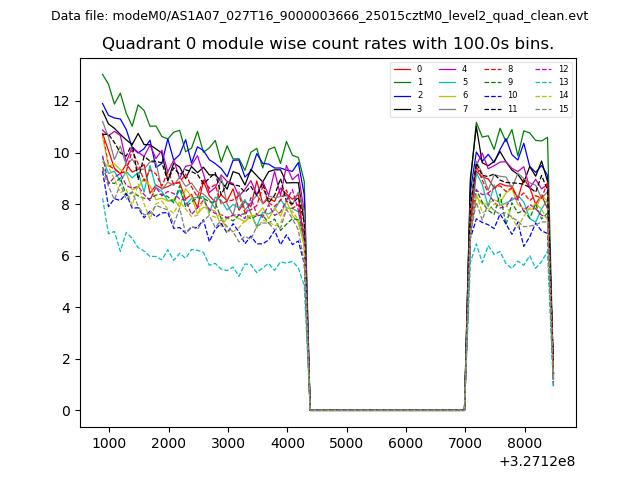 |
 |
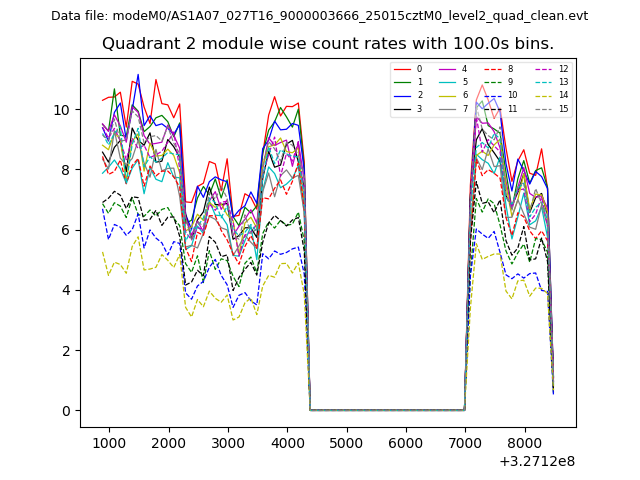
| Module-wise count rates for Quadrant B Data is divided into 100 sec bins |
 |
 |
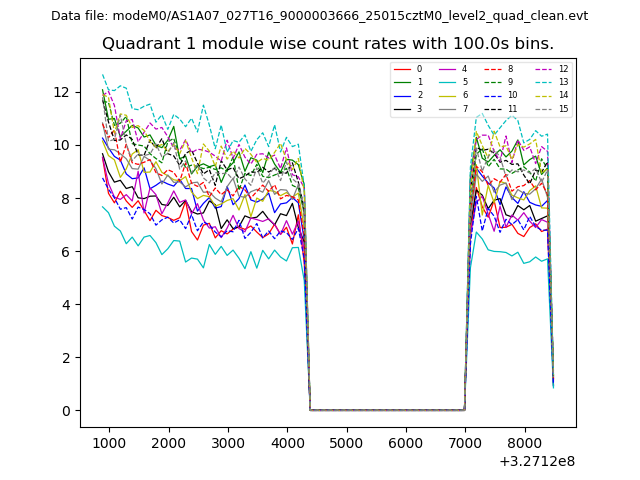
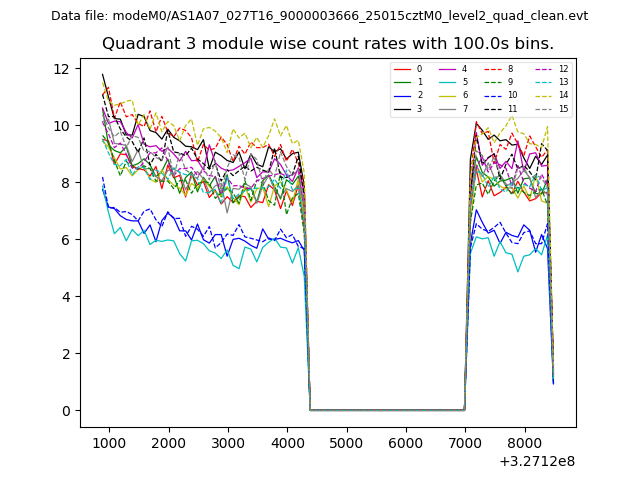
| Module-wise count rates for Quadrant C Data is divided into 100 sec bins |
 |
 |
| Module-wise count rates for Quadrant D Data is divided into 100 sec bins |
 |
 |
| Parameter | Plot |
|---|---|
| CZT HV Monitor | 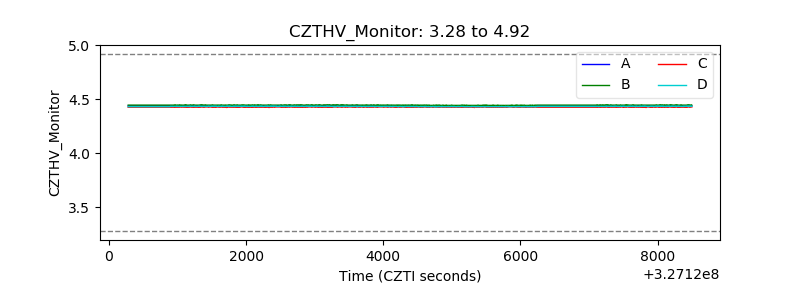 |
| D_VDD | 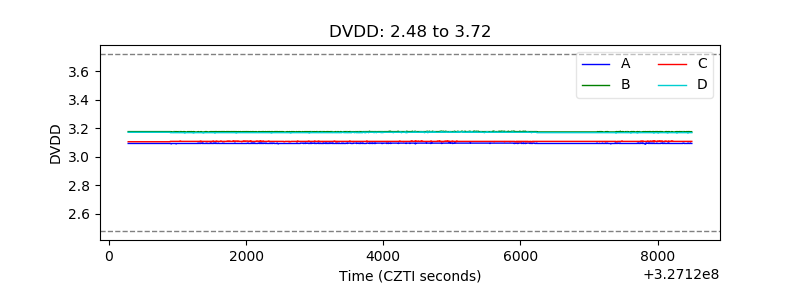 |
| Temperature 1 | 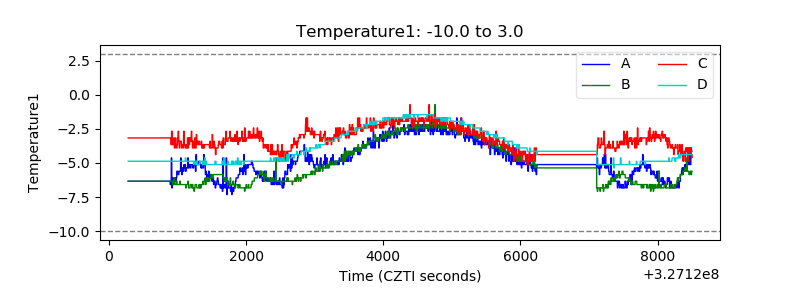 |
| Veto HV Monitor | 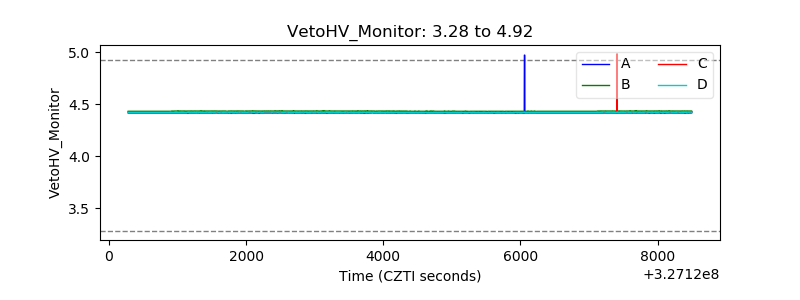 |
| Veto LLD | 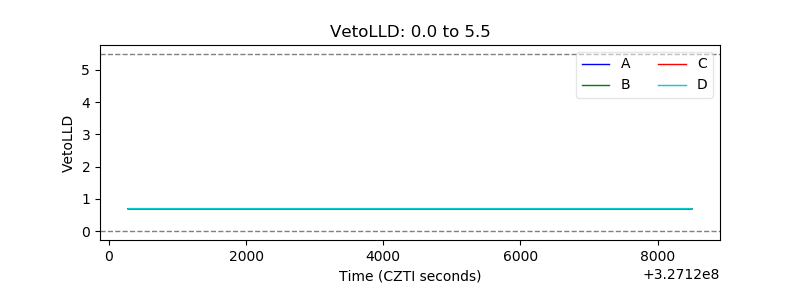 |
| Alpha Counter | 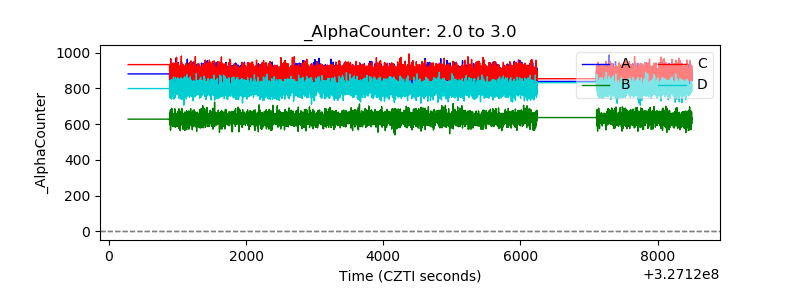 |
| _CPM_Rate |  |
| CZT Counter |  |
| +2.5 Volts monitor |  |
| +5 Volts monitor |  |
| _ROLL_ROT | 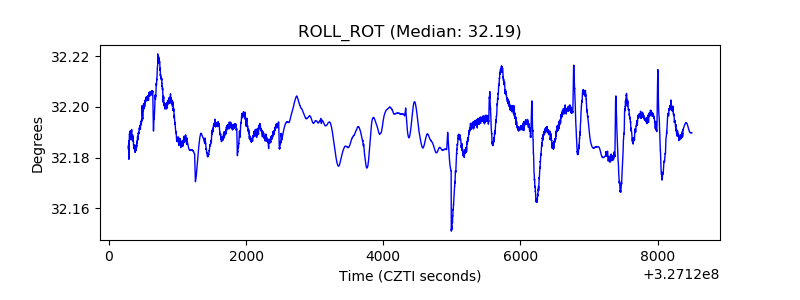 |
| _Roll_DEC | 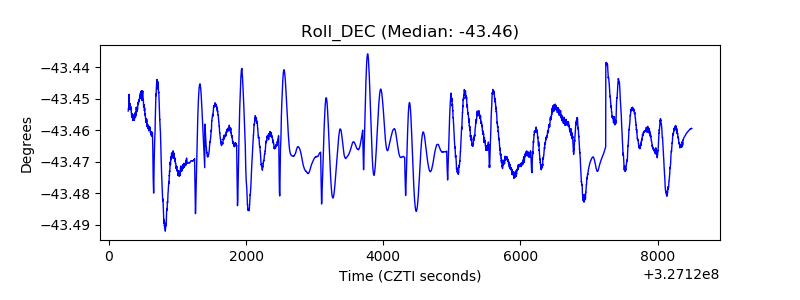 |
| _Roll_RA |  |
| Veto Counter | 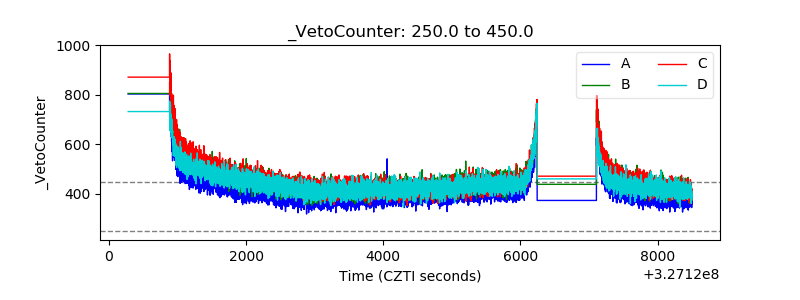 |