| Param | Original file | Final file |
|---|---|---|
| Filename | modeM0/AS1A07_027T16_9000003666_25020cztM0_level2.evt | modeM0/AS1A07_027T16_9000003666_25020cztM0_level2_quad_clean.evt |
| Size (bytes) | 941,785,920 | 156,798,720 |
| Size | 898.2 MB | 149.5 MB |
| Events in quadrant A | 5,703,543 | 994,482 |
| Events in quadrant B | 5,778,944 | 1,011,608 |
| Events in quadrant C | 7,890,732 | 937,741 |
| Events in quadrant D | 8,316,154 | 953,508 |
| Mode SS | |||
|---|---|---|---|
| Quadrant | BADHDUFLAG | Total packets | Discarded packets |
| A | 0 | 250 | 0 |
| B | 0 | 250 | 0 |
| C | 0 | 250 | 0 |
| D | 0 | 250 | 0 |
| Mode M9 | |||
|---|---|---|---|
| Quadrant | BADHDUFLAG | Total packets | Discarded packets |
| A | 0 | 12 | 0 |
| B | 0 | 12 | 0 |
| C | 0 | 12 | 0 |
| D | 0 | 12 | 0 |
| Mode M0 | |||
|---|---|---|---|
| Quadrant | BADHDUFLAG | Total packets | Discarded packets |
| A | 0 | 24997 | 2 |
| B | 0 | 25137 | 2 |
| C | 0 | 30993 | 2 |
| D | 0 | 32630 | 2 |
| Quadrant | Total seconds | Saturated seconds | Saturation percentage |
|---|---|---|---|
| A | 12315 | 69 | 0.560292% |
| B | 12316 | 94 | 0.763235% |
| C | 12316 | 565 | 4.587528% |
| D | 12316 | 309 | 2.508931% |
Noise dominated data is calculated using 1-second bins in cleaned event files. If a bin has >2000 counts, and if more than 50% of those come from <1% of pixels, then it is considered to be noise-dominated and hence unusable.
| Quadrant | # 1 sec bins | Bins with >0 counts | Bins with >2000 counts | High rate bins dominated by noise | Noise dominated (total time) | Noise dominated (detector-on time) | Marked lightcurve |
|---|---|---|---|---|---|---|---|
| A | 13520 | 12317 | 1 | 1 | 0.01% | 0.01% | 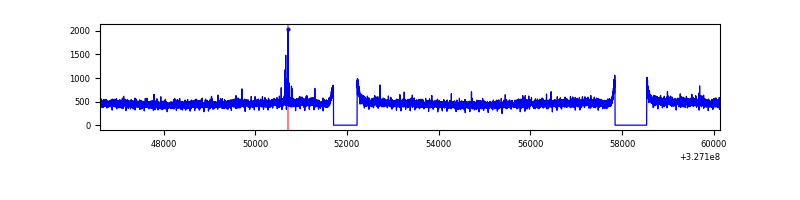 |
| B | 13521 | 12318 | 1 | 1 | 0.01% | 0.01% | 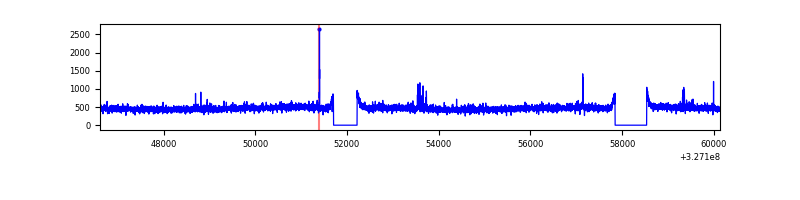 |
| C | 13521 | 12318 | 265 | 265 | 1.96% | 2.15% | 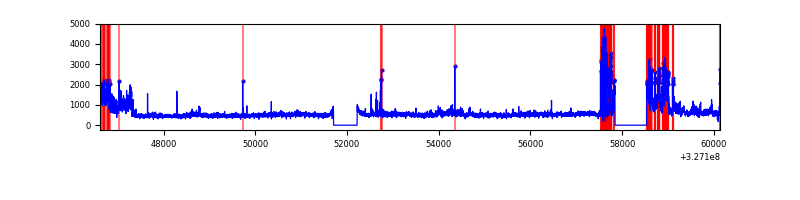 |
| D | 13521 | 12318 | 240 | 240 | 1.78% | 1.95% | 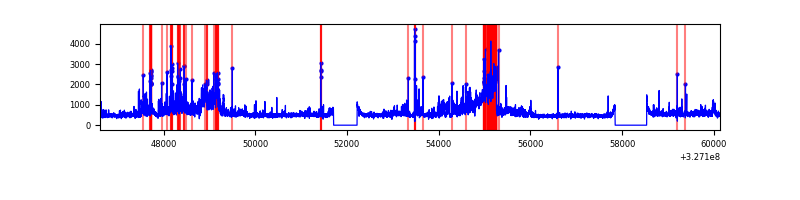 |
Top three noisy pixels from each quadrant. If the there are fewer than three noisy pixels in the level2.evt file, extra rows are filled as -1
| Pixel properties | Quadrant properties | ||||||
|---|---|---|---|---|---|---|---|
| Quadrant | DetID | PixID | Counts | Sigma | Mean | Median | Sigma |
| A | 6 | 16 | 31097 | 100.13 | 1471 | 1436 | 296.2 |
| A | 13 | 254 | 15416 | 47.19 | 1471 | 1436 | 296.2 |
| A | 3 | 137 | 13619 | 41.13 | 1471 | 1436 | 296.2 |
| B | 0 | 190 | 44471 | 153.4 | 1457 | 1420 | 280.7 |
| B | 12 | 111 | 34703 | 118.59 | 1457 | 1420 | 280.7 |
| B | 11 | 111 | 31323 | 106.55 | 1457 | 1420 | 280.7 |
| C | 7 | 247 | 2177743 | 6709.7 | 1388 | 1394 | 324.4 |
| C | 14 | 238 | 217983 | 667.75 | 1388 | 1394 | 324.4 |
| C | 2 | 16 | 38301 | 113.78 | 1388 | 1394 | 324.4 |
| D | 7 | 238 | 2285401 | 6619.32 | 1429 | 1388 | 345.1 |
| D | 1 | 52 | 307581 | 887.38 | 1429 | 1388 | 345.1 |
| D | 8 | 195 | 255165 | 735.47 | 1429 | 1388 | 345.1 |
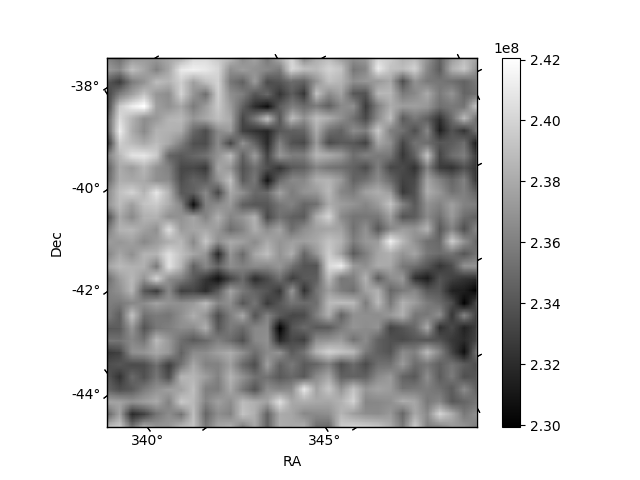
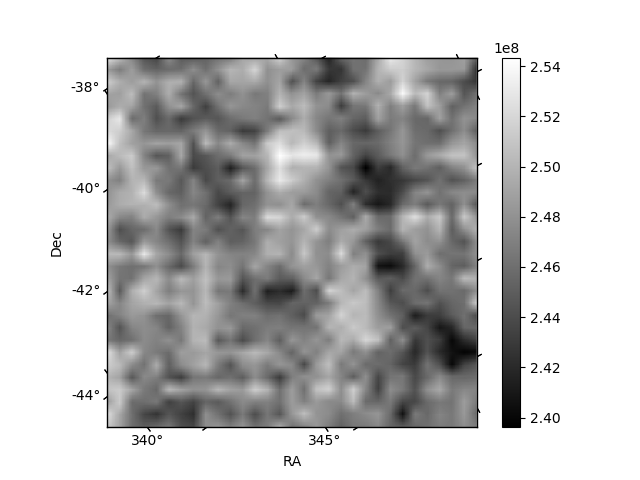
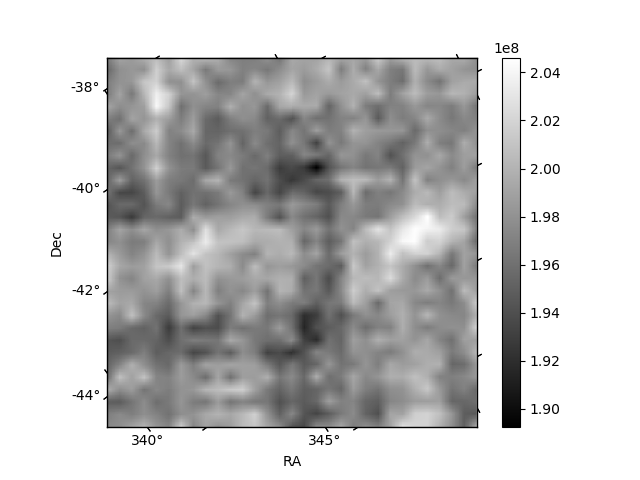
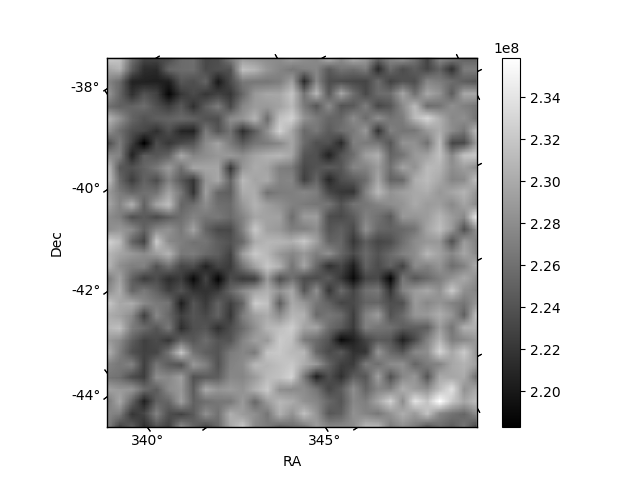
Histogram calculated using DETX and DETY for each event in the final _common_clean file
| Quadrant A | 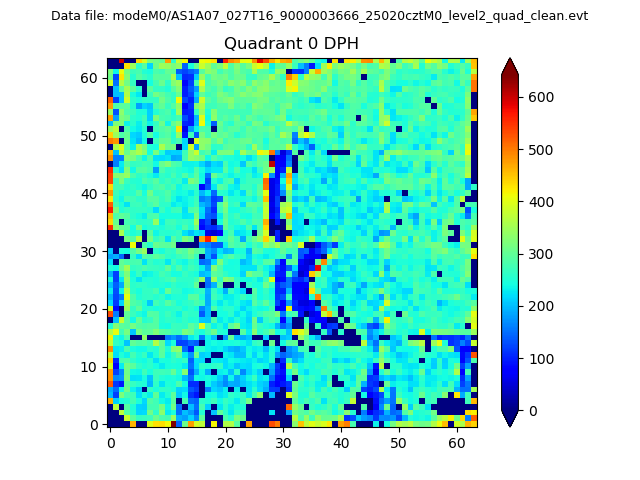 |
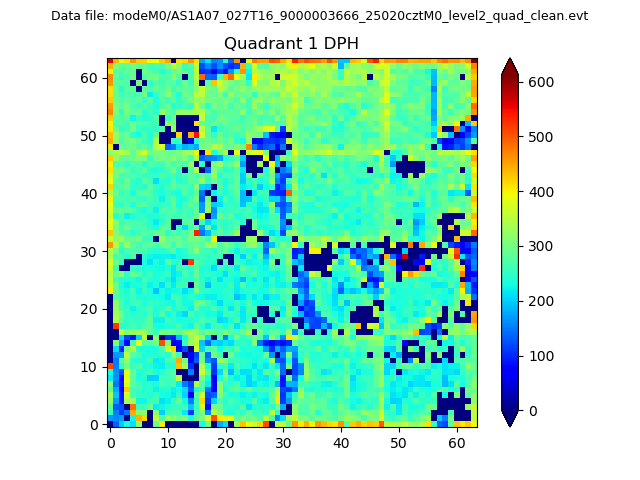 |
Quadrant B |
|---|---|---|---|
| Quadrant D | 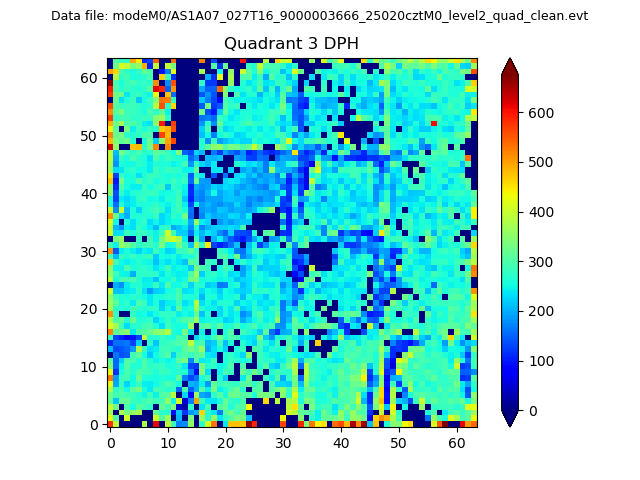 |
 |
Quadrant C |
| Plot type | Count rate plots | Images |
|---|---|---|
| Comparison with Poisson distribution Blue bars denote a histogram of data divided into 1 sec bins. Red curve is a Poisson curve with rate = median count rate of data. |
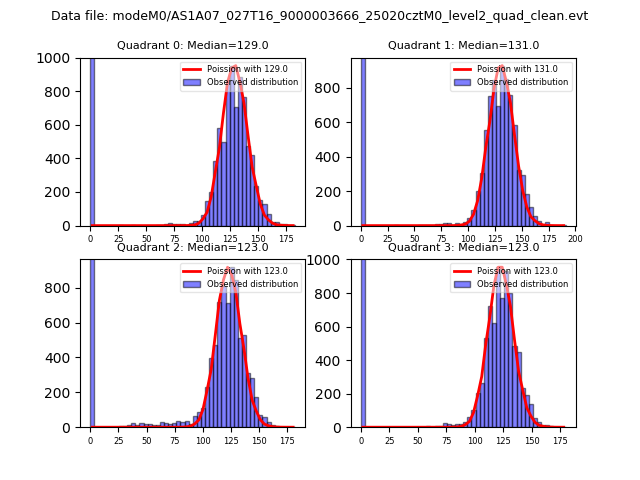 |
 |
| Quadrant-wise count rates Data is divided into 100 sec bins |
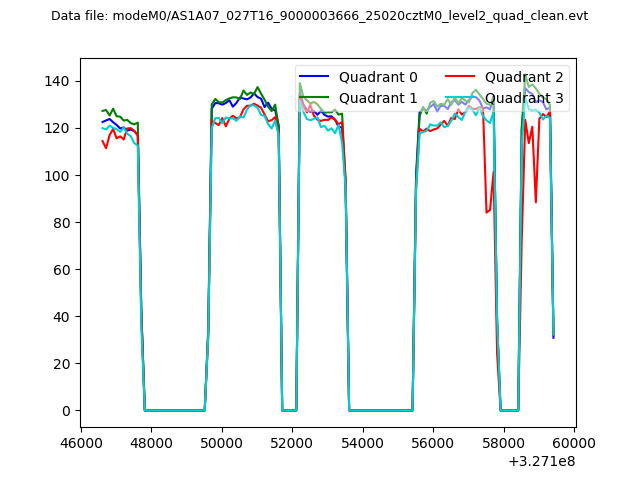 |
|
| Module-wise count rates for Quadrant A Data is divided into 100 sec bins |
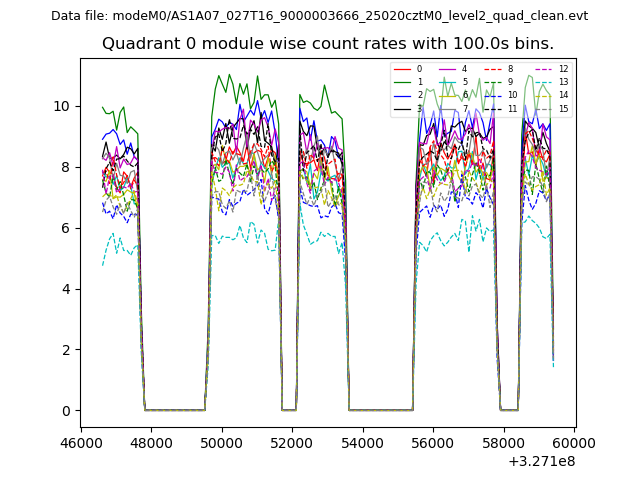 |
 |
| Module-wise count rates for Quadrant B Data is divided into 100 sec bins |
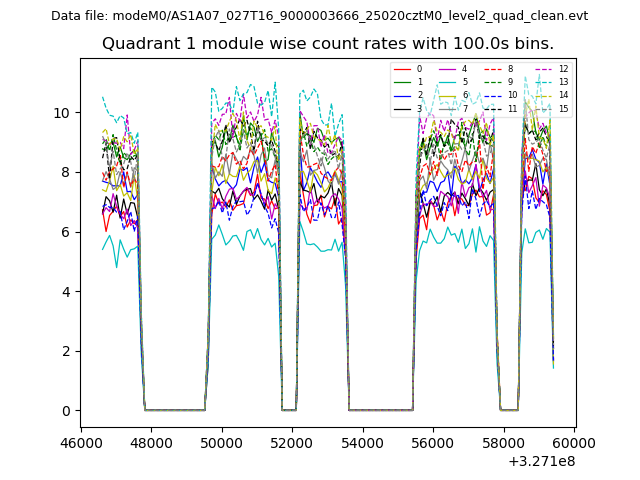 |
 |
| Module-wise count rates for Quadrant C Data is divided into 100 sec bins |
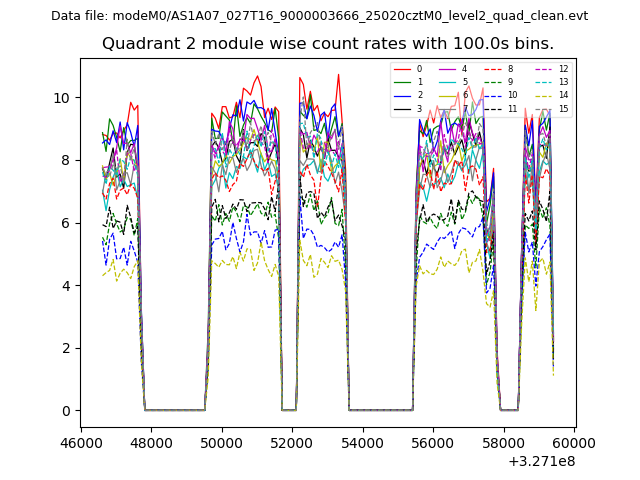 |
 |
| Module-wise count rates for Quadrant D Data is divided into 100 sec bins |
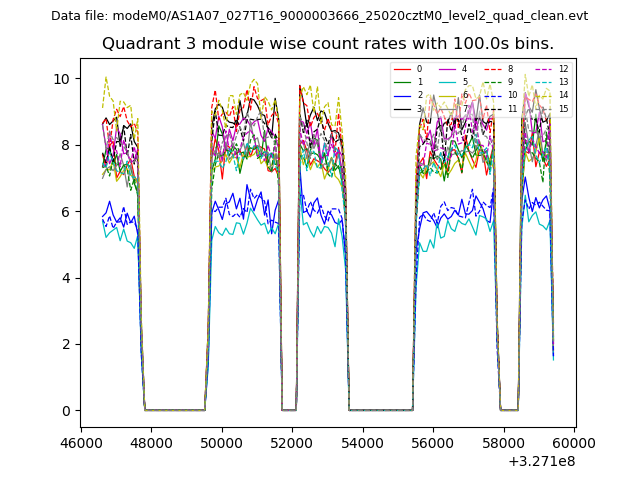 |
 |
| Parameter | Plot |
|---|---|
| CZT HV Monitor | 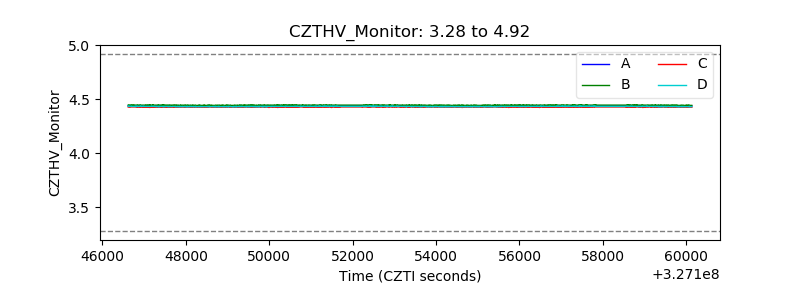 |
| D_VDD | 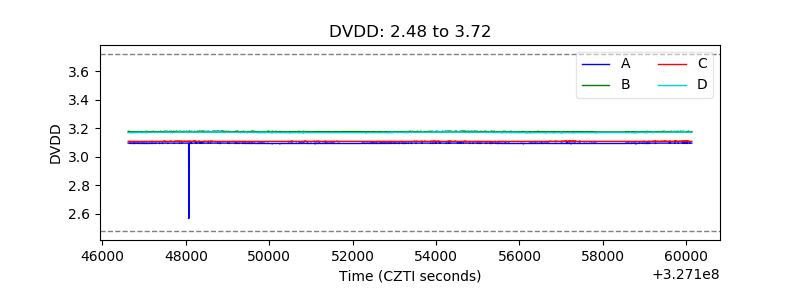 |
| Temperature 1 |  |
| Veto HV Monitor | 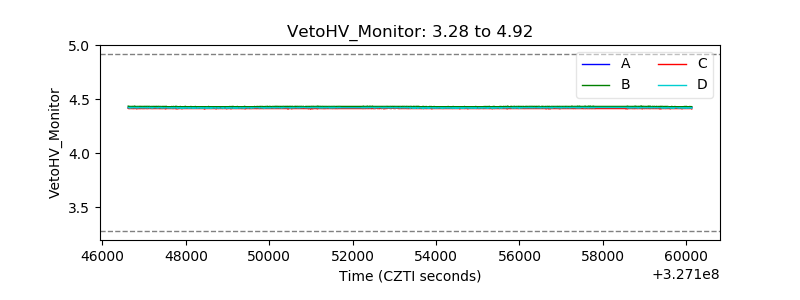 |
| Veto LLD | 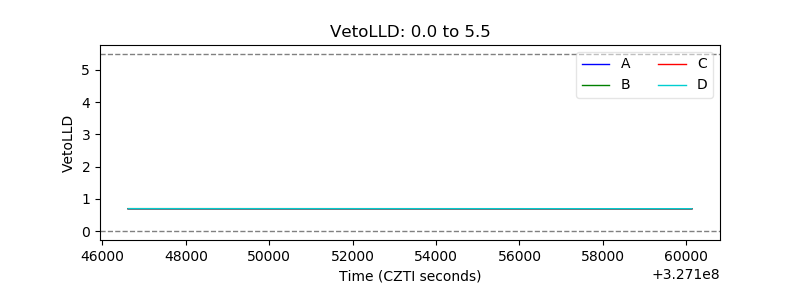 |
| Alpha Counter | 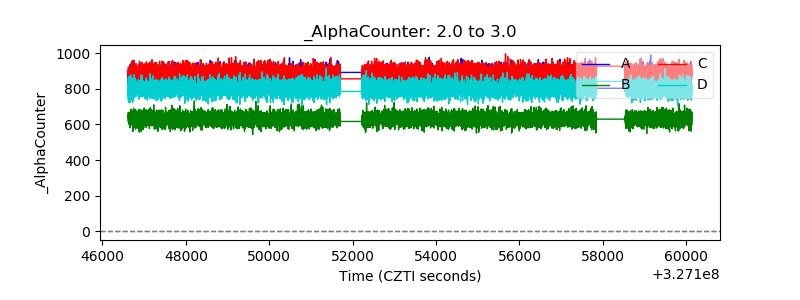 |
| _CPM_Rate | 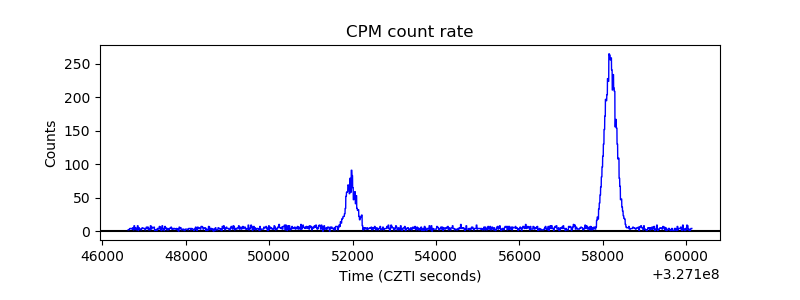 |
| CZT Counter | 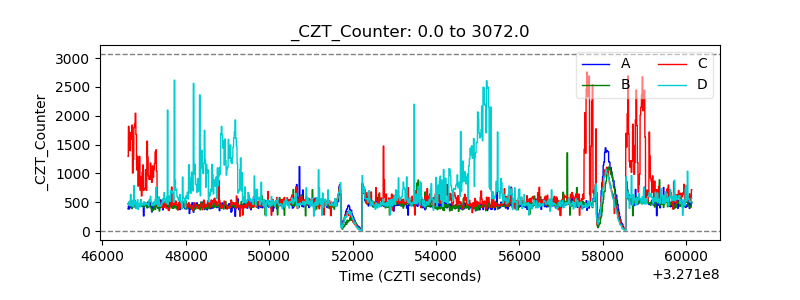 |
| +2.5 Volts monitor |  |
| +5 Volts monitor |  |
| _ROLL_ROT | 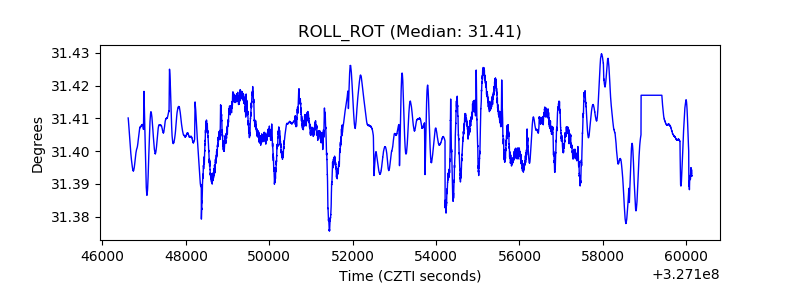 |
| _Roll_DEC | 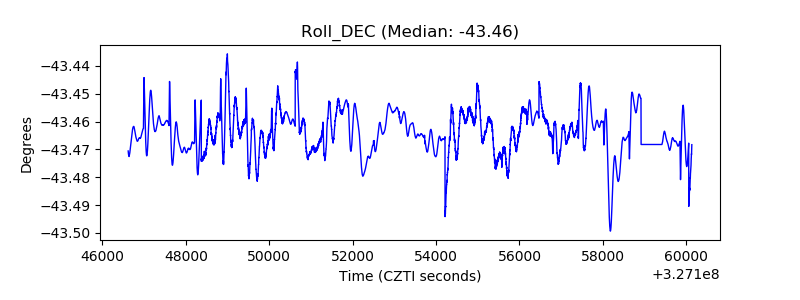 |
| _Roll_RA |  |
| Veto Counter | 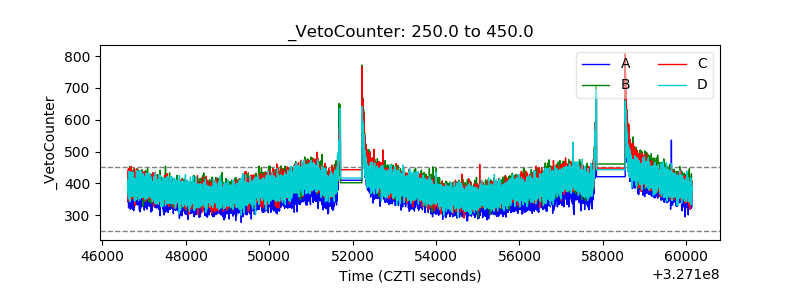 |