| Param | Original file | Final file |
|---|---|---|
| Filename | modeM0/AS1A07_027T16_9000003666_25022cztM0_level2.evt | modeM0/AS1A07_027T16_9000003666_25022cztM0_level2_quad_clean.evt |
| Size (bytes) | 200,761,920 | 19,042,560 |
| Size | 191.5 MB | 18.2 MB |
| Events in quadrant A | 1,247,226 | 99,990 |
| Events in quadrant B | 1,305,634 | 100,780 |
| Events in quadrant C | 1,545,737 | 90,816 |
| Events in quadrant D | 1,795,537 | 90,566 |
| Mode SS | |||
|---|---|---|---|
| Quadrant | BADHDUFLAG | Total packets | Discarded packets |
| A | 0 | 54 | 0 |
| B | 0 | 54 | 0 |
| C | 0 | 54 | 0 |
| D | 0 | 54 | 0 |
| Mode M0 | |||
|---|---|---|---|
| Quadrant | BADHDUFLAG | Total packets | Discarded packets |
| A | 0 | 5465 | 0 |
| B | 0 | 5606 | 0 |
| C | 0 | 6407 | 0 |
| D | 0 | 7127 | 0 |
| Quadrant | Total seconds | Saturated seconds | Saturation percentage |
|---|---|---|---|
| A | 2706 | 4 | 0.147820% |
| B | 2706 | 3 | 0.110865% |
| C | 2707 | 64 | 2.364241% |
| D | 2707 | 83 | 3.066125% |
Noise dominated data is calculated using 1-second bins in cleaned event files. If a bin has >2000 counts, and if more than 50% of those come from <1% of pixels, then it is considered to be noise-dominated and hence unusable.
| Quadrant | # 1 sec bins | Bins with >0 counts | Bins with >2000 counts | High rate bins dominated by noise | Noise dominated (total time) | Noise dominated (detector-on time) | Marked lightcurve |
|---|---|---|---|---|---|---|---|
| A | 2706 | 2706 | 0 | 0 | 0.00% | 0.00% | 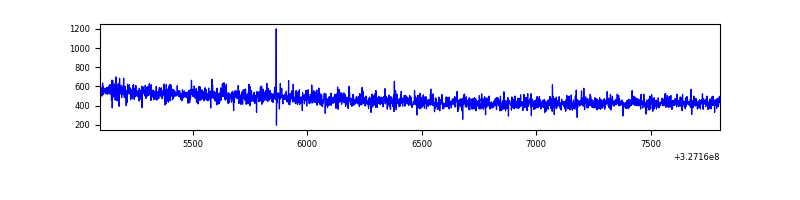 |
| B | 2706 | 2706 | 0 | 0 | 0.00% | 0.00% | 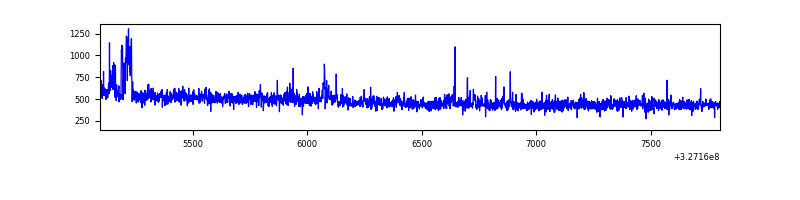 |
| C | 2706 | 2706 | 32 | 32 | 1.18% | 1.18% | 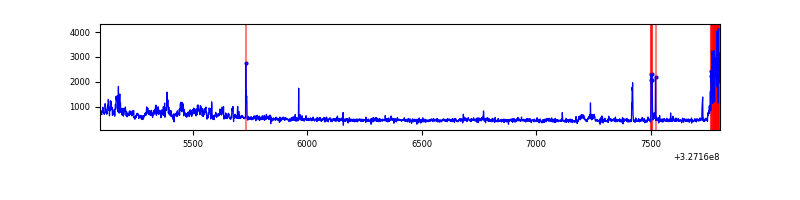 |
| D | 2707 | 2707 | 77 | 77 | 2.84% | 2.84% | 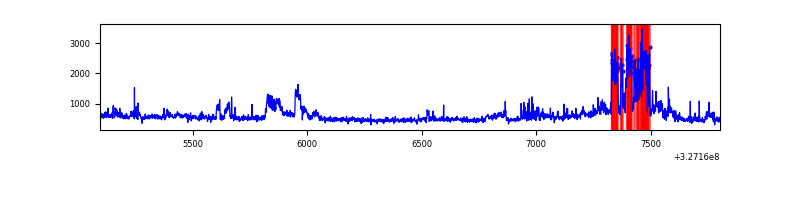 |
Top three noisy pixels from each quadrant. If the there are fewer than three noisy pixels in the level2.evt file, extra rows are filled as -1
| Pixel properties | Quadrant properties | ||||||
|---|---|---|---|---|---|---|---|
| Quadrant | DetID | PixID | Counts | Sigma | Mean | Median | Sigma |
| A | 13 | 254 | 4156 | 58.07 | 323 | 317 | 66.1 |
| A | 3 | 137 | 2941 | 39.69 | 323 | 317 | 66.1 |
| A | 0 | 226 | 2763 | 37.0 | 323 | 317 | 66.1 |
| B | 0 | 190 | 30072 | 481.17 | 319 | 311 | 61.9 |
| B | 0 | 229 | 8622 | 134.37 | 319 | 311 | 61.9 |
| B | 0 | 245 | 8398 | 130.75 | 319 | 311 | 61.9 |
| C | 7 | 247 | 314045 | 4429.85 | 298 | 300 | 70.8 |
| C | 14 | 238 | 49021 | 687.9 | 298 | 300 | 70.8 |
| C | 3 | 233 | 13505 | 186.44 | 298 | 300 | 70.8 |
| D | 7 | 238 | 263045 | 3460.73 | 307 | 298 | 75.9 |
| D | 10 | 70 | 227305 | 2989.99 | 307 | 298 | 75.9 |
| D | 8 | 195 | 127265 | 1672.33 | 307 | 298 | 75.9 |
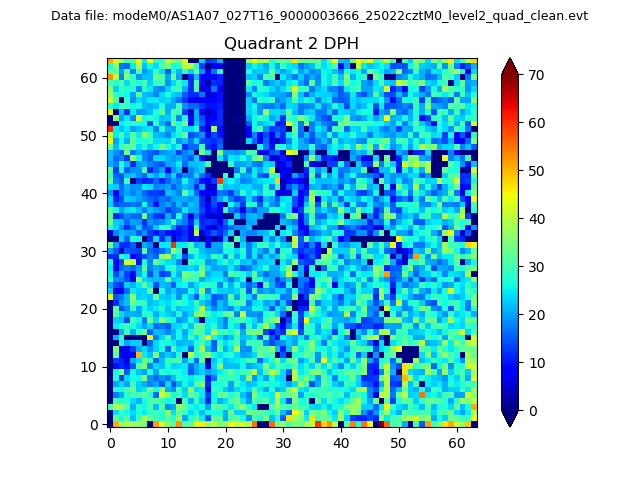
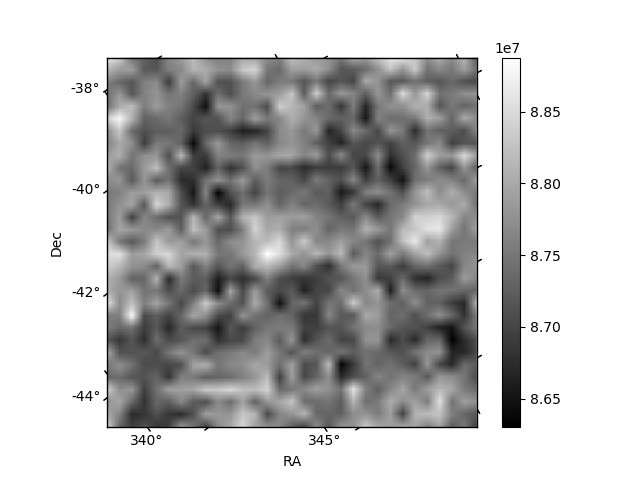
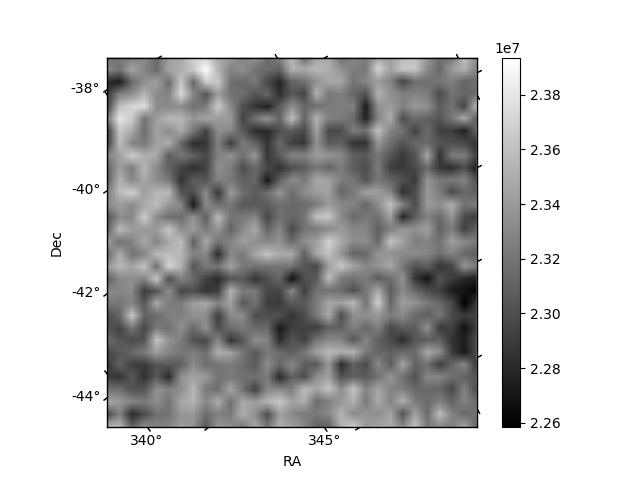
Histogram calculated using DETX and DETY for each event in the final _common_clean file
| Quadrant A | 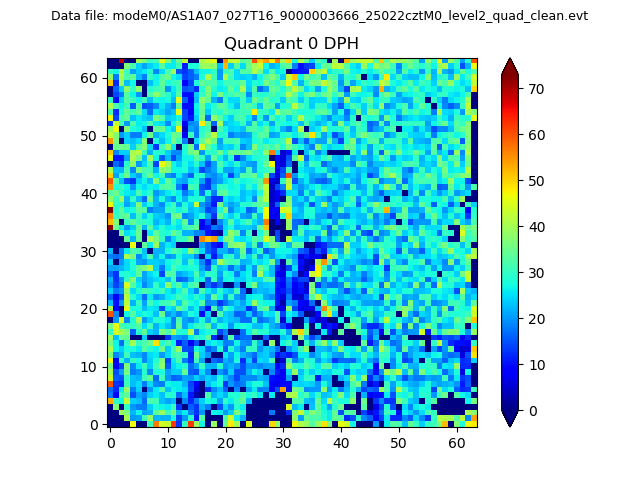 |
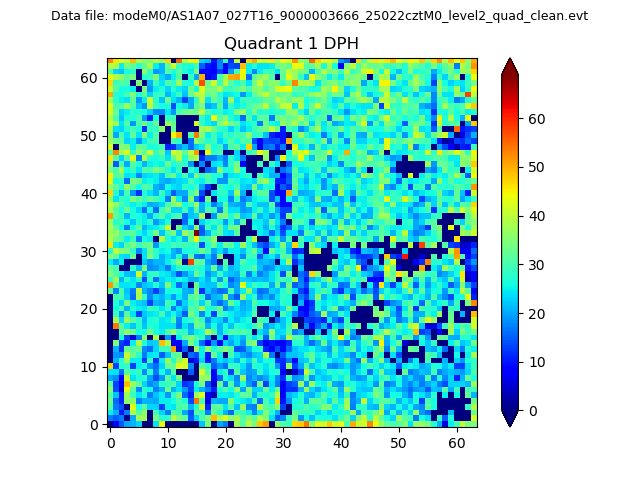 |
Quadrant B |
|---|---|---|---|
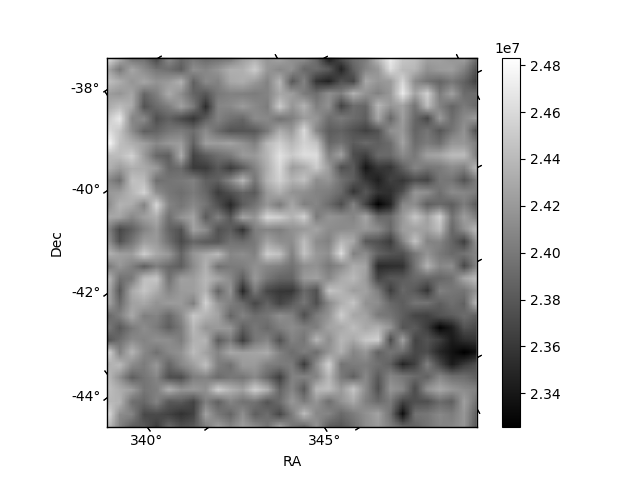
| Quadrant D | 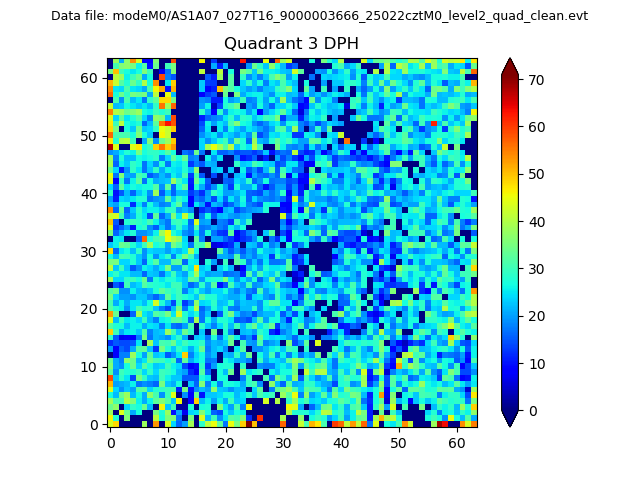 |
 |
Quadrant C |
| Plot type | Count rate plots | Images |
|---|---|---|
| Comparison with Poisson distribution Blue bars denote a histogram of data divided into 1 sec bins. Red curve is a Poisson curve with rate = median count rate of data. |
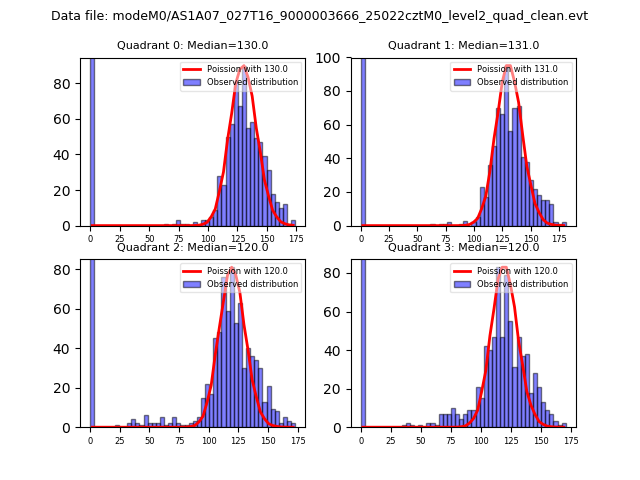 |
 |
| Quadrant-wise count rates Data is divided into 100 sec bins |
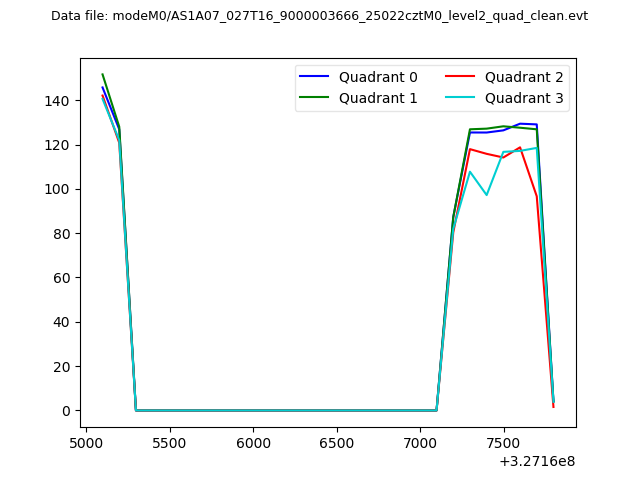 |
|
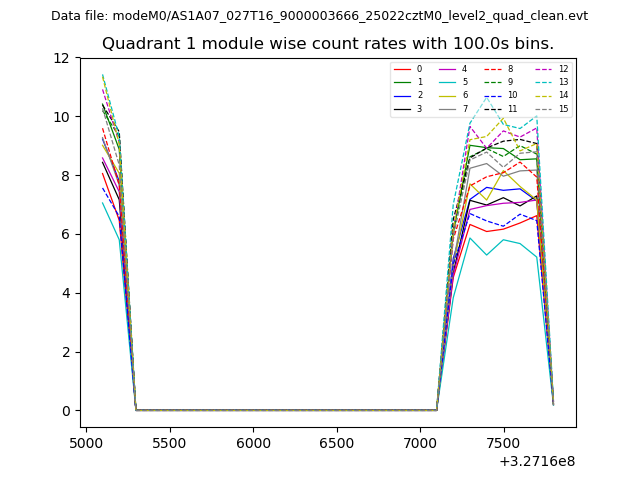
| Module-wise count rates for Quadrant A Data is divided into 100 sec bins |
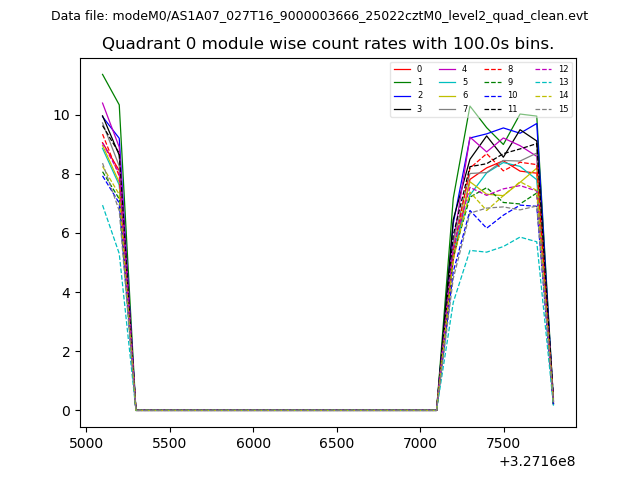 |
 |
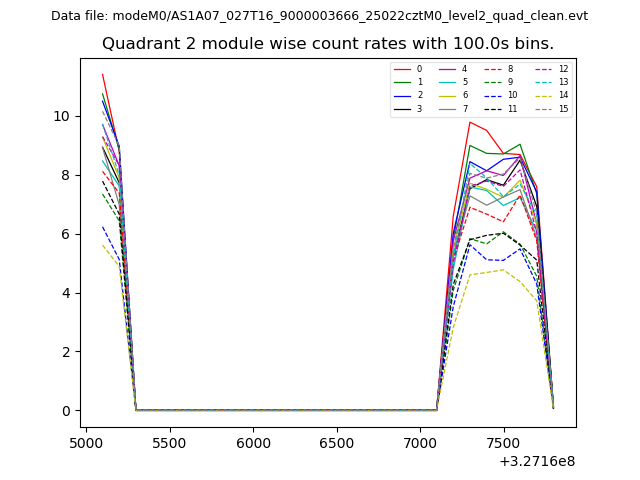
| Module-wise count rates for Quadrant B Data is divided into 100 sec bins |
 |
 |
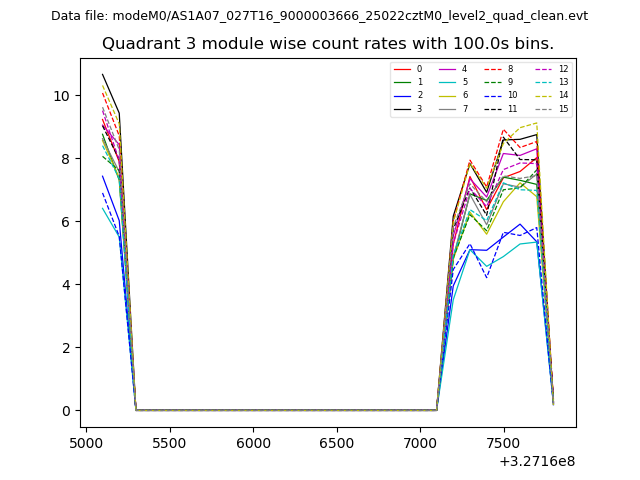
| Module-wise count rates for Quadrant C Data is divided into 100 sec bins |
 |
 |
| Module-wise count rates for Quadrant D Data is divided into 100 sec bins |
 |
 |
| Parameter | Plot |
|---|---|
| CZT HV Monitor | 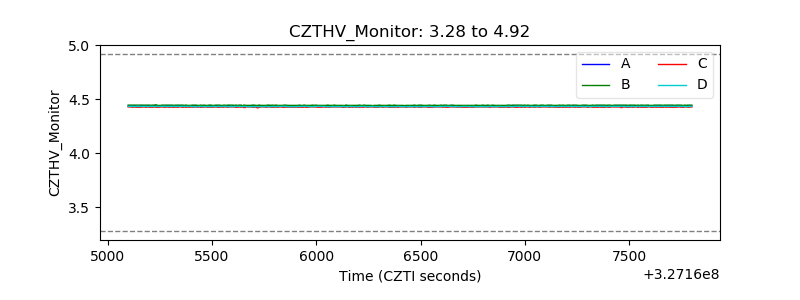 |
| D_VDD | 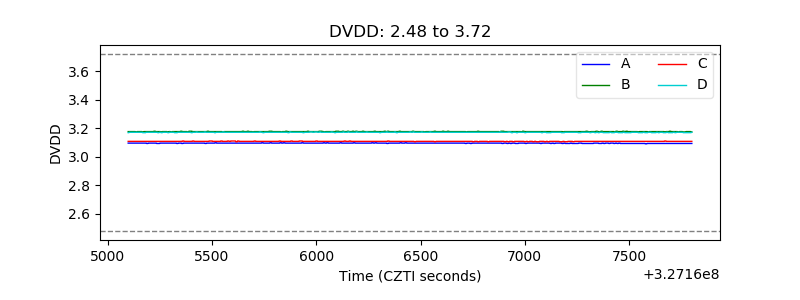 |
| Temperature 1 | 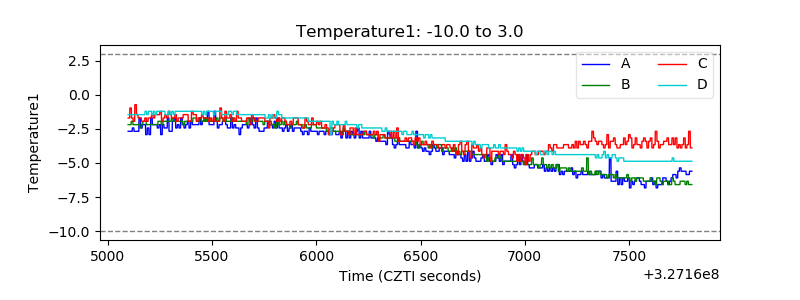 |
| Veto HV Monitor | 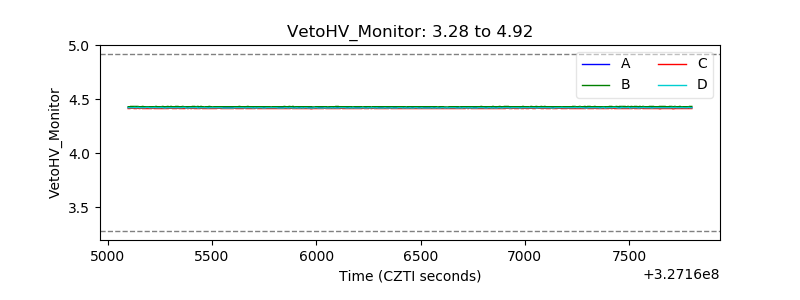 |
| Veto LLD |  |
| Alpha Counter | 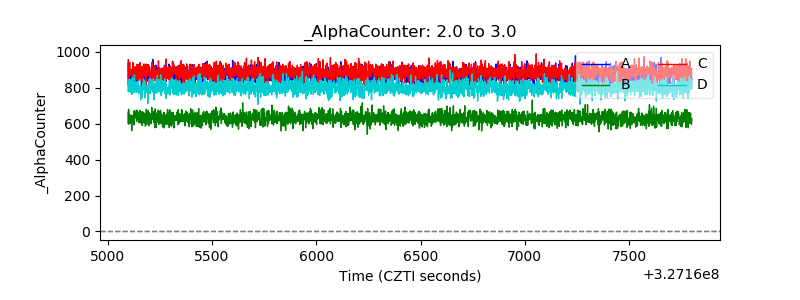 |
| _CPM_Rate | 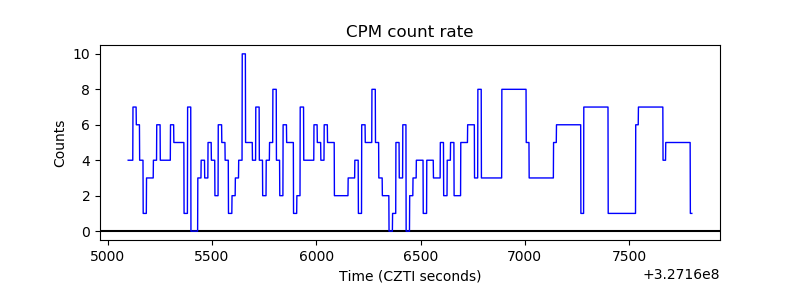 |
| CZT Counter | 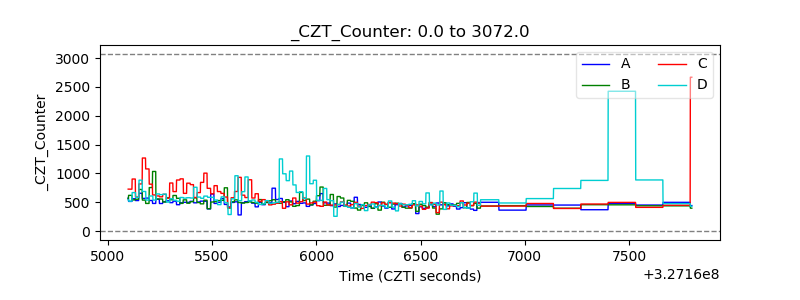 |
| +2.5 Volts monitor |  |
| +5 Volts monitor |  |
| _ROLL_ROT | 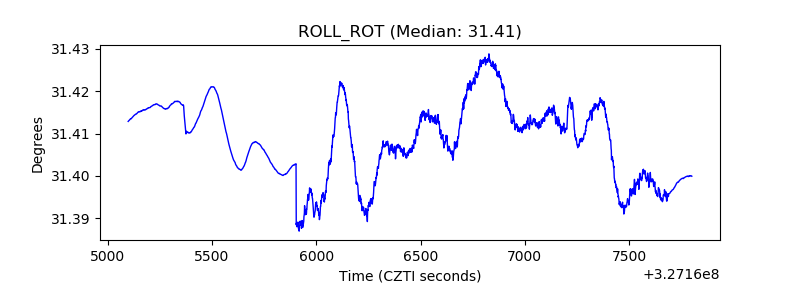 |
| _Roll_DEC | 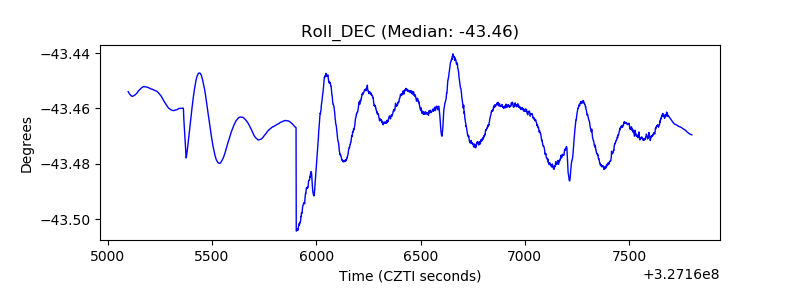 |
| _Roll_RA | 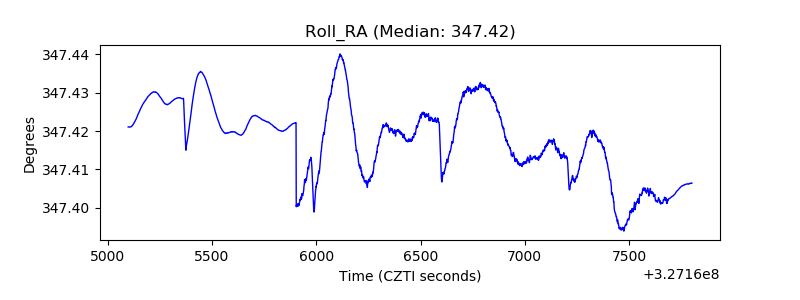 |
| Veto Counter | 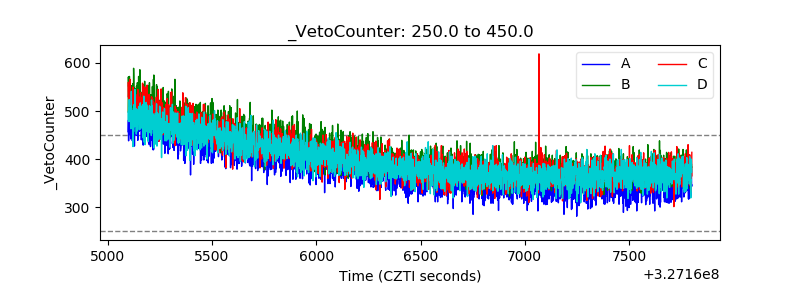 |