| Param | Original file | Final file |
|---|---|---|
| Filename | modeM0/AS1A07_027T11_9000003668cztM0_level2.fits | modeM0/AS1A07_027T11_9000003668cztM0_level2_quad_clean.evt |
| Size (bytes) | 82,177,920 | 37,748,160 |
| Size | 78.4 MB | 36.0 MB |
| Events in quadrant A | 542,406 | 172,482 |
| Events in quadrant B | 518,542 | 171,747 |
| Events in quadrant C | 463,636 | 116,538 |
| Events in quadrant D | 382,138 | 101,055 |
| Mode M0 | |||
|---|---|---|---|
| Quadrant | BADHDUFLAG | Total packets | Discarded packets |
| A | 0 | 17699 | 0 |
| B | 0 | 18091 | 0 |
| C | 0 | 38247 | 0 |
| D | 0 | 37719 | 0 |
| Mode SS | |||
|---|---|---|---|
| Quadrant | BADHDUFLAG | Total packets | Discarded packets |
| A | 0 | 172 | 0 |
| B | 0 | 172 | 0 |
| C | 0 | 172 | 0 |
| D | 0 | 172 | 0 |
| Mode M9 | |||
|---|---|---|---|
| Quadrant | BADHDUFLAG | Total packets | Discarded packets |
| A | 0 | 21 | 0 |
| B | 0 | 21 | 0 |
| C | 0 | 21 | 0 |
| D | 0 | 21 | 0 |
| Quadrant | Total seconds | Saturated seconds | Saturation percentage |
|---|---|---|---|
| A | 8345 | 93 | 1.114440% |
| B | 8345 | 106 | 1.270222% |
| C | 8345 | 2126 | 25.476333% |
| D | 8345 | 2874 | 34.439784% |
Noise dominated data is calculated using 1-second bins in cleaned event files. If a bin has >2000 counts, and if more than 50% of those come from <1% of pixels, then it is considered to be noise-dominated and hence unusable.
| Quadrant | # 1 sec bins | Bins with >0 counts | Bins with >2000 counts | High rate bins dominated by noise | Noise dominated (total time) | Noise dominated (detector-on time) | Marked lightcurve |
|---|---|---|---|---|---|---|---|
| A | 10505 | 8344 | 0 | 0 | 0.00% | 0.00% | 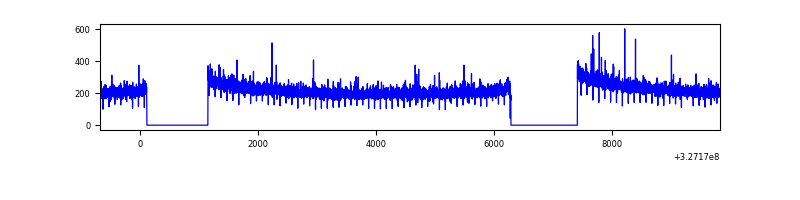 |
| B | 10505 | 8345 | 0 | 0 | 0.00% | 0.00% | 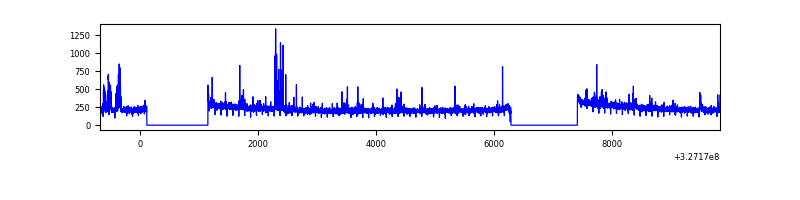 |
| C | 10505 | 8343 | 0 | 0 | 0.00% | 0.00% | 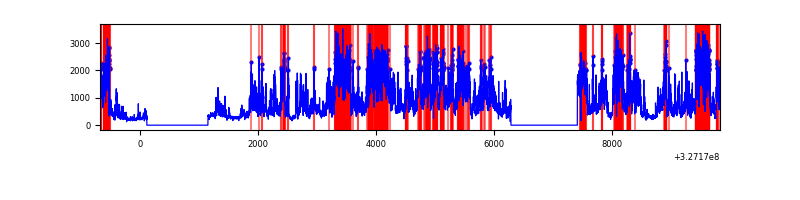 |
| D | 10505 | 8334 | 0 | 0 | 0.00% | 0.00% | 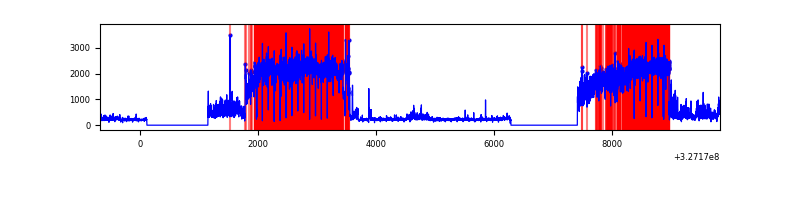 |
Top three noisy pixels from each quadrant. If the there are fewer than three noisy pixels in the level2.evt file, extra rows are filled as -1
| Pixel properties | Quadrant properties | ||||||
|---|---|---|---|---|---|---|---|
| Quadrant | DetID | PixID | Counts | Sigma | Mean | Median | Sigma |
| A | 0 | 29 | 516 | 10.4 | 141 | 133 | 36.8 |
| A | 7 | 110 | 414 | 7.63 | 141 | 133 | 36.8 |
| A | 0 | 30 | 412 | 7.57 | 141 | 133 | 36.8 |
| B | 2 | 9 | 416 | 9.67 | 137 | 131 | 29.5 |
| B | 3 | 80 | 389 | 8.76 | 137 | 131 | 29.5 |
| B | 5 | 225 | 377 | 8.35 | 137 | 131 | 29.5 |
| C | 1 | 81 | 364 | 7.5 | 122 | 114 | 33.4 |
| C | 3 | 202 | 347 | 6.99 | 122 | 114 | 33.4 |
| C | 1 | 80 | 338 | 6.72 | 122 | 114 | 33.4 |
| D | 15 | 46 | 291 | 6.34 | 109 | 99 | 30.3 |
| D | 3 | 14 | 279 | 5.94 | 109 | 99 | 30.3 |
| D | 6 | 38 | 276 | 5.84 | 109 | 99 | 30.3 |
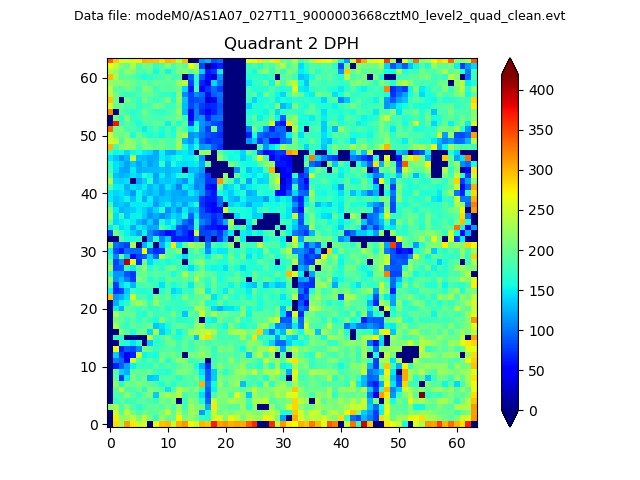
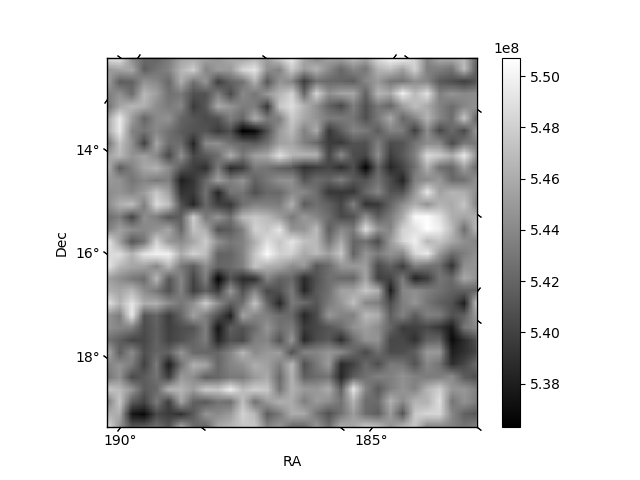
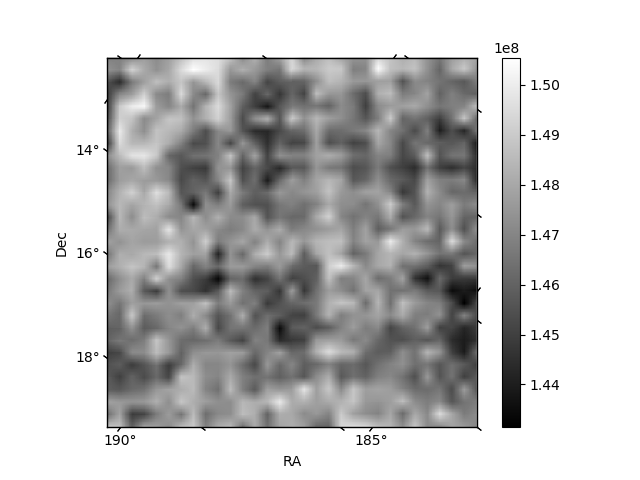
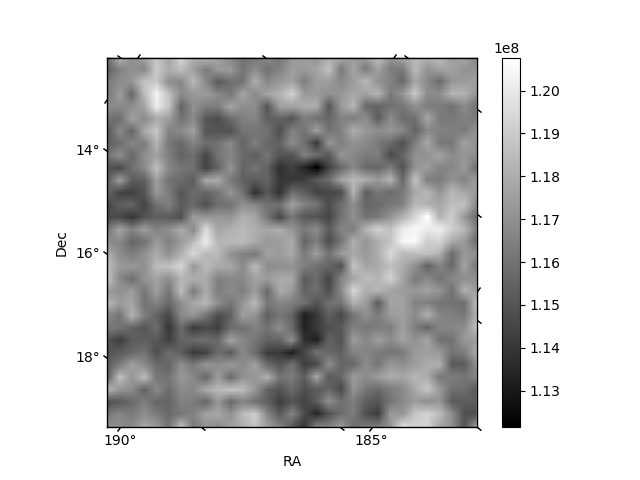
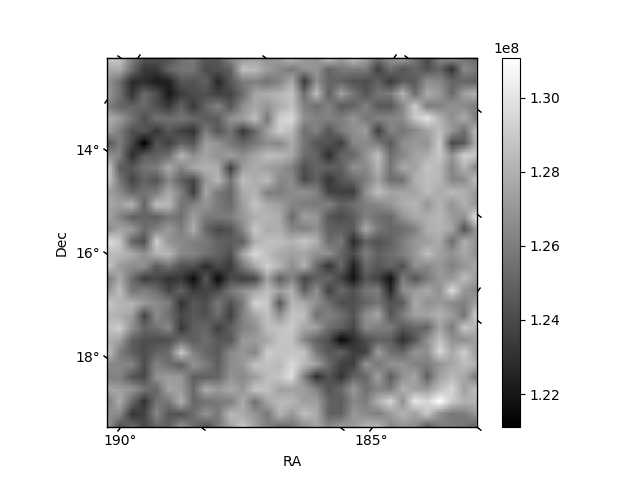
Histogram calculated using DETX and DETY for each event in the final _common_clean file
| Quadrant A | 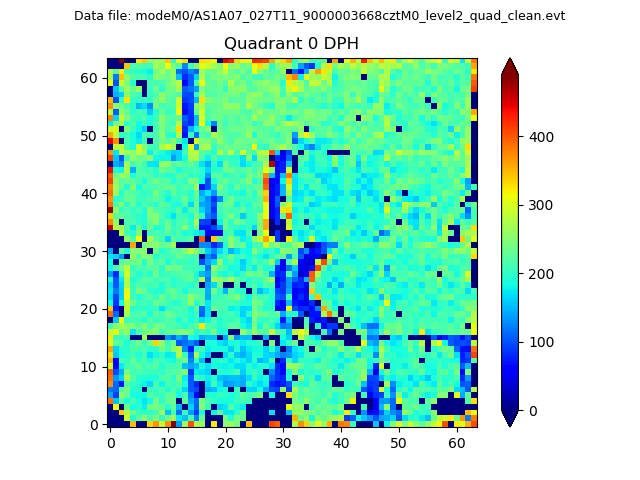 |
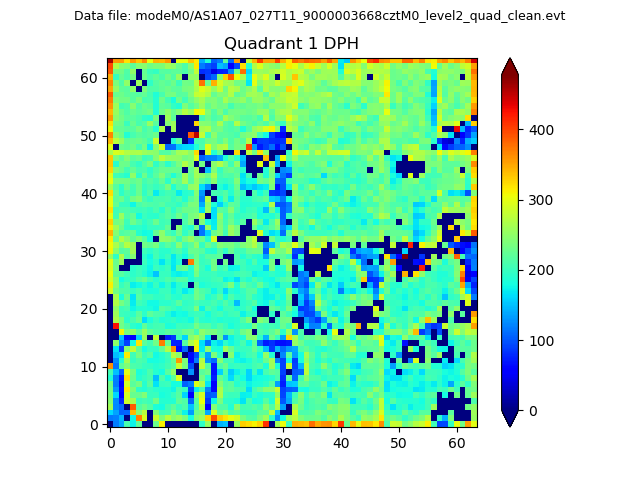 |
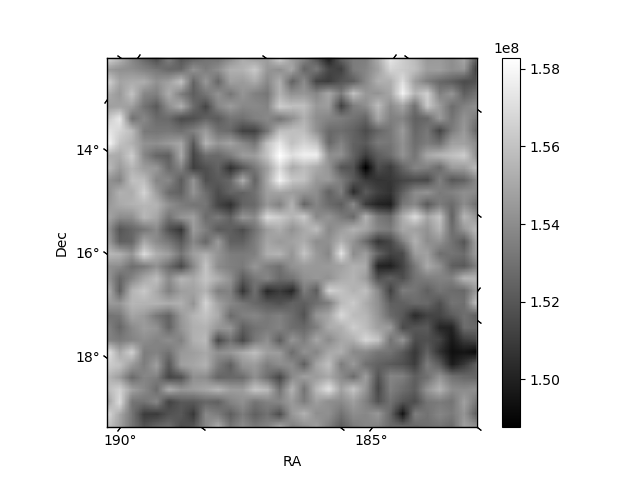
Quadrant B |
|---|---|---|---|
| Quadrant D | 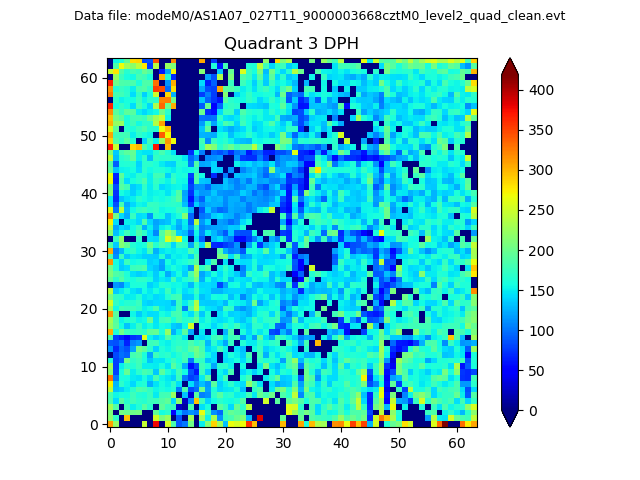 |
 |
Quadrant C |
| Plot type | Count rate plots | Images |
|---|---|---|
| Comparison with Poisson distribution Blue bars denote a histogram of data divided into 1 sec bins. Red curve is a Poisson curve with rate = median count rate of data. |
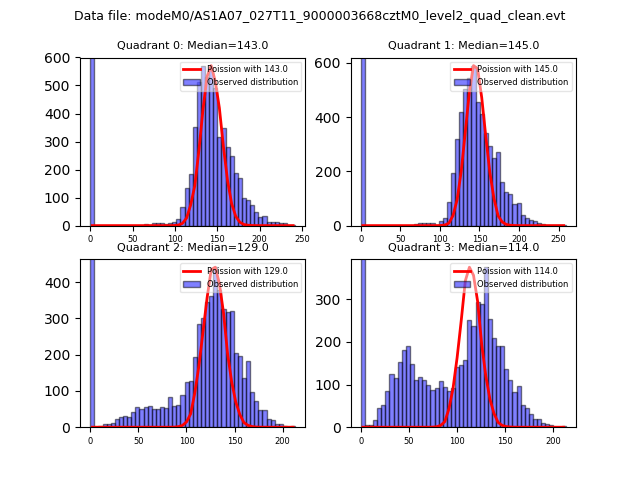 |
 |
| Quadrant-wise count rates Data is divided into 100 sec bins |
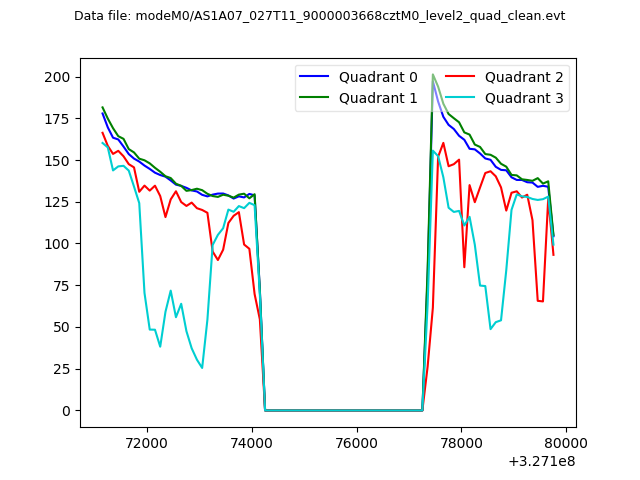 |
|
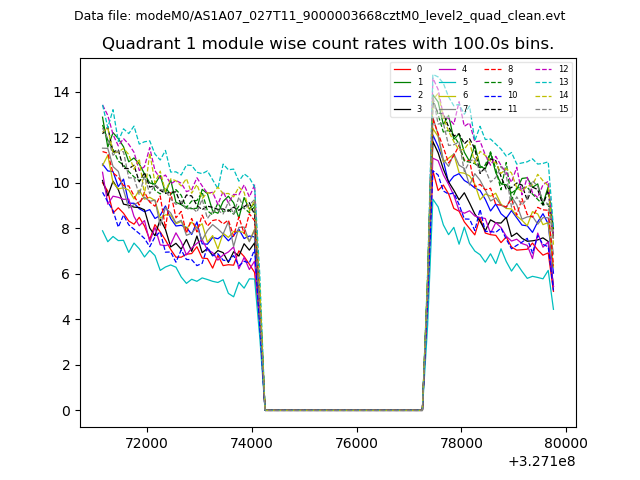
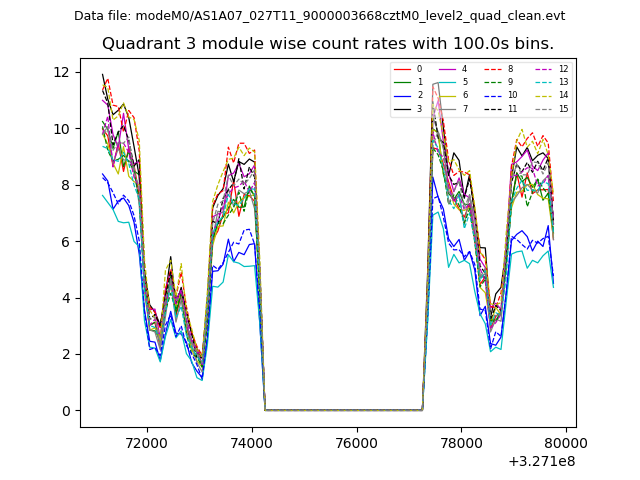
| Module-wise count rates for Quadrant A Data is divided into 100 sec bins |
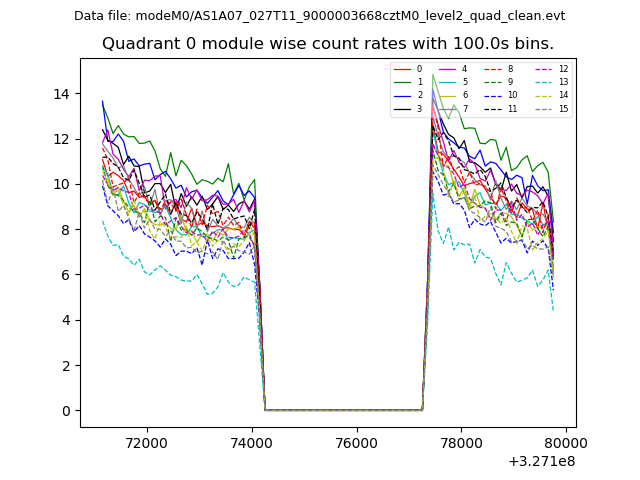 |
 |
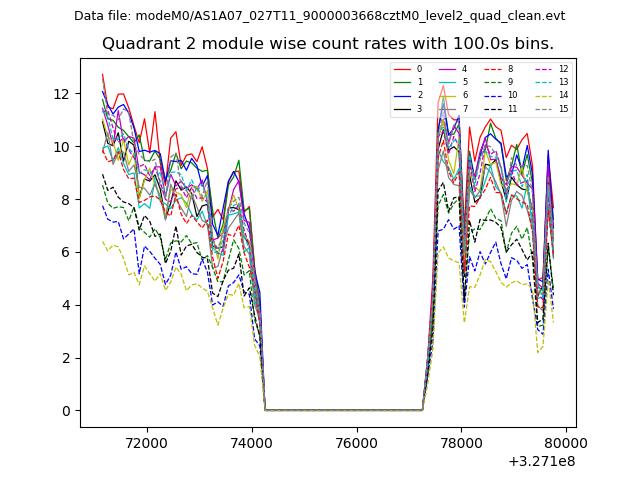
| Module-wise count rates for Quadrant B Data is divided into 100 sec bins |
 |
 |
| Module-wise count rates for Quadrant C Data is divided into 100 sec bins |
 |
 |
| Module-wise count rates for Quadrant D Data is divided into 100 sec bins |
 |
 |
| Parameter | Plot |
|---|---|
| CZT HV Monitor | 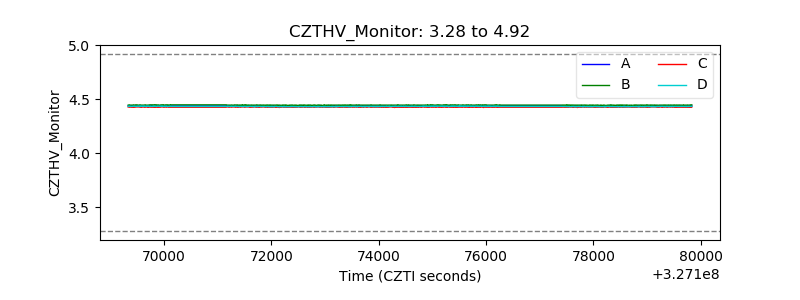 |
| D_VDD | 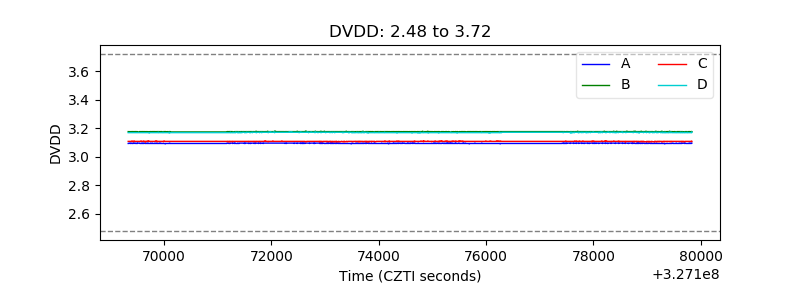 |
| Temperature 1 | 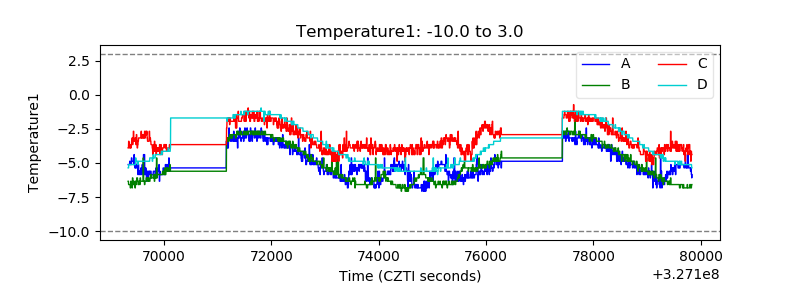 |
| Veto HV Monitor | 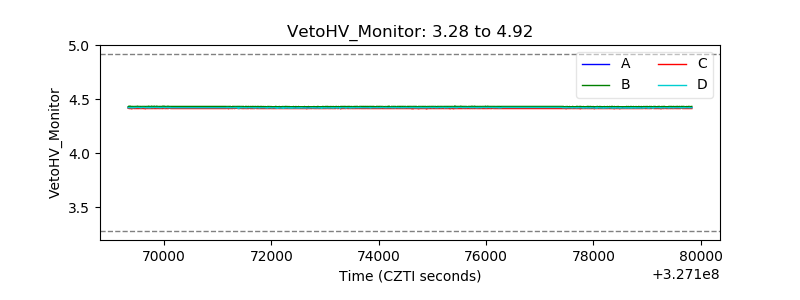 |
| Veto LLD | 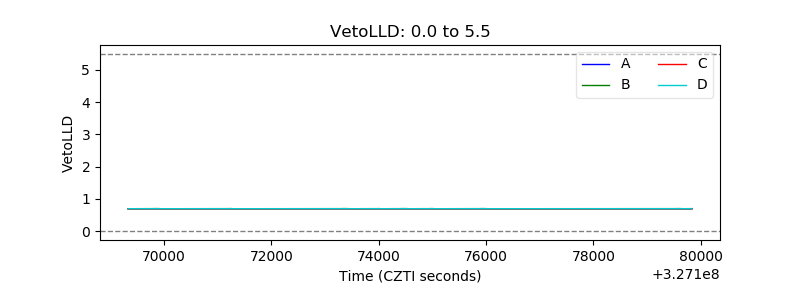 |
| Alpha Counter | 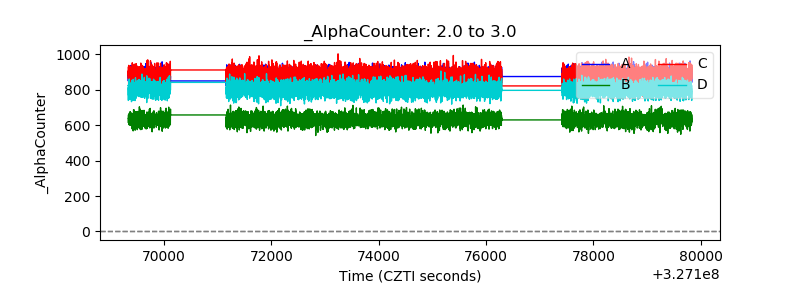 |
| _CPM_Rate | 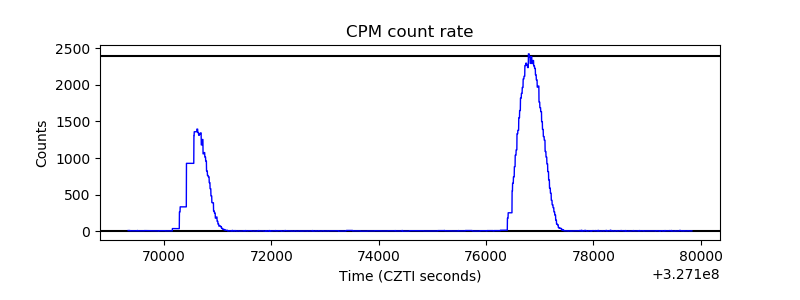 |
| CZT Counter | 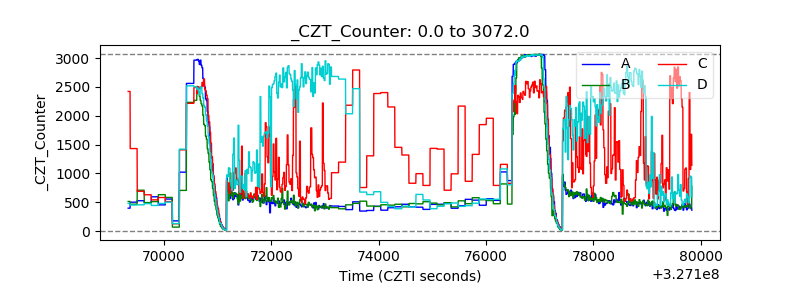 |
| +2.5 Volts monitor | 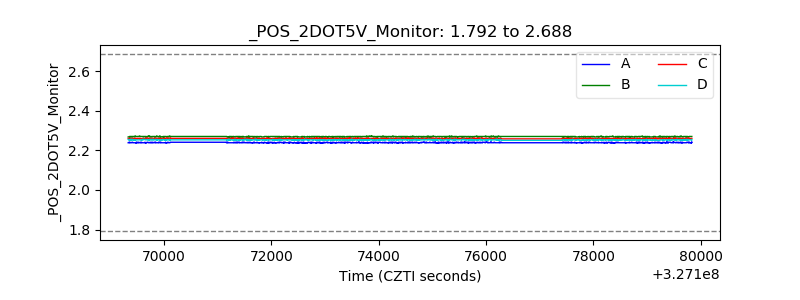 |
| +5 Volts monitor | 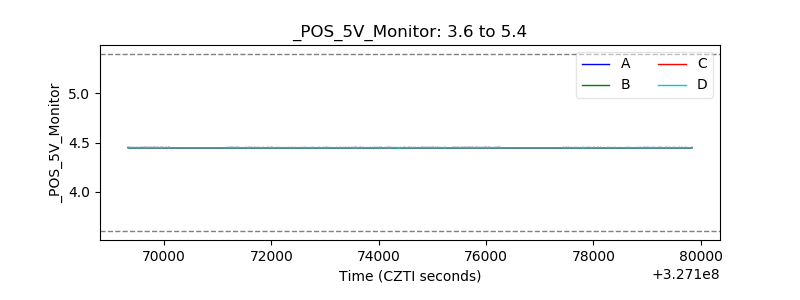 |
| _ROLL_ROT | 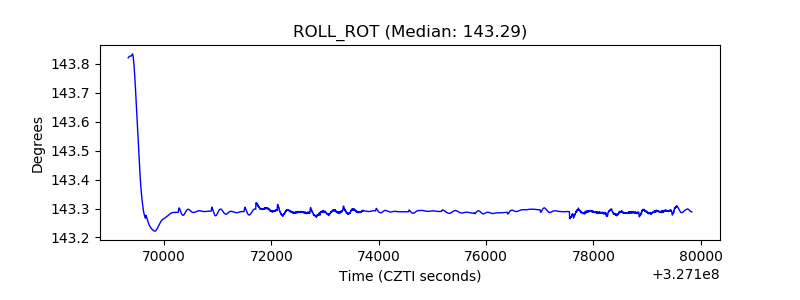 |
| _Roll_DEC | 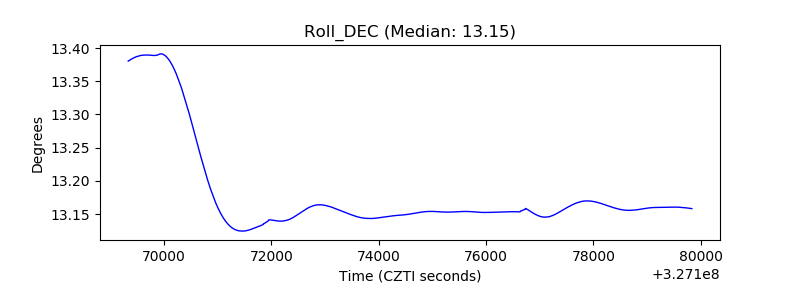 |
| _Roll_RA | 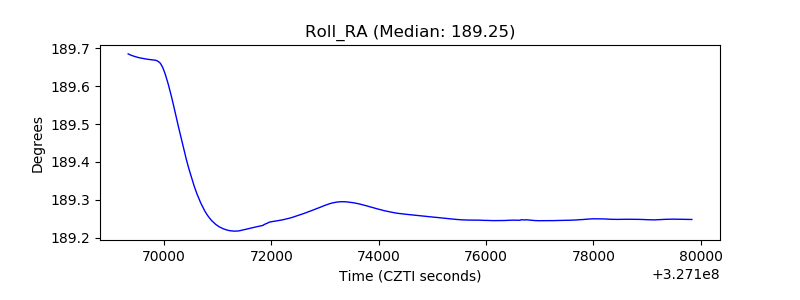 |
| Veto Counter | 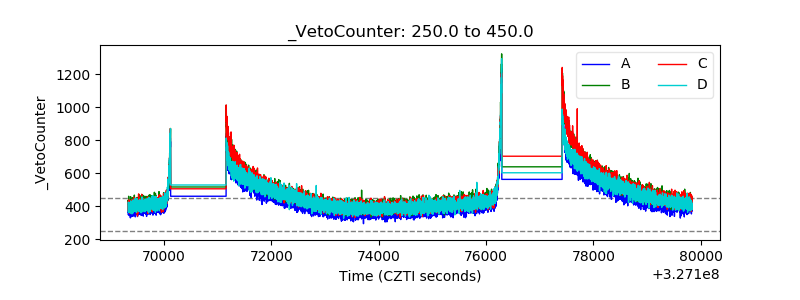 |