| Param | Original file | Final file |
|---|---|---|
| Filename | modeM0/AS1A07_027T11_9000003668_25025cztM0_level2.evt | modeM0/AS1A07_027T11_9000003668_25025cztM0_level2_quad_clean.evt |
| Size (bytes) | 334,883,520 | 49,340,160 |
| Size | 319.4 MB | 47.1 MB |
| Events in quadrant A | 1,230,080 | 370,322 |
| Events in quadrant B | 1,259,935 | 380,319 |
| Events in quadrant C | 3,405,245 | 298,543 |
| Events in quadrant D | 4,081,473 | 270,031 |
| Mode M0 | |||
|---|---|---|---|
| Quadrant | BADHDUFLAG | Total packets | Discarded packets |
| A | 0 | 5260 | 1 |
| B | 0 | 5335 | 1 |
| C | 0 | 11820 | 1 |
| D | 0 | 13749 | 1 |
| Mode SS | |||
|---|---|---|---|
| Quadrant | BADHDUFLAG | Total packets | Discarded packets |
| A | 0 | 48 | 0 |
| B | 0 | 48 | 0 |
| C | 0 | 48 | 0 |
| D | 0 | 48 | 0 |
| Mode M9 | |||
|---|---|---|---|
| Quadrant | BADHDUFLAG | Total packets | Discarded packets |
| A | 0 | 3 | 0 |
| B | 0 | 4 | 0 |
| C | 0 | 4 | 0 |
| D | 0 | 4 | 0 |
| Quadrant | Total seconds | Saturated seconds | Saturation percentage |
|---|---|---|---|
| A | 2417 | 7 | 0.289615% |
| B | 2417 | 11 | 0.455110% |
| C | 2417 | 737 | 30.492346% |
| D | 2417 | 1301 | 53.827058% |
Noise dominated data is calculated using 1-second bins in cleaned event files. If a bin has >2000 counts, and if more than 50% of those come from <1% of pixels, then it is considered to be noise-dominated and hence unusable.
| Quadrant | # 1 sec bins | Bins with >0 counts | Bins with >2000 counts | High rate bins dominated by noise | Noise dominated (total time) | Noise dominated (detector-on time) | Marked lightcurve |
|---|---|---|---|---|---|---|---|
| A | 2417 | 2417 | 0 | 0 | 0.00% | 0.00% |  |
| B | 2417 | 2417 | 0 | 0 | 0.00% | 0.00% |  |
| C | 2417 | 2417 | 534 | 534 | 22.09% | 22.09% | 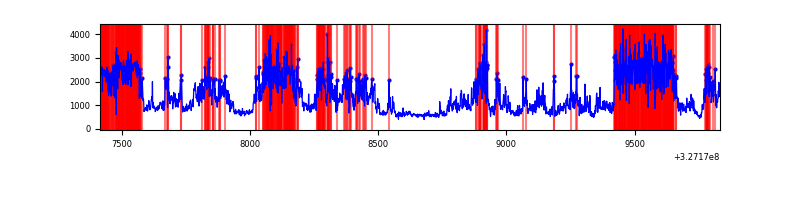 |
| D | 2417 | 2417 | 1159 | 1159 | 47.95% | 47.95% |  |
Top three noisy pixels from each quadrant. If the there are fewer than three noisy pixels in the level2.evt file, extra rows are filled as -1
| Pixel properties | Quadrant properties | ||||||
|---|---|---|---|---|---|---|---|
| Quadrant | DetID | PixID | Counts | Sigma | Mean | Median | Sigma |
| A | 13 | 254 | 3480 | 48.98 | 318 | 313 | 64.7 |
| A | 0 | 226 | 2754 | 37.75 | 318 | 313 | 64.7 |
| A | 3 | 137 | 2673 | 36.5 | 318 | 313 | 64.7 |
| B | 0 | 190 | 7590 | 120.26 | 316 | 309 | 60.5 |
| B | 12 | 111 | 6628 | 104.37 | 316 | 309 | 60.5 |
| B | 11 | 111 | 5995 | 93.92 | 316 | 309 | 60.5 |
| C | 7 | 247 | 2286920 | 36272.42 | 268 | 271 | 63.0 |
| C | 14 | 238 | 41607 | 655.7 | 268 | 271 | 63.0 |
| C | 0 | 239 | 20915 | 327.47 | 268 | 271 | 63.0 |
| D | 7 | 238 | 2824628 | 44471.21 | 257 | 251 | 63.5 |
| D | 8 | 195 | 254222 | 3998.9 | 257 | 251 | 63.5 |
| D | 10 | 70 | 20927 | 325.55 | 257 | 251 | 63.5 |
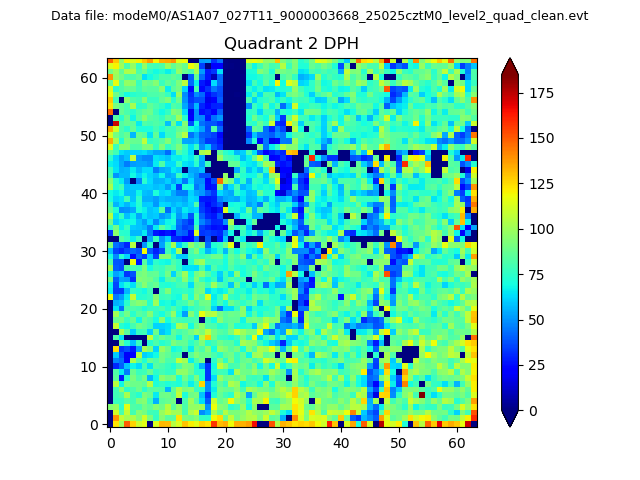
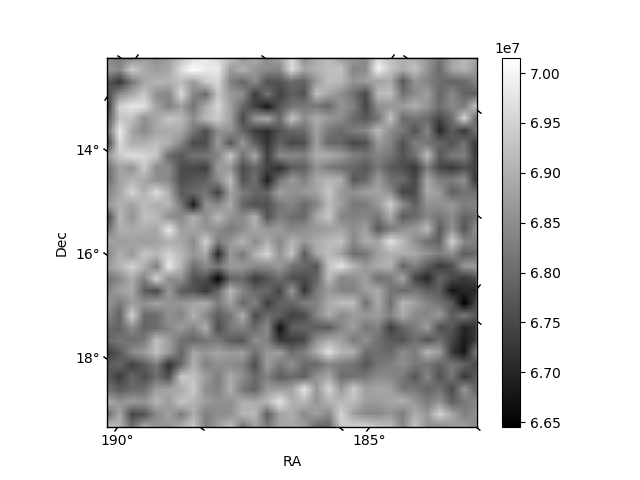
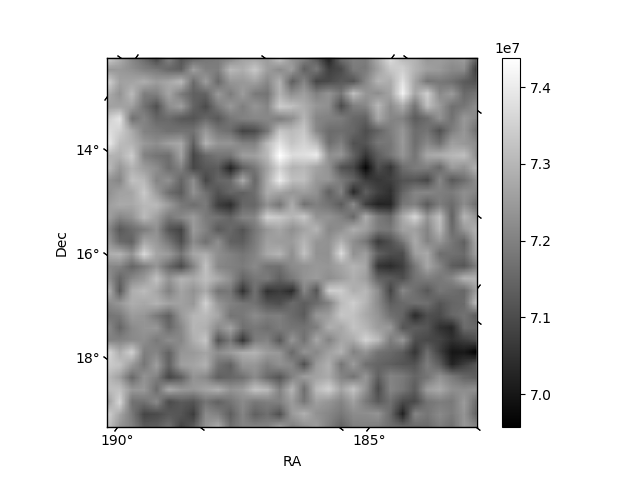
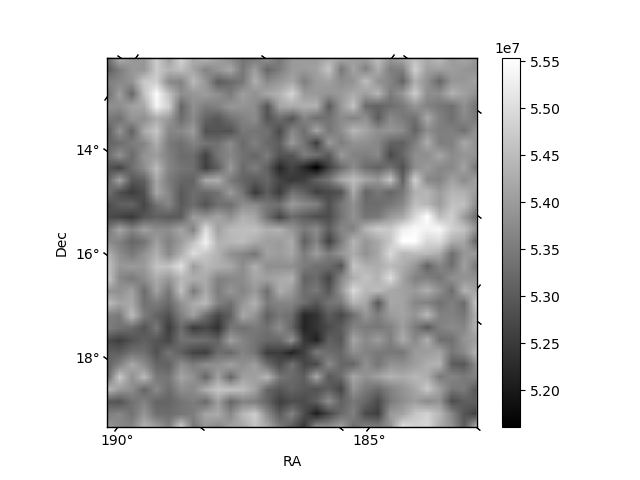
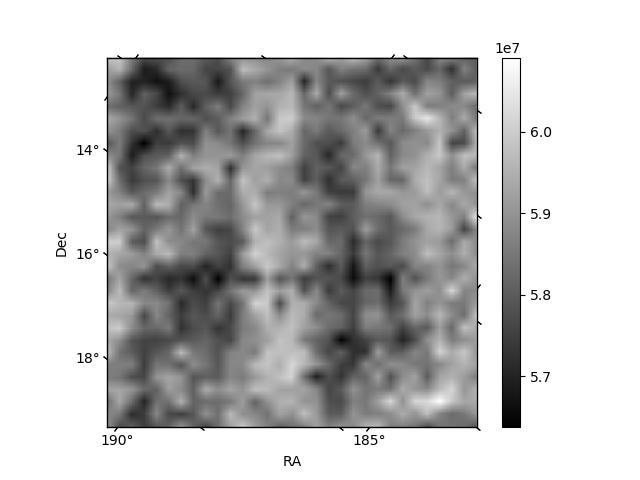
Histogram calculated using DETX and DETY for each event in the final _common_clean file
| Quadrant A | 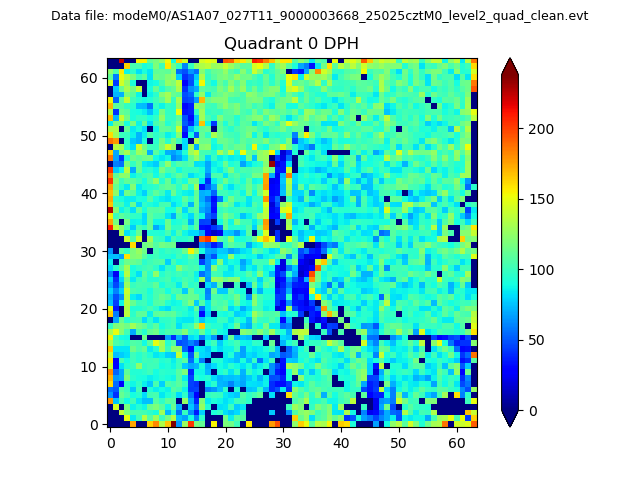 |
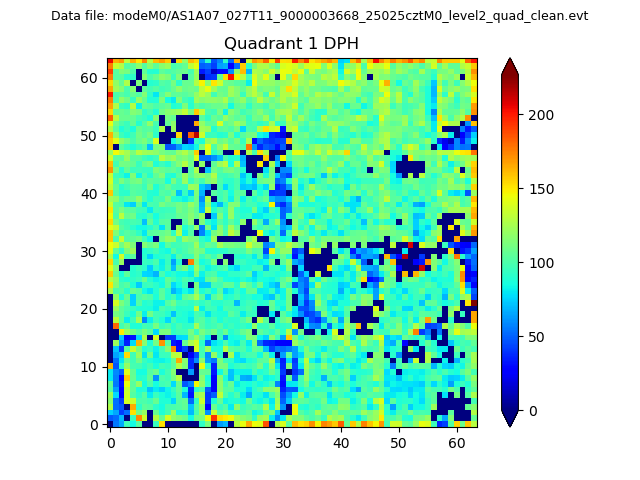 |
Quadrant B |
|---|---|---|---|
| Quadrant D | 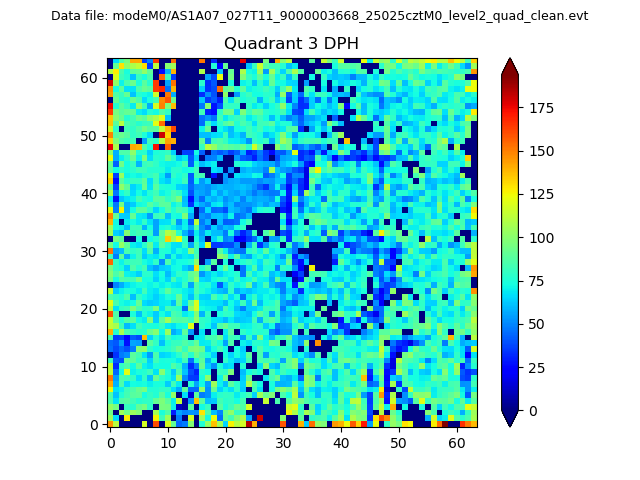 |
 |
Quadrant C |
| Plot type | Count rate plots | Images |
|---|---|---|
| Comparison with Poisson distribution Blue bars denote a histogram of data divided into 1 sec bins. Red curve is a Poisson curve with rate = median count rate of data. |
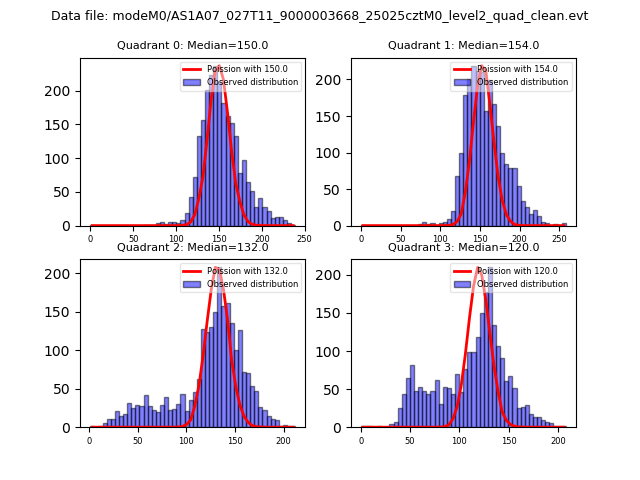 |
 |
| Quadrant-wise count rates Data is divided into 100 sec bins |
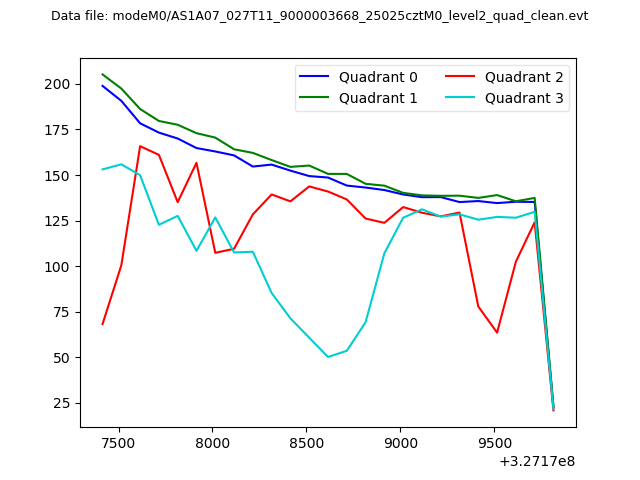 |
|
| Module-wise count rates for Quadrant A Data is divided into 100 sec bins |
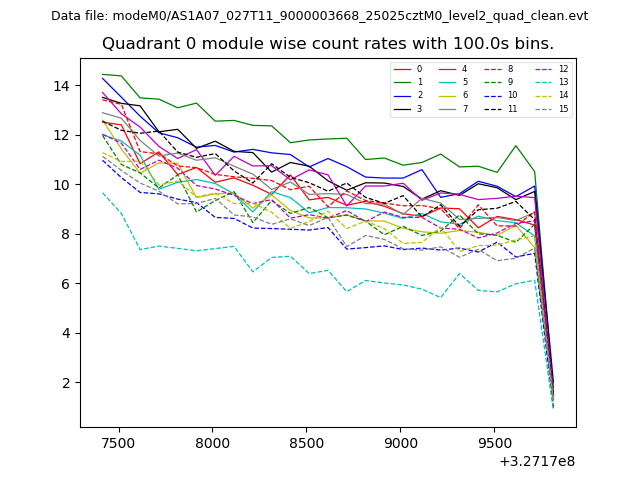 |
 |
| Module-wise count rates for Quadrant B Data is divided into 100 sec bins |
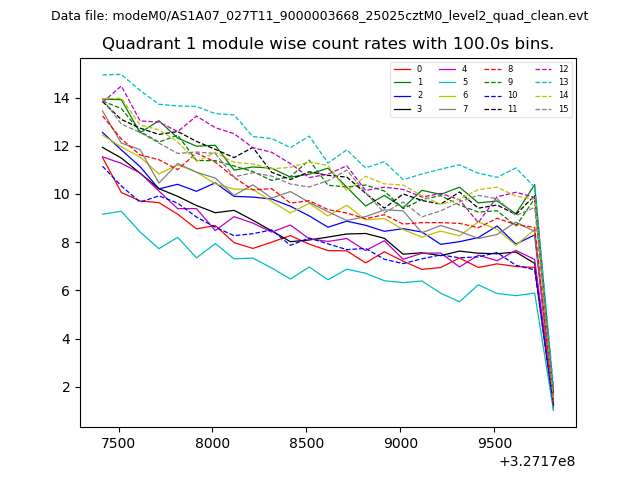 |
 |
| Module-wise count rates for Quadrant C Data is divided into 100 sec bins |
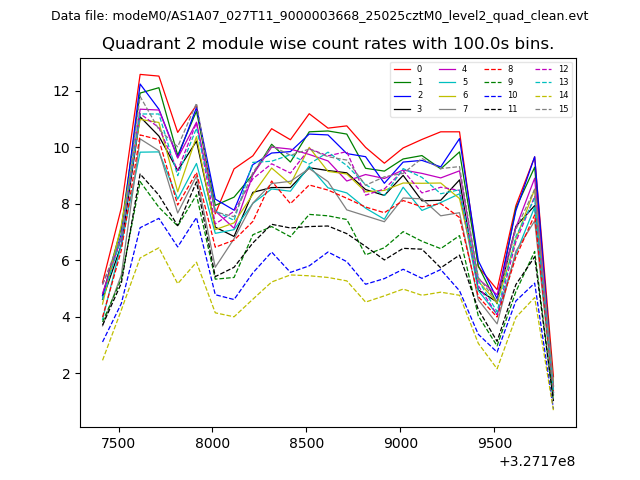 |
 |
| Module-wise count rates for Quadrant D Data is divided into 100 sec bins |
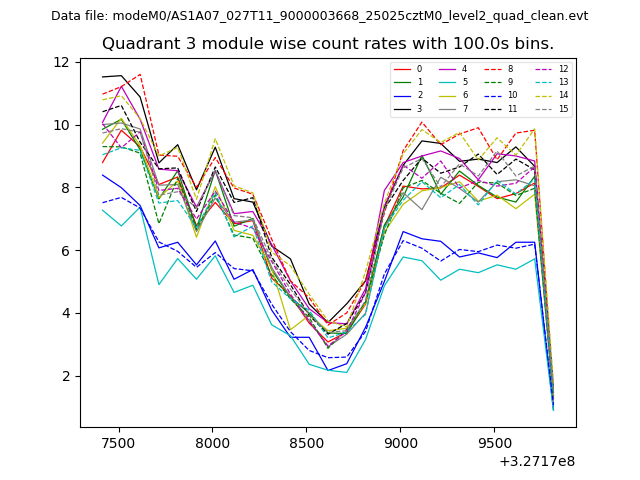 |
 |
| Parameter | Plot |
|---|---|
| CZT HV Monitor | 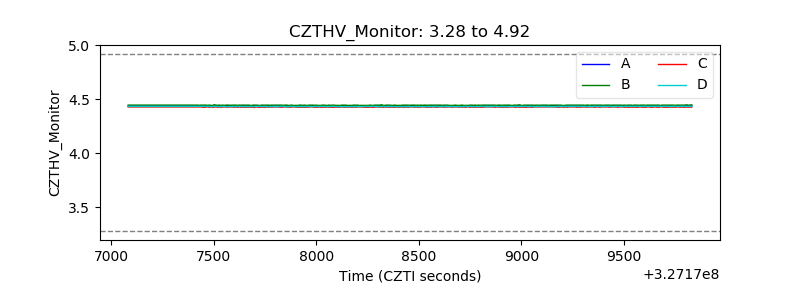 |
| D_VDD | 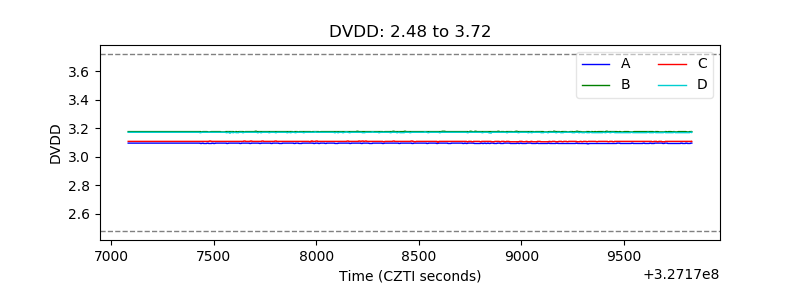 |
| Temperature 1 | 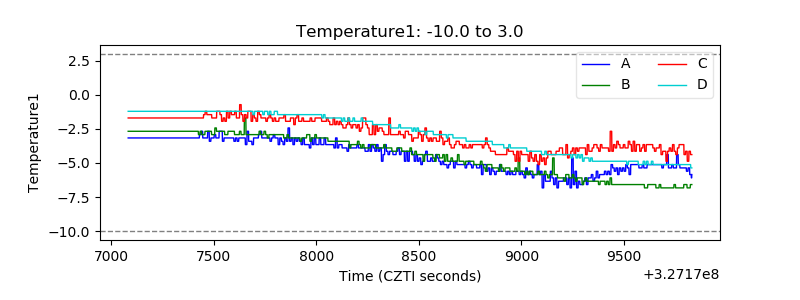 |
| Veto HV Monitor | 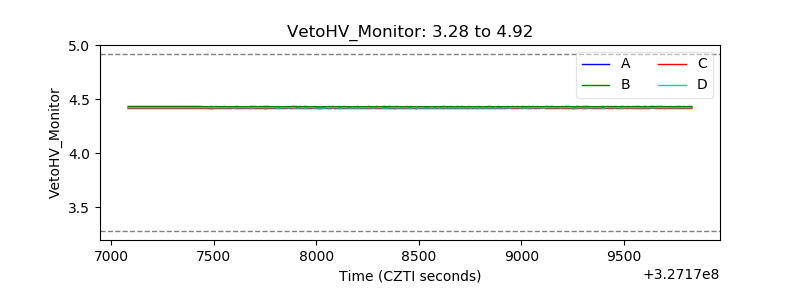 |
| Veto LLD | 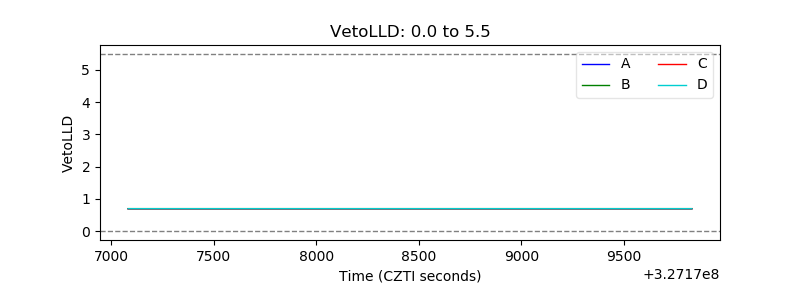 |
| Alpha Counter | 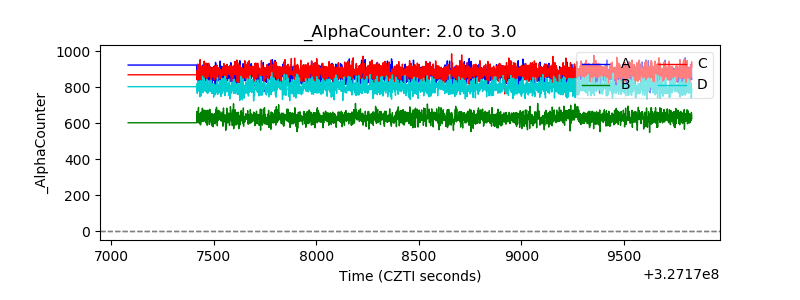 |
| _CPM_Rate | 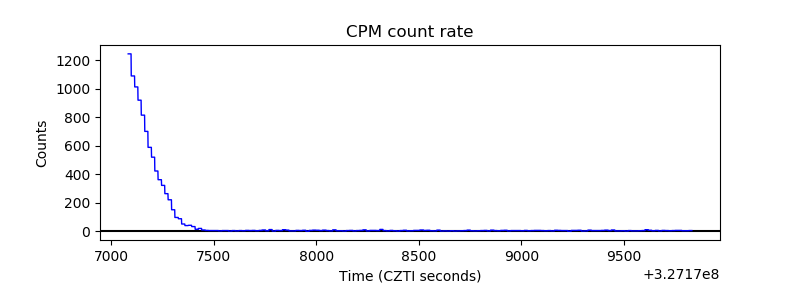 |
| CZT Counter | 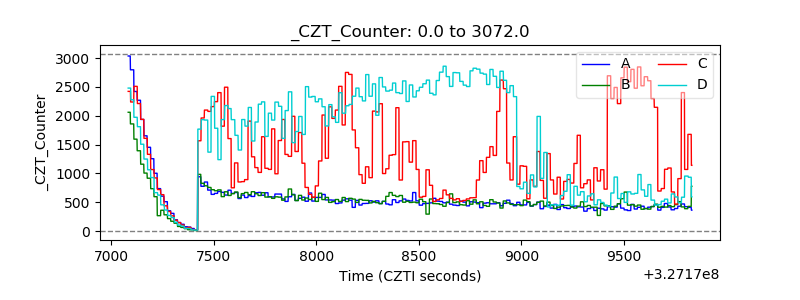 |
| +2.5 Volts monitor |  |
| +5 Volts monitor | 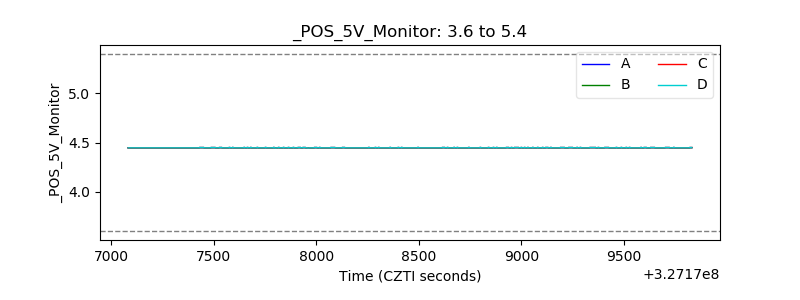 |
| _ROLL_ROT | 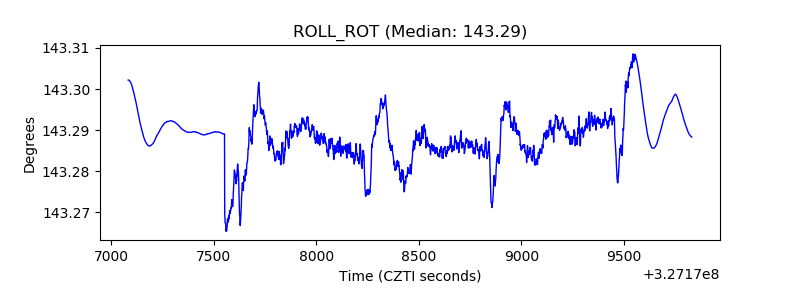 |
| _Roll_DEC | 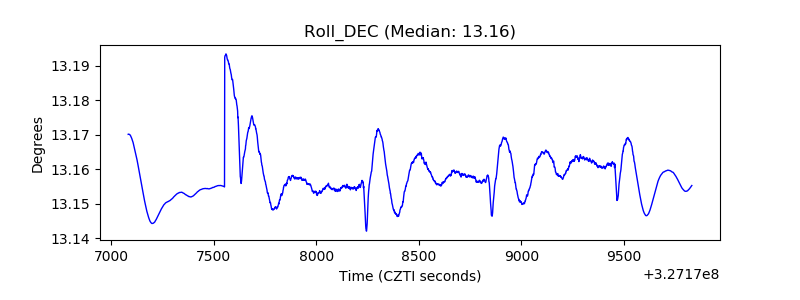 |
| _Roll_RA | 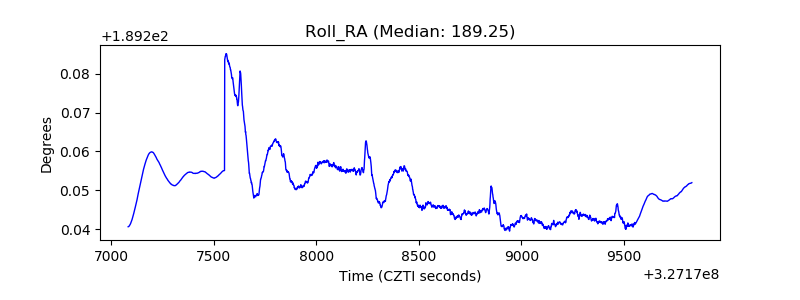 |
| Veto Counter | 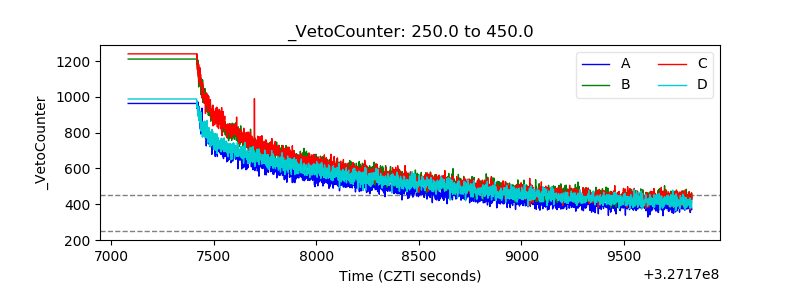 |