| Param | Original file | Final file |
|---|---|---|
| Filename | modeM0/AS1A07_134T03_9000003670cztM0_level2.fits | modeM0/AS1A07_134T03_9000003670cztM0_level2_quad_clean.evt |
| Size (bytes) | 343,523,520 | 214,891,200 |
| Size | 327.6 MB | 204.9 MB |
| Events in quadrant A | 2,156,020 | 1,111,454 |
| Events in quadrant B | 2,068,452 | 1,123,744 |
| Events in quadrant C | 2,098,020 | 1,042,811 |
| Events in quadrant D | 1,820,634 | 967,275 |
| Mode M9 | |||
|---|---|---|---|
| Quadrant | BADHDUFLAG | Total packets | Discarded packets |
| A | 0 | 69 | 0 |
| B | 0 | 69 | 0 |
| C | 0 | 69 | 0 |
| D | 0 | 69 | 0 |
| Mode M0 | |||
|---|---|---|---|
| Quadrant | BADHDUFLAG | Total packets | Discarded packets |
| A | 0 | 69364 | 0 |
| B | 0 | 72943 | 0 |
| C | 0 | 83110 | 0 |
| D | 0 | 102796 | 0 |
| Mode SS | |||
|---|---|---|---|
| Quadrant | BADHDUFLAG | Total packets | Discarded packets |
| A | 0 | 666 | 0 |
| B | 0 | 666 | 0 |
| C | 0 | 666 | 0 |
| D | 0 | 666 | 0 |
| Quadrant | Total seconds | Saturated seconds | Saturation percentage |
|---|---|---|---|
| A | 32883 | 490 | 1.490132% |
| B | 32883 | 649 | 1.973664% |
| C | 32884 | 1464 | 4.452013% |
| D | 32884 | 1528 | 4.646637% |
Noise dominated data is calculated using 1-second bins in cleaned event files. If a bin has >2000 counts, and if more than 50% of those come from <1% of pixels, then it is considered to be noise-dominated and hence unusable.
| Quadrant | # 1 sec bins | Bins with >0 counts | Bins with >2000 counts | High rate bins dominated by noise | Noise dominated (total time) | Noise dominated (detector-on time) | Marked lightcurve |
|---|---|---|---|---|---|---|---|
| A | 44686 | 32885 | 0 | 0 | 0.00% | 0.00% |  |
| B | 44686 | 32885 | 0 | 0 | 0.00% | 0.00% |  |
| C | 44686 | 32887 | 0 | 0 | 0.00% | 0.00% |  |
| D | 44686 | 32842 | 0 | 0 | 0.00% | 0.00% |  |
Top three noisy pixels from each quadrant. If the there are fewer than three noisy pixels in the level2.evt file, extra rows are filled as -1
| Pixel properties | Quadrant properties | ||||||
|---|---|---|---|---|---|---|---|
| Quadrant | DetID | PixID | Counts | Sigma | Mean | Median | Sigma |
| A | 0 | 29 | 2007 | 10.72 | 560 | 526 | 138.2 |
| A | 7 | 110 | 1674 | 8.31 | 560 | 526 | 138.2 |
| A | 9 | 19 | 1636 | 8.03 | 560 | 526 | 138.2 |
| B | 2 | 9 | 1643 | 10.24 | 547 | 524 | 109.3 |
| B | 2 | 8 | 1399 | 8.01 | 547 | 524 | 109.3 |
| B | 5 | 128 | 1347 | 7.53 | 547 | 524 | 109.3 |
| C | 12 | 241 | 1459 | 6.59 | 555 | 522 | 142.2 |
| C | 9 | 233 | 1415 | 6.28 | 555 | 522 | 142.2 |
| C | 9 | 209 | 1407 | 6.22 | 555 | 522 | 142.2 |
| D | 6 | 38 | 1285 | 5.92 | 519 | 475 | 136.8 |
| D | 3 | 14 | 1280 | 5.89 | 519 | 475 | 136.8 |
| D | 6 | 231 | 1275 | 5.85 | 519 | 475 | 136.8 |
Histogram calculated using DETX and DETY for each event in the final _common_clean file
| Quadrant A | 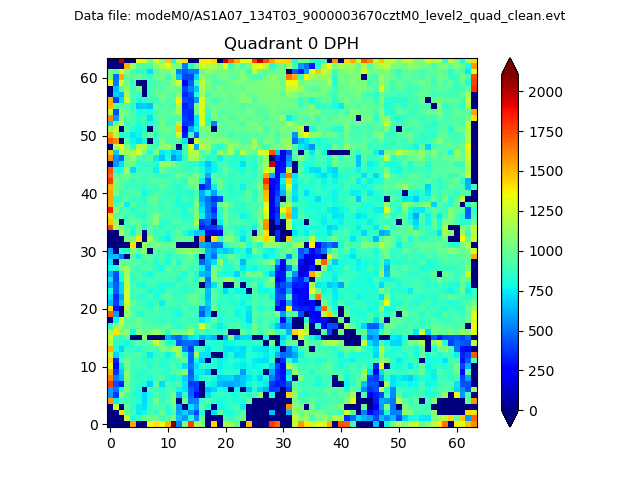 |
 |
Quadrant B |
|---|---|---|---|
| Quadrant D |  |
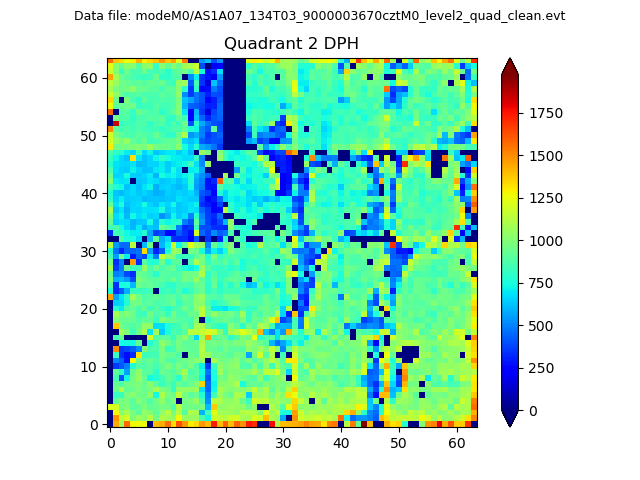 |
Quadrant C |
| Plot type | Count rate plots | Images |
|---|---|---|
| Comparison with Poisson distribution Blue bars denote a histogram of data divided into 1 sec bins. Red curve is a Poisson curve with rate = median count rate of data. |
 |
 |
| Quadrant-wise count rates Data is divided into 100 sec bins |
 |
|
| Module-wise count rates for Quadrant A Data is divided into 100 sec bins |
 |
 |
| Module-wise count rates for Quadrant B Data is divided into 100 sec bins |
 |
 |
| Module-wise count rates for Quadrant C Data is divided into 100 sec bins |
 |
 |
| Module-wise count rates for Quadrant D Data is divided into 100 sec bins |
 |
 |
| Parameter | Plot |
|---|---|
| CZT HV Monitor |  |
| D_VDD |  |
| Temperature 1 |  |
| Veto HV Monitor |  |
| Veto LLD |  |
| Alpha Counter |  |
| _CPM_Rate |  |
| CZT Counter |  |
| +2.5 Volts monitor |  |
| +5 Volts monitor |  |
| _ROLL_ROT |  |
| _Roll_DEC |  |
| _Roll_RA |  |
| Veto Counter |  |