| Param | Original file | Final file |
|---|---|---|
| Filename | modeM0/AS1A07_134T03_9000003670_25025cztM0_level2.evt | modeM0/AS1A07_134T03_9000003670_25025cztM0_level2_quad_clean.evt |
| Size (bytes) | 255,873,600 | 36,541,440 |
| Size | 244.0 MB | 34.8 MB |
| Events in quadrant A | 1,442,258 | 237,268 |
| Events in quadrant B | 1,471,709 | 243,139 |
| Events in quadrant C | 2,790,796 | 219,278 |
| Events in quadrant D | 1,870,103 | 223,664 |
| Mode M9 | |||
|---|---|---|---|
| Quadrant | BADHDUFLAG | Total packets | Discarded packets |
| A | 0 | 13 | 0 |
| B | 0 | 13 | 0 |
| C | 0 | 13 | 0 |
| D | 0 | 13 | 0 |
| Mode M0 | |||
|---|---|---|---|
| Quadrant | BADHDUFLAG | Total packets | Discarded packets |
| A | 0 | 5880 | 0 |
| B | 0 | 6037 | 0 |
| C | 0 | 10180 | 0 |
| D | 0 | 7388 | 0 |
| Mode SS | |||
|---|---|---|---|
| Quadrant | BADHDUFLAG | Total packets | Discarded packets |
| A | 0 | 52 | 0 |
| B | 0 | 52 | 0 |
| C | 0 | 52 | 0 |
| D | 0 | 52 | 0 |
| Quadrant | Total seconds | Saturated seconds | Saturation percentage |
|---|---|---|---|
| A | 2550 | 49 | 1.921569% |
| B | 2550 | 71 | 2.784314% |
| C | 2550 | 390 | 15.294118% |
| D | 2550 | 115 | 4.509804% |
Noise dominated data is calculated using 1-second bins in cleaned event files. If a bin has >2000 counts, and if more than 50% of those come from <1% of pixels, then it is considered to be noise-dominated and hence unusable.
| Quadrant | # 1 sec bins | Bins with >0 counts | Bins with >2000 counts | High rate bins dominated by noise | Noise dominated (total time) | Noise dominated (detector-on time) | Marked lightcurve |
|---|---|---|---|---|---|---|---|
| A | 3810 | 2551 | 0 | 0 | 0.00% | 0.00% | 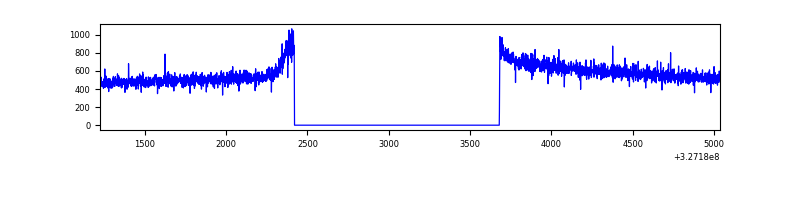 |
| B | 3810 | 2551 | 0 | 0 | 0.00% | 0.00% | 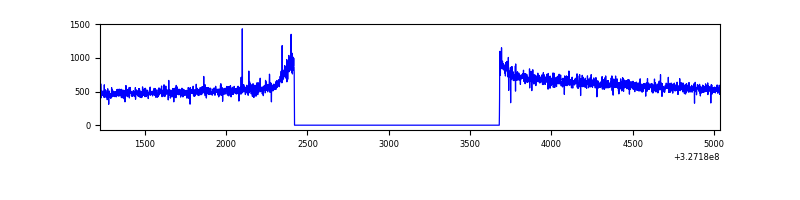 |
| C | 3810 | 2551 | 190 | 190 | 4.99% | 7.45% |  |
| D | 3810 | 2551 | 39 | 39 | 1.02% | 1.53% | 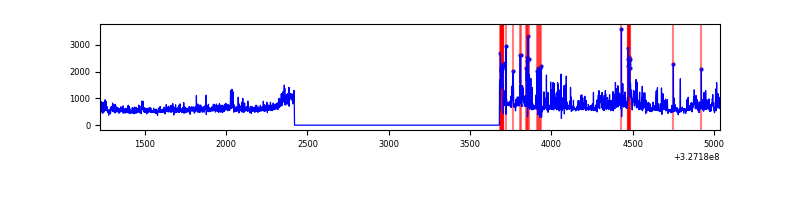 |
Top three noisy pixels from each quadrant. If the there are fewer than three noisy pixels in the level2.evt file, extra rows are filled as -1
| Pixel properties | Quadrant properties | ||||||
|---|---|---|---|---|---|---|---|
| Quadrant | DetID | PixID | Counts | Sigma | Mean | Median | Sigma |
| A | 13 | 254 | 3322 | 39.18 | 374 | 368 | 75.4 |
| A | 3 | 137 | 3288 | 38.72 | 374 | 368 | 75.4 |
| A | 0 | 226 | 3160 | 37.03 | 374 | 368 | 75.4 |
| B | 12 | 111 | 8385 | 111.79 | 373 | 365 | 71.7 |
| B | 11 | 111 | 7706 | 102.33 | 373 | 365 | 71.7 |
| B | 14 | 111 | 6808 | 89.81 | 373 | 365 | 71.7 |
| C | 7 | 247 | 1339754 | 16128.96 | 352 | 355 | 83.0 |
| C | 14 | 238 | 55921 | 669.12 | 352 | 355 | 83.0 |
| C | 0 | 239 | 12064 | 141.0 | 352 | 355 | 83.0 |
| D | 8 | 195 | 295016 | 3377.64 | 359 | 349 | 87.2 |
| D | 7 | 238 | 143749 | 1643.73 | 359 | 349 | 87.2 |
| D | 1 | 52 | 41687 | 473.84 | 359 | 349 | 87.2 |
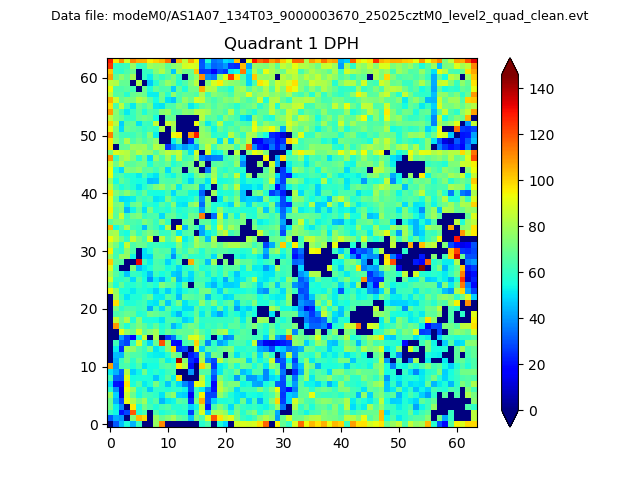
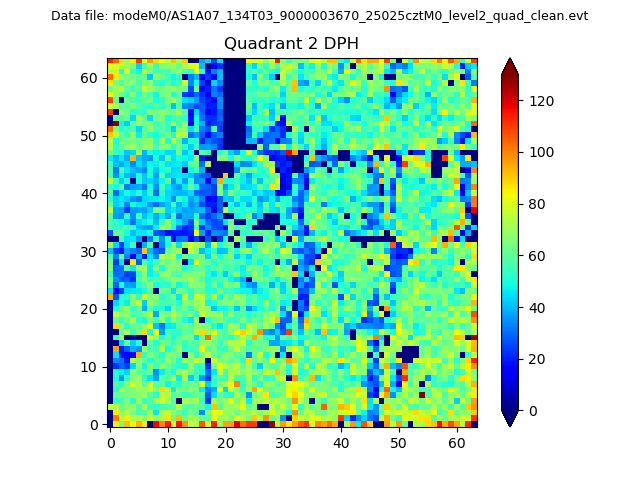
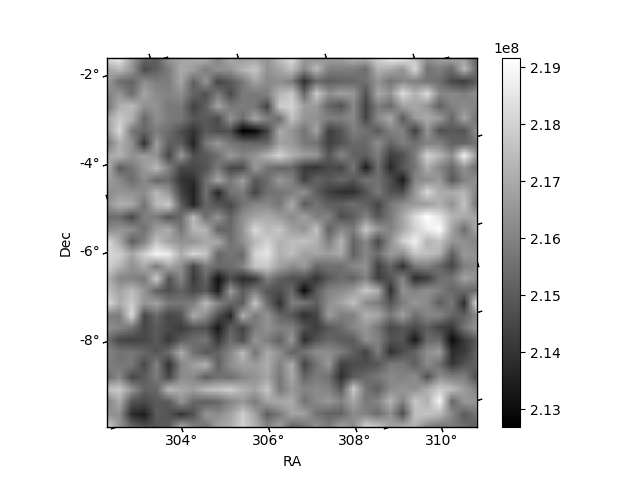
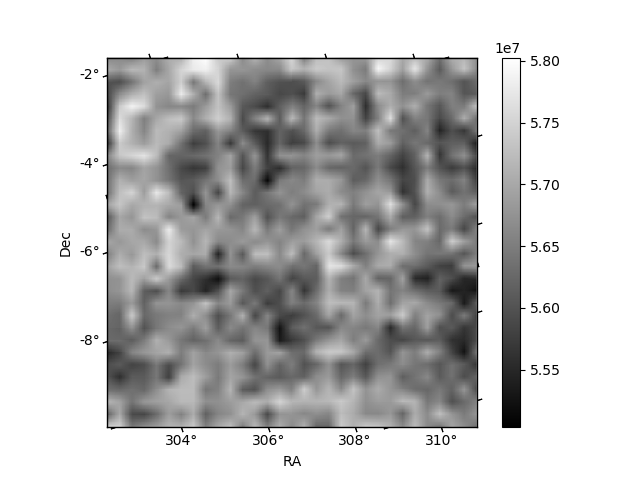
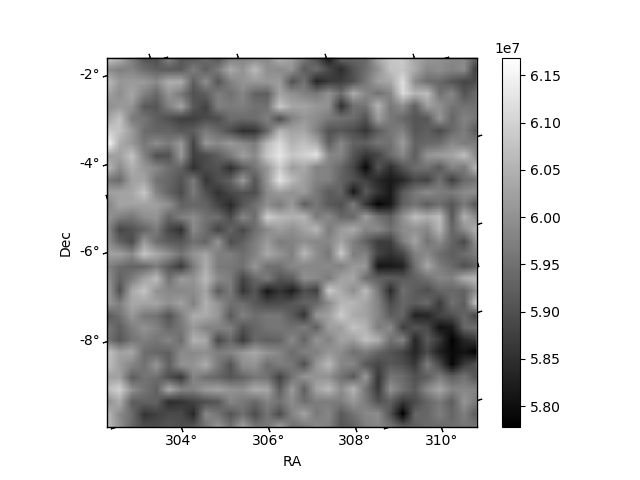
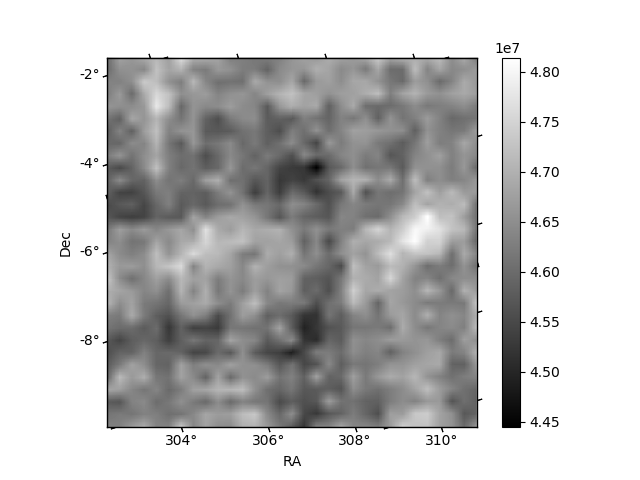
Histogram calculated using DETX and DETY for each event in the final _common_clean file
| Quadrant A | 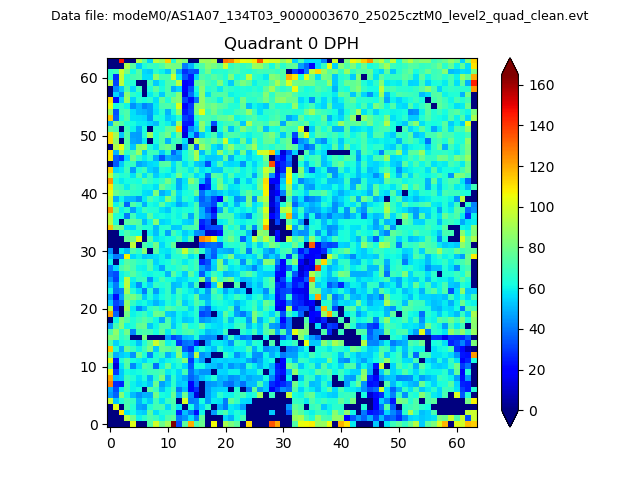 |
 |
Quadrant B |
|---|---|---|---|
| Quadrant D | 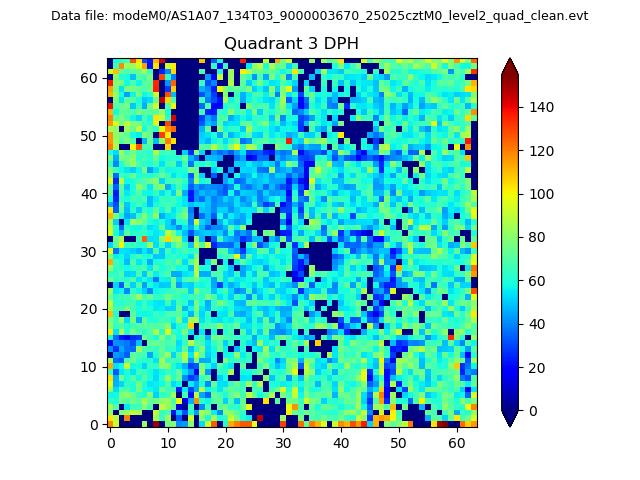 |
 |
Quadrant C |
| Plot type | Count rate plots | Images |
|---|---|---|
| Comparison with Poisson distribution Blue bars denote a histogram of data divided into 1 sec bins. Red curve is a Poisson curve with rate = median count rate of data. |
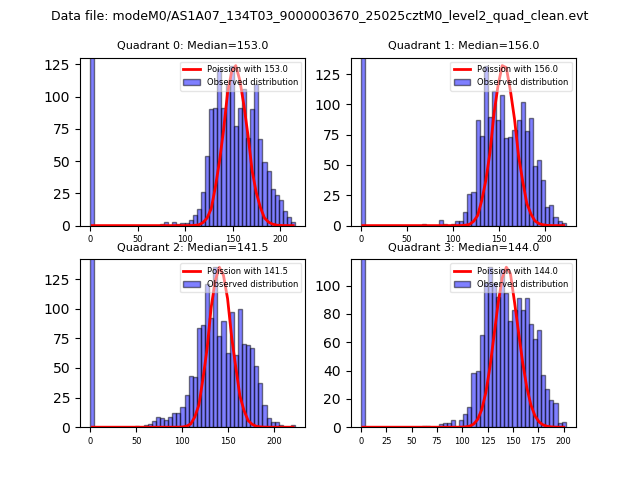 |
 |
| Quadrant-wise count rates Data is divided into 100 sec bins |
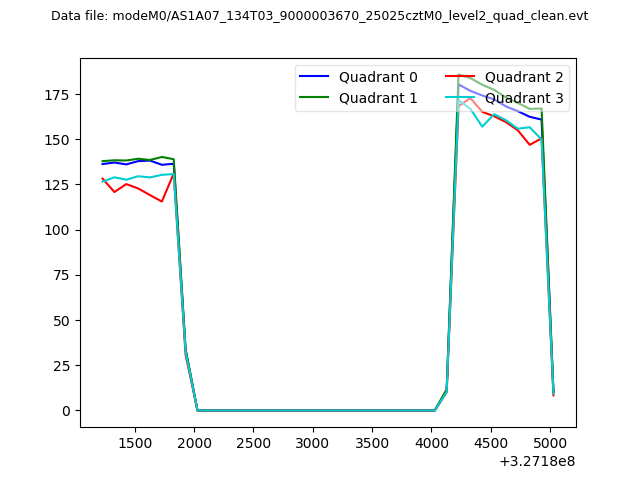 |
|
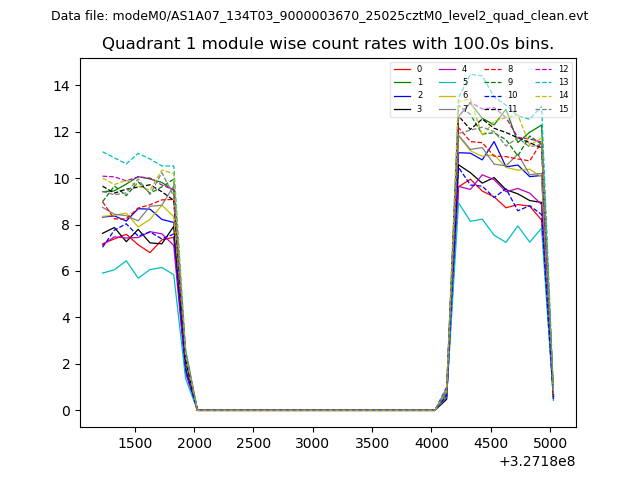
| Module-wise count rates for Quadrant A Data is divided into 100 sec bins |
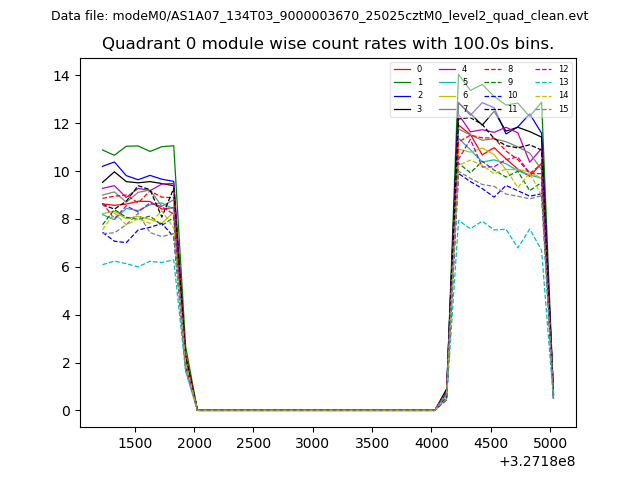 |
 |
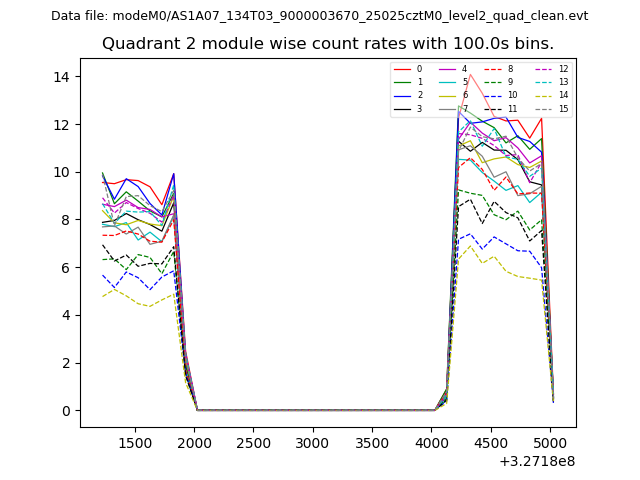
| Module-wise count rates for Quadrant B Data is divided into 100 sec bins |
 |
 |
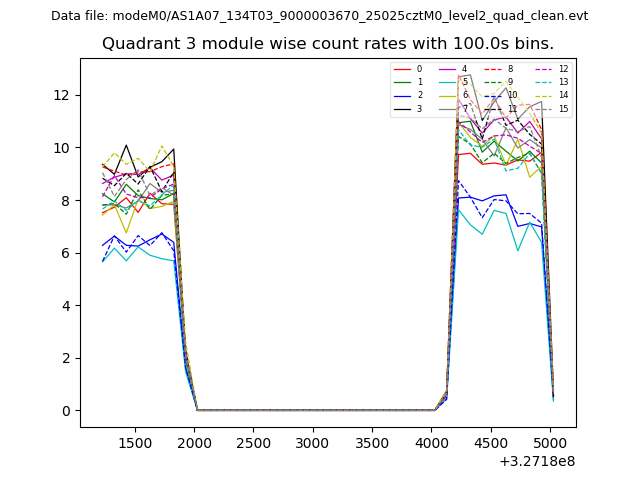
| Module-wise count rates for Quadrant C Data is divided into 100 sec bins |
 |
 |
| Module-wise count rates for Quadrant D Data is divided into 100 sec bins |
 |
 |
| Parameter | Plot |
|---|---|
| CZT HV Monitor | 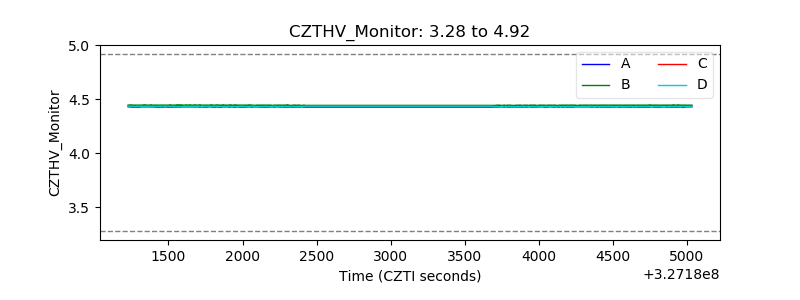 |
| D_VDD | 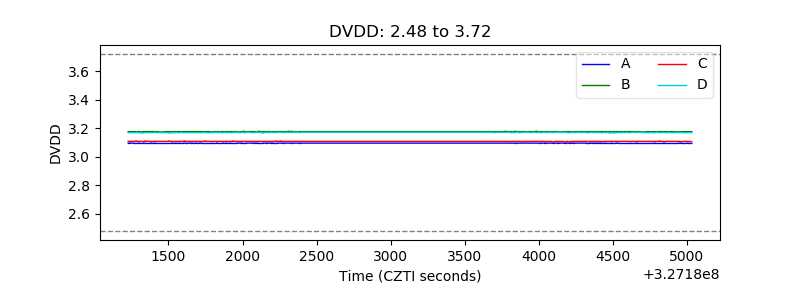 |
| Temperature 1 | 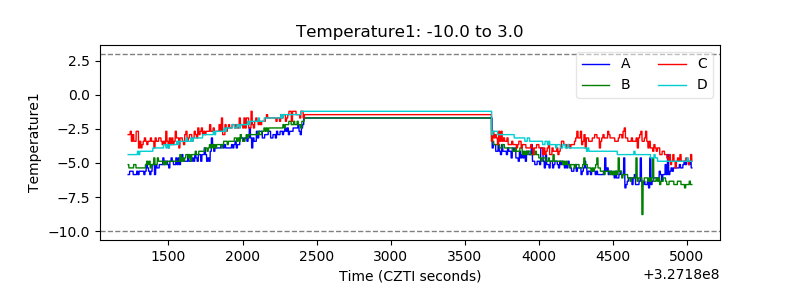 |
| Veto HV Monitor | 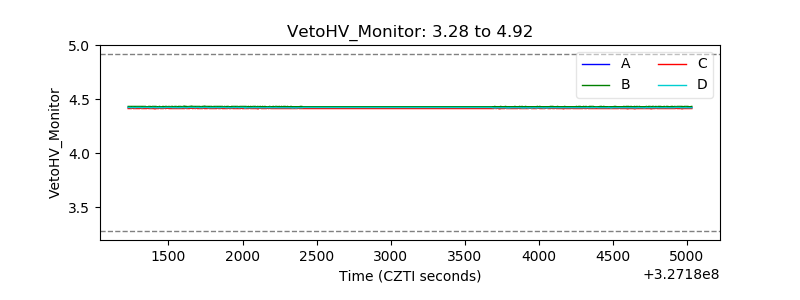 |
| Veto LLD | 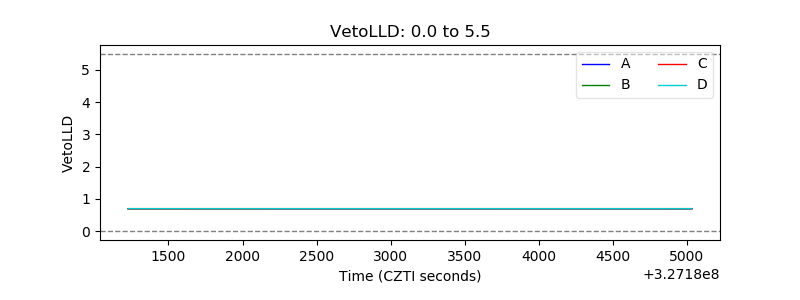 |
| Alpha Counter | 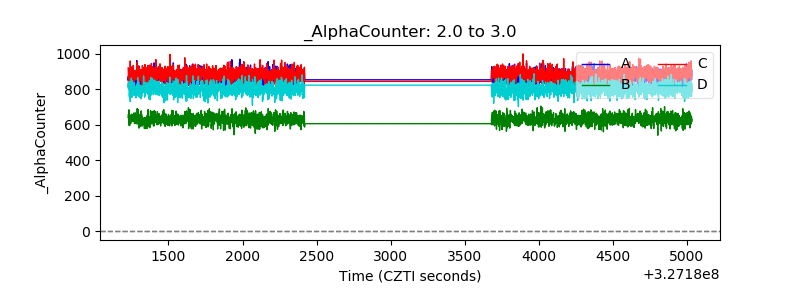 |
| _CPM_Rate | 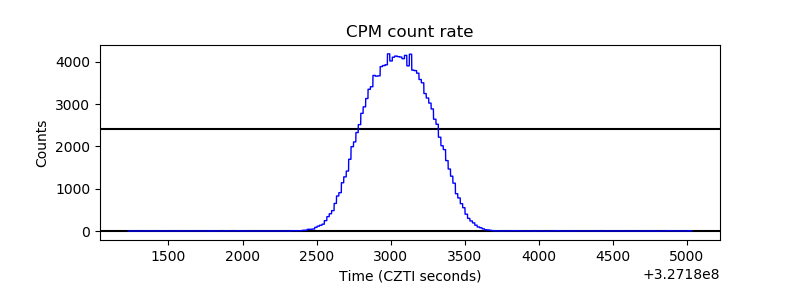 |
| CZT Counter | 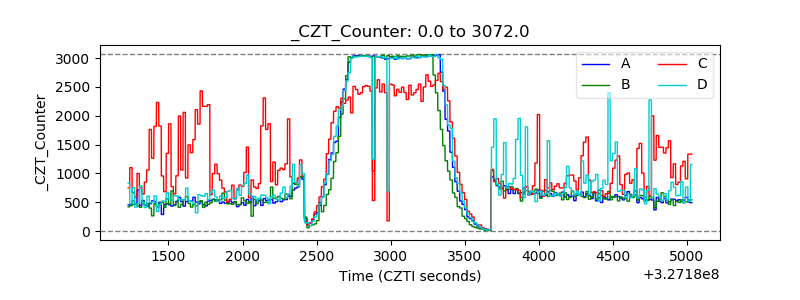 |
| +2.5 Volts monitor |  |
| +5 Volts monitor |  |
| _ROLL_ROT | 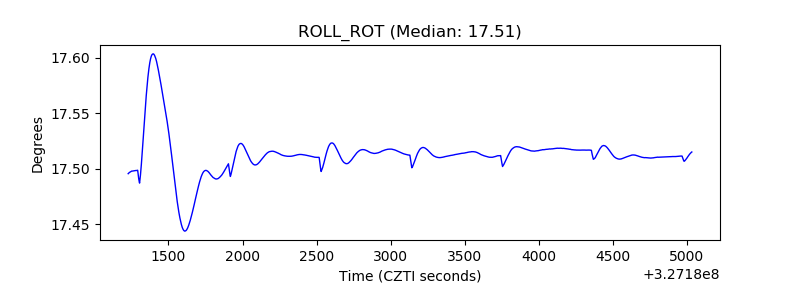 |
| _Roll_DEC | 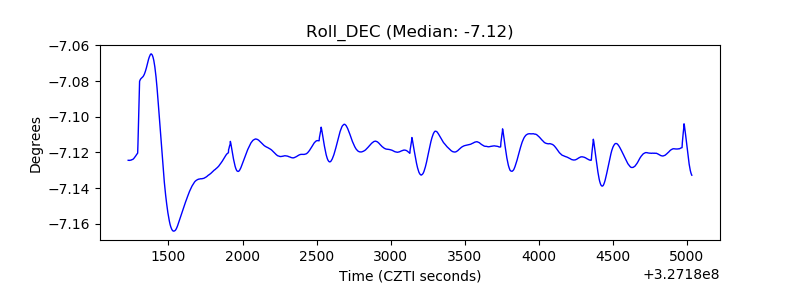 |
| _Roll_RA | 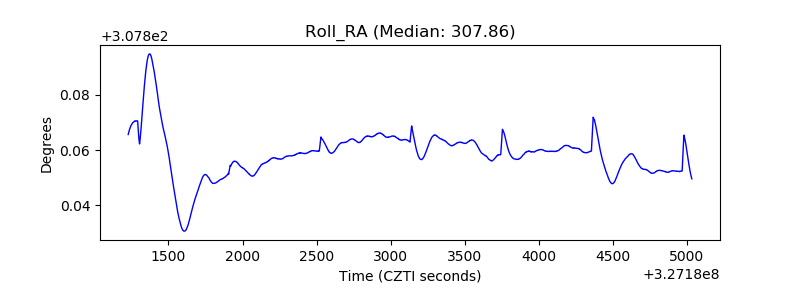 |
| Veto Counter | 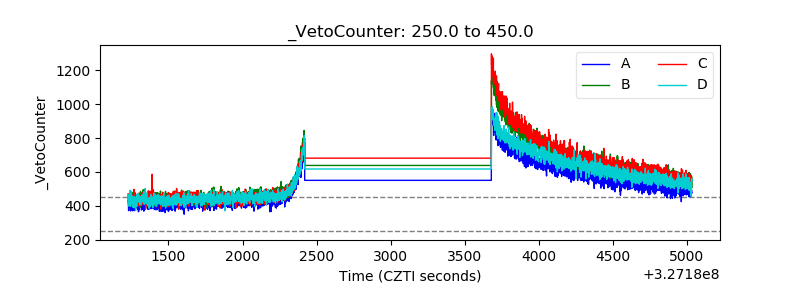 |