| Param | Original file | Final file |
|---|---|---|
| Filename | modeM0/AS1A07_134T03_9000003670_25026cztM0_level2.evt | modeM0/AS1A07_134T03_9000003670_25026cztM0_level2_quad_clean.evt |
| Size (bytes) | 589,749,120 | 109,077,120 |
| Size | 562.4 MB | 104.0 MB |
| Events in quadrant A | 3,311,705 | 731,315 |
| Events in quadrant B | 3,694,730 | 753,554 |
| Events in quadrant C | 5,866,328 | 696,249 |
| Events in quadrant D | 4,572,743 | 693,888 |
| Mode M9 | |||
|---|---|---|---|
| Quadrant | BADHDUFLAG | Total packets | Discarded packets |
| A | 0 | 16 | 0 |
| B | 0 | 17 | 0 |
| C | 0 | 17 | 0 |
| D | 0 | 17 | 0 |
| Mode M0 | |||
|---|---|---|---|
| Quadrant | BADHDUFLAG | Total packets | Discarded packets |
| A | 0 | 13673 | 1 |
| B | 0 | 15042 | 1 |
| C | 0 | 21934 | 1 |
| D | 0 | 17759 | 1 |
| Mode SS | |||
|---|---|---|---|
| Quadrant | BADHDUFLAG | Total packets | Discarded packets |
| A | 0 | 124 | 0 |
| B | 0 | 124 | 0 |
| C | 0 | 124 | 0 |
| D | 0 | 124 | 0 |
| Quadrant | Total seconds | Saturated seconds | Saturation percentage |
|---|---|---|---|
| A | 6140 | 54 | 0.879479% |
| B | 6140 | 95 | 1.547231% |
| C | 6140 | 586 | 9.543974% |
| D | 6140 | 261 | 4.250814% |
Noise dominated data is calculated using 1-second bins in cleaned event files. If a bin has >2000 counts, and if more than 50% of those come from <1% of pixels, then it is considered to be noise-dominated and hence unusable.
| Quadrant | # 1 sec bins | Bins with >0 counts | Bins with >2000 counts | High rate bins dominated by noise | Noise dominated (total time) | Noise dominated (detector-on time) | Marked lightcurve |
|---|---|---|---|---|---|---|---|
| A | 7490 | 6141 | 0 | 0 | 0.00% | 0.00% | 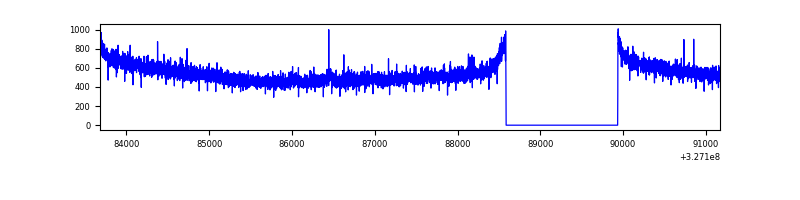 |
| B | 7490 | 6141 | 15 | 15 | 0.20% | 0.24% | 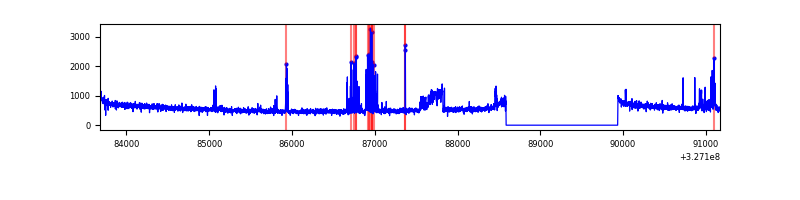 |
| C | 7490 | 6141 | 337 | 337 | 4.50% | 5.49% | 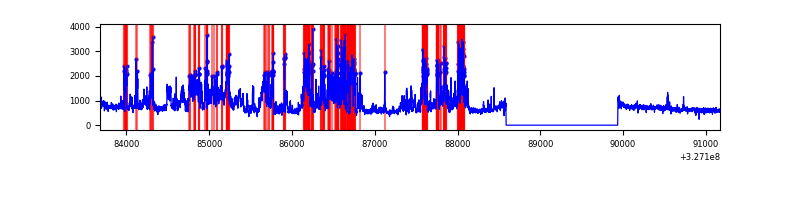 |
| D | 7490 | 6141 | 151 | 151 | 2.02% | 2.46% | 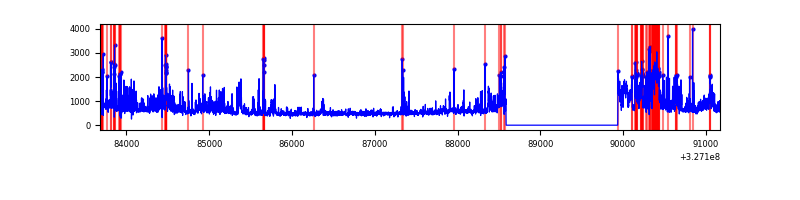 |
Top three noisy pixels from each quadrant. If the there are fewer than three noisy pixels in the level2.evt file, extra rows are filled as -1
| Pixel properties | Quadrant properties | ||||||
|---|---|---|---|---|---|---|---|
| Quadrant | DetID | PixID | Counts | Sigma | Mean | Median | Sigma |
| A | 11 | 208 | 15960 | 88.99 | 856 | 841 | 169.9 |
| A | 13 | 254 | 8301 | 43.91 | 856 | 841 | 169.9 |
| A | 3 | 137 | 7302 | 38.03 | 856 | 841 | 169.9 |
| B | 4 | 80 | 189017 | 1174.81 | 860 | 841 | 160.2 |
| B | 7 | 234 | 65084 | 401.08 | 860 | 841 | 160.2 |
| B | 7 | 250 | 39596 | 241.95 | 860 | 841 | 160.2 |
| C | 7 | 247 | 2501107 | 13153.32 | 823 | 834 | 190.1 |
| C | 14 | 238 | 130913 | 684.31 | 823 | 834 | 190.1 |
| C | 3 | 233 | 8968 | 42.79 | 823 | 834 | 190.1 |
| D | 1 | 52 | 788840 | 3923.38 | 833 | 812 | 200.9 |
| D | 8 | 195 | 414403 | 2059.16 | 833 | 812 | 200.9 |
| D | 7 | 238 | 162143 | 803.22 | 833 | 812 | 200.9 |
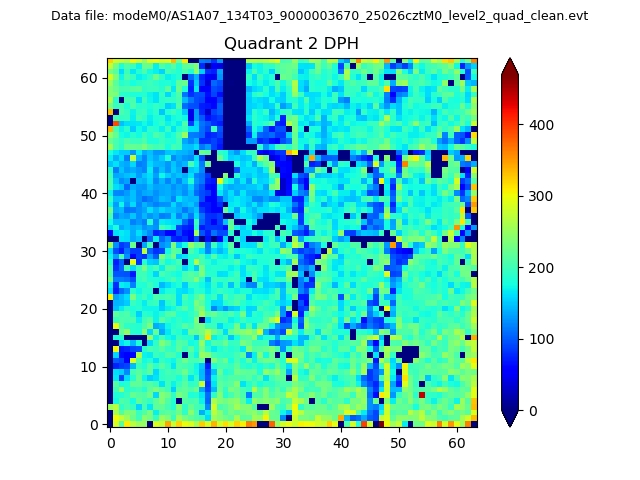
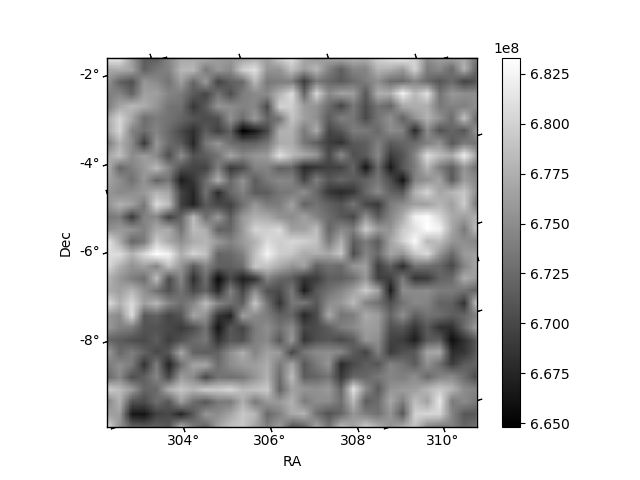
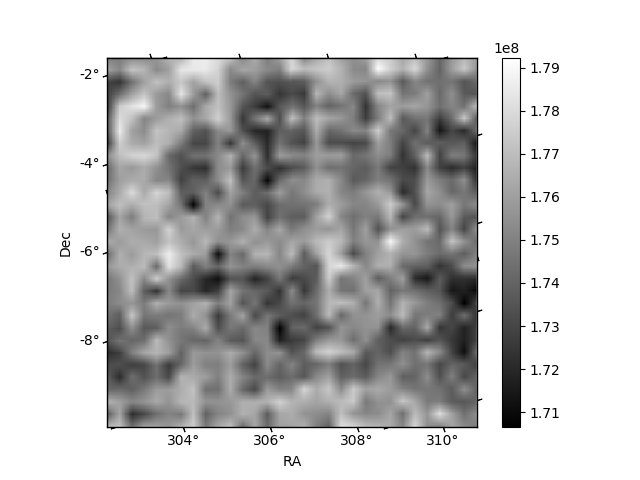
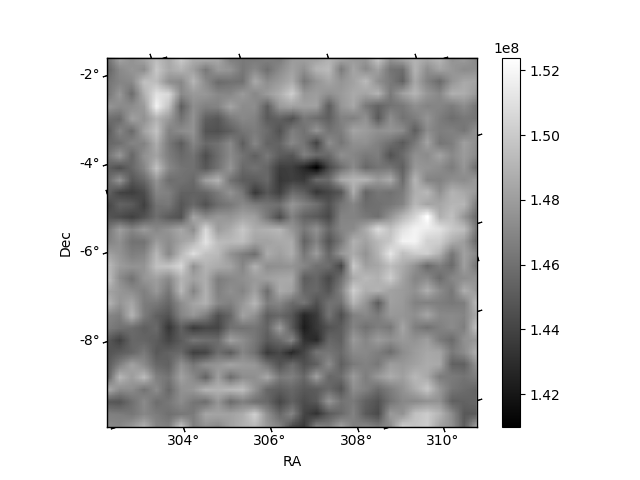
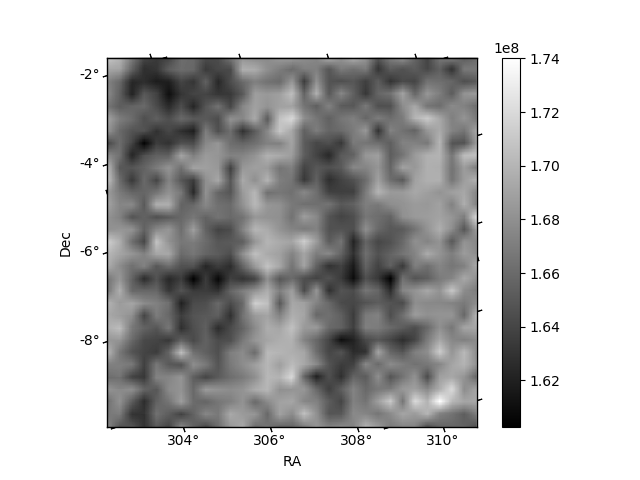
Histogram calculated using DETX and DETY for each event in the final _common_clean file
| Quadrant A | 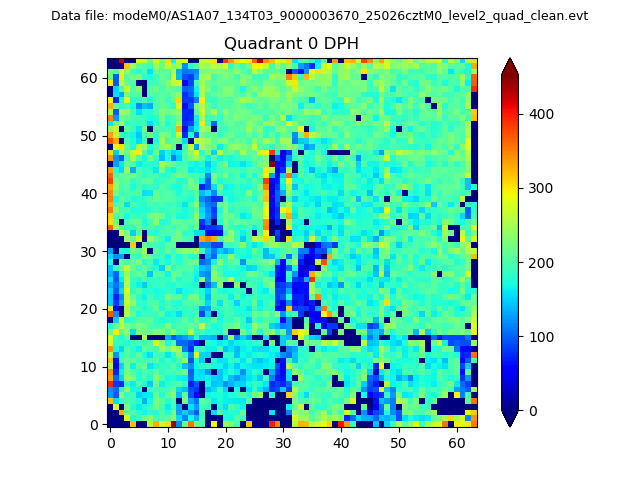 |
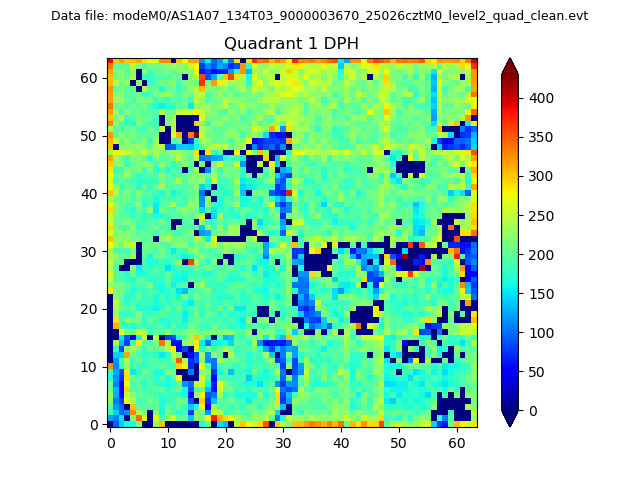 |
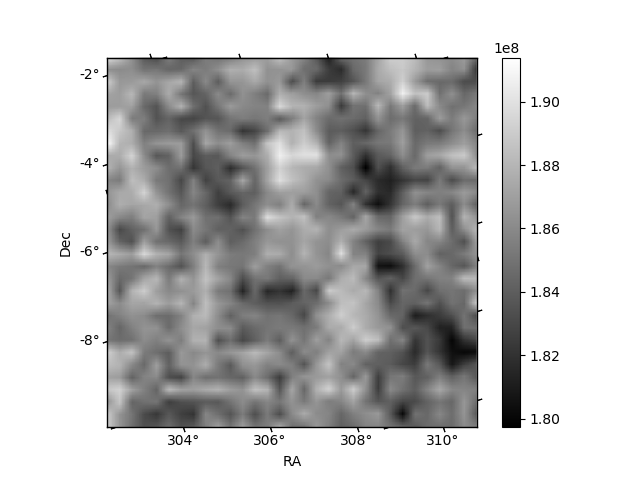
Quadrant B |
|---|---|---|---|
| Quadrant D | 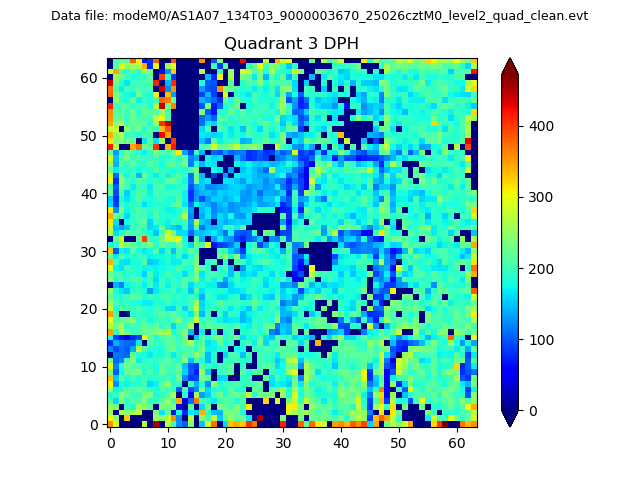 |
 |
Quadrant C |
| Plot type | Count rate plots | Images |
|---|---|---|
| Comparison with Poisson distribution Blue bars denote a histogram of data divided into 1 sec bins. Red curve is a Poisson curve with rate = median count rate of data. |
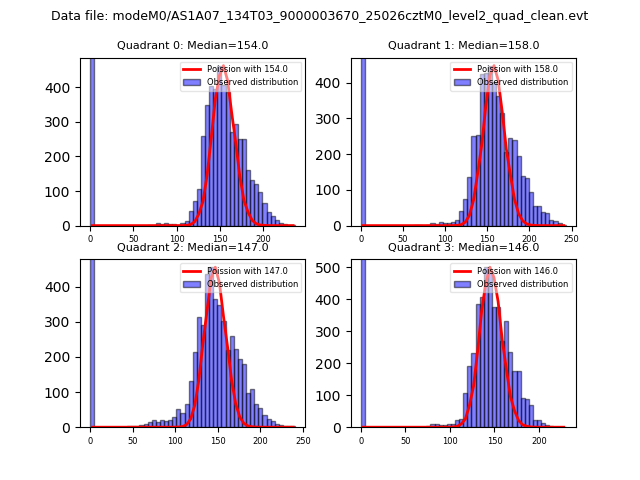 |
 |
| Quadrant-wise count rates Data is divided into 100 sec bins |
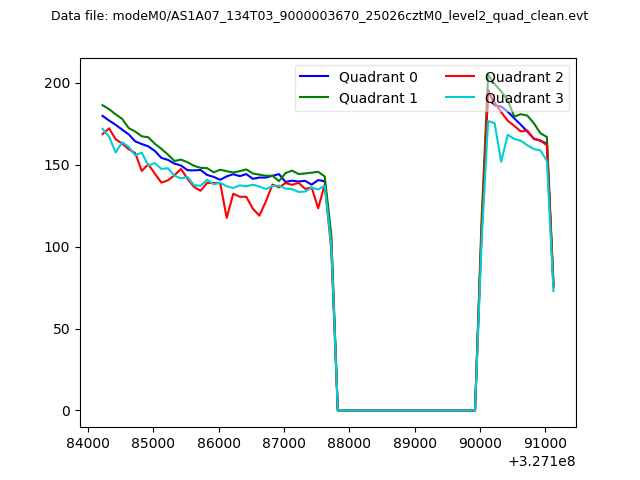 |
|
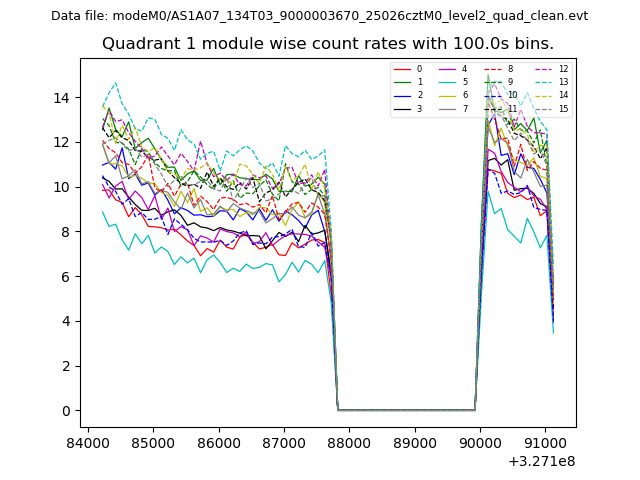
| Module-wise count rates for Quadrant A Data is divided into 100 sec bins |
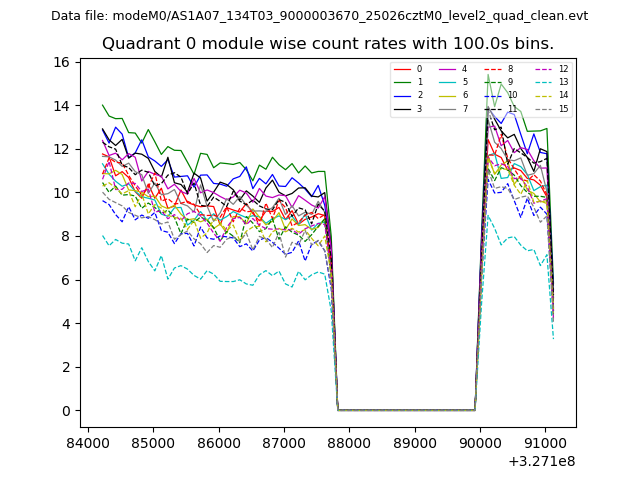 |
 |
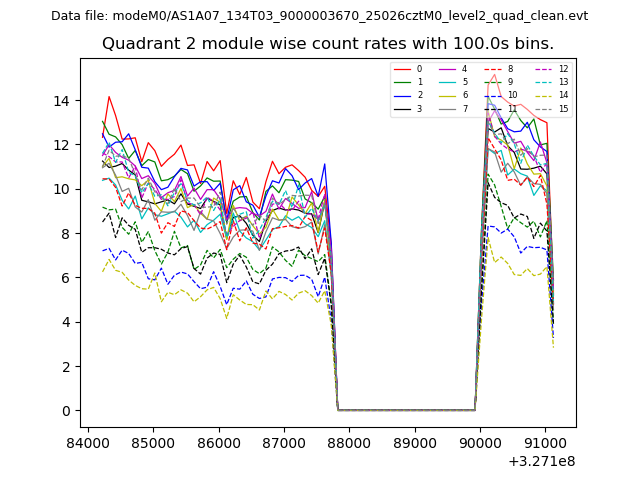
| Module-wise count rates for Quadrant B Data is divided into 100 sec bins |
 |
 |
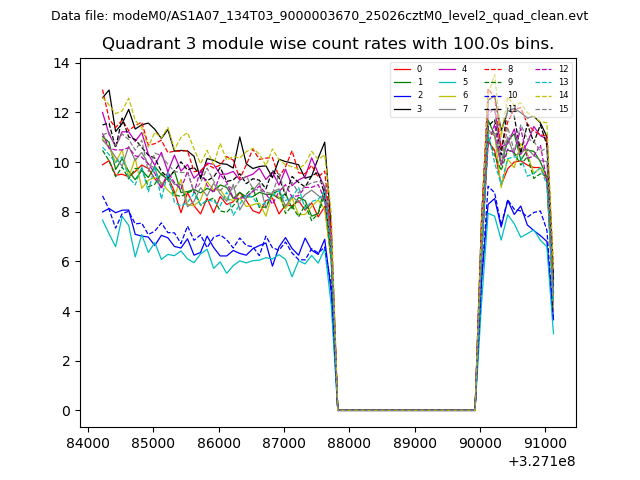
| Module-wise count rates for Quadrant C Data is divided into 100 sec bins |
 |
 |
| Module-wise count rates for Quadrant D Data is divided into 100 sec bins |
 |
 |
| Parameter | Plot |
|---|---|
| CZT HV Monitor | 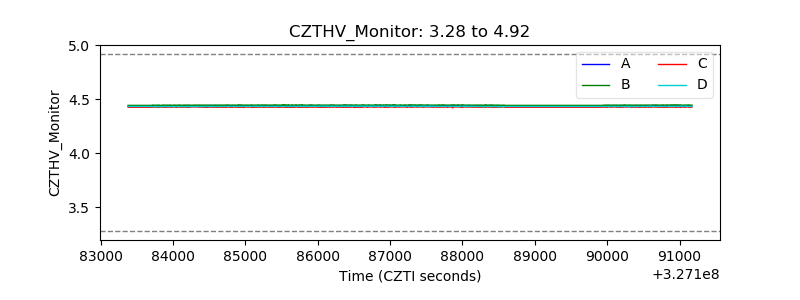 |
| D_VDD | 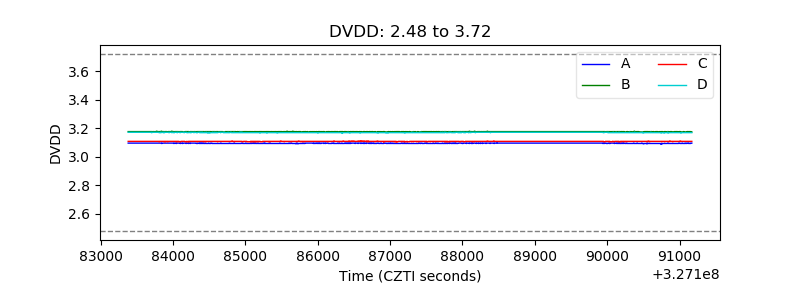 |
| Temperature 1 | 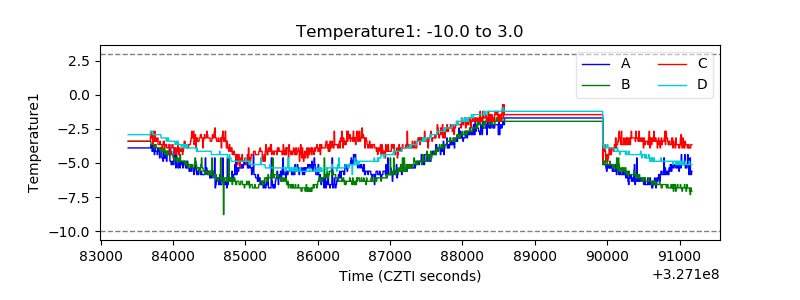 |
| Veto HV Monitor | 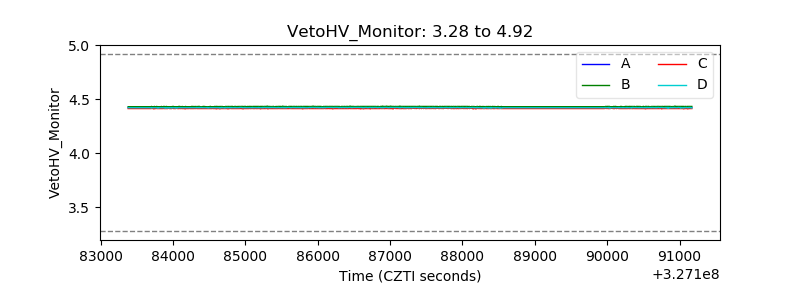 |
| Veto LLD | 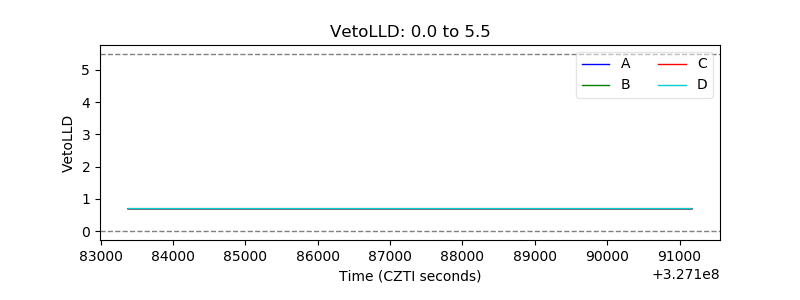 |
| Alpha Counter | 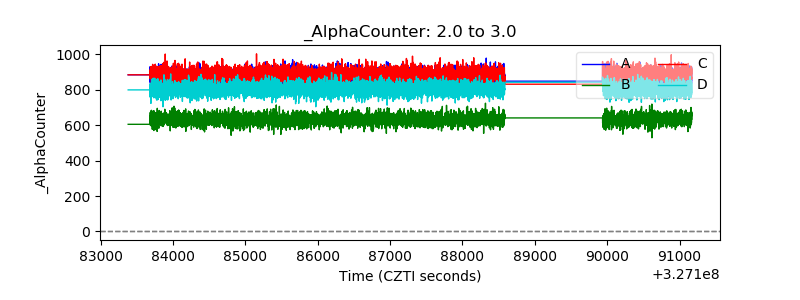 |
| _CPM_Rate | 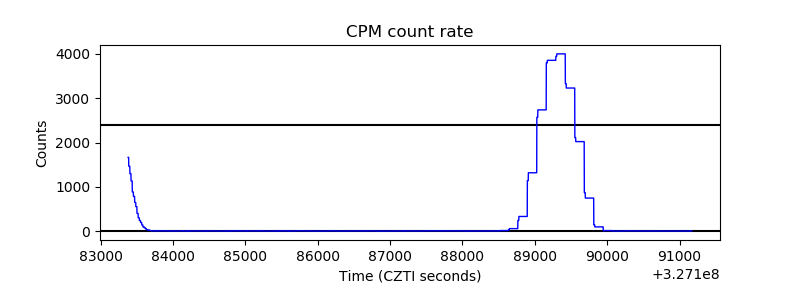 |
| CZT Counter | 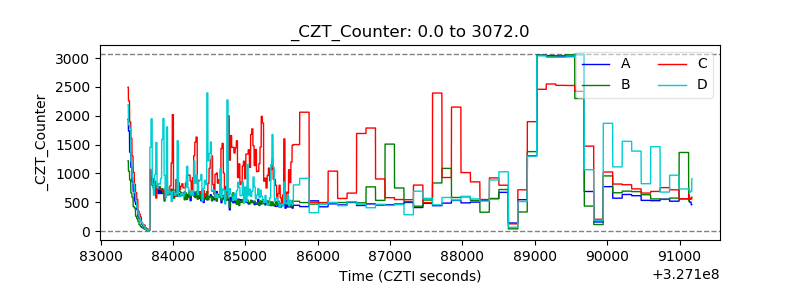 |
| +2.5 Volts monitor |  |
| +5 Volts monitor |  |
| _ROLL_ROT | 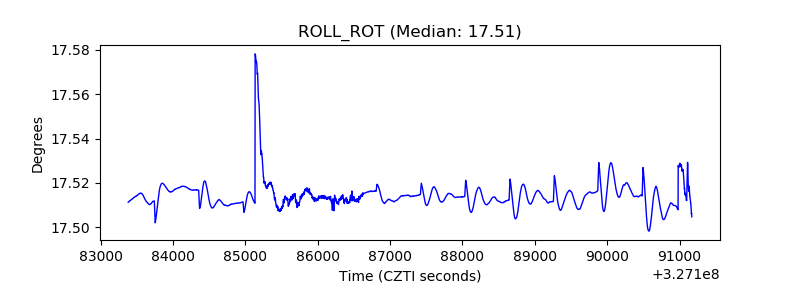 |
| _Roll_DEC | 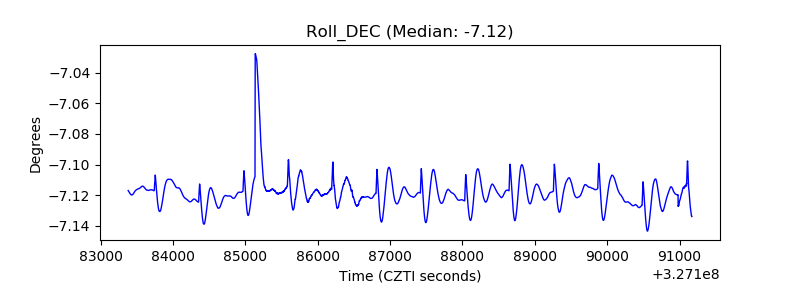 |
| _Roll_RA | 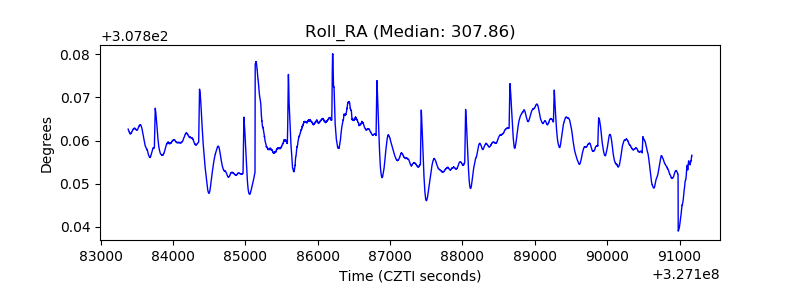 |
| Veto Counter | 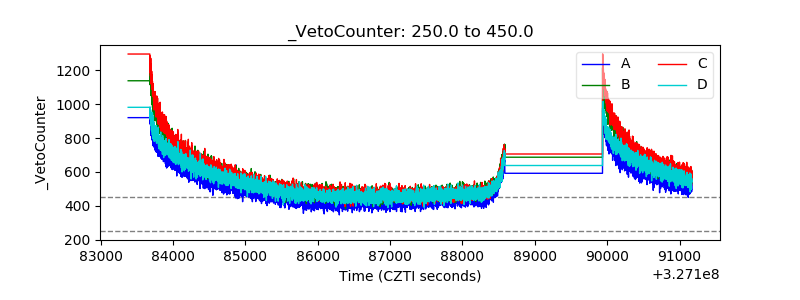 |