| Param | Original file | Final file |
|---|---|---|
| Filename | modeM0/AS1A07_134T03_9000003670_25027cztM0_level2.evt | modeM0/AS1A07_134T03_9000003670_25027cztM0_level2_quad_clean.evt |
| Size (bytes) | 529,087,680 | 114,624,000 |
| Size | 504.6 MB | 109.3 MB |
| Events in quadrant A | 3,227,570 | 764,872 |
| Events in quadrant B | 3,599,066 | 792,551 |
| Events in quadrant C | 3,796,595 | 759,046 |
| Events in quadrant D | 4,986,721 | 728,922 |
| Mode M9 | |||
|---|---|---|---|
| Quadrant | BADHDUFLAG | Total packets | Discarded packets |
| A | 0 | 20 | 0 |
| B | 0 | 21 | 0 |
| C | 0 | 21 | 0 |
| D | 0 | 21 | 0 |
| Mode M0 | |||
|---|---|---|---|
| Quadrant | BADHDUFLAG | Total packets | Discarded packets |
| A | 0 | 13250 | 2 |
| B | 0 | 14703 | 4 |
| C | 0 | 15265 | 2 |
| D | 0 | 18848 | 2 |
| Mode SS | |||
|---|---|---|---|
| Quadrant | BADHDUFLAG | Total packets | Discarded packets |
| A | 0 | 124 | 0 |
| B | 0 | 124 | 0 |
| C | 0 | 124 | 0 |
| D | 0 | 124 | 0 |
| Quadrant | Total seconds | Saturated seconds | Saturation percentage |
|---|---|---|---|
| A | 6097 | 27 | 0.442841% |
| B | 6096 | 75 | 1.230315% |
| C | 6096 | 139 | 2.280184% |
| D | 6096 | 386 | 6.332021% |
Noise dominated data is calculated using 1-second bins in cleaned event files. If a bin has >2000 counts, and if more than 50% of those come from <1% of pixels, then it is considered to be noise-dominated and hence unusable.
| Quadrant | # 1 sec bins | Bins with >0 counts | Bins with >2000 counts | High rate bins dominated by noise | Noise dominated (total time) | Noise dominated (detector-on time) | Marked lightcurve |
|---|---|---|---|---|---|---|---|
| A | 7492 | 6098 | 0 | 0 | 0.00% | 0.00% | 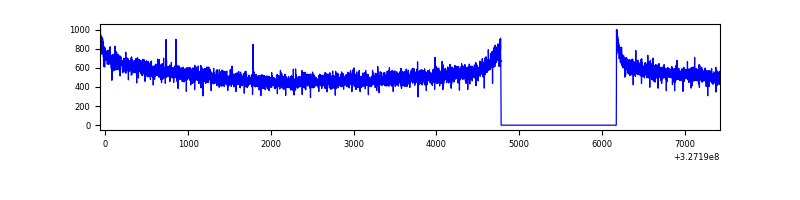 |
| B | 7491 | 6097 | 12 | 12 | 0.16% | 0.20% | 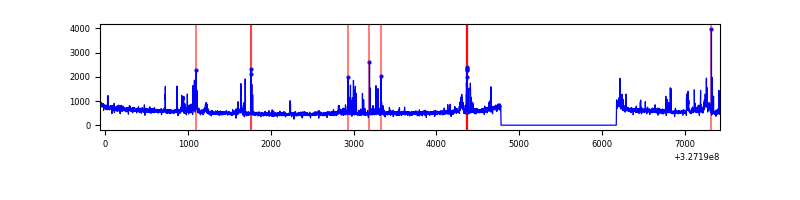 |
| C | 7491 | 6097 | 22 | 22 | 0.29% | 0.36% | 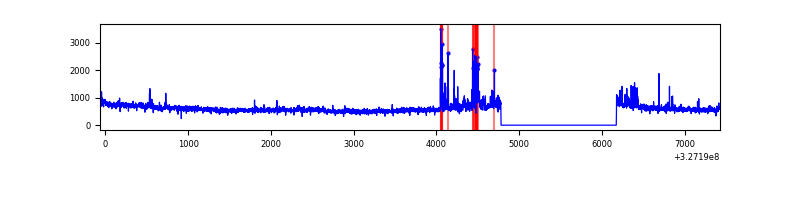 |
| D | 7491 | 6097 | 243 | 243 | 3.24% | 3.99% | 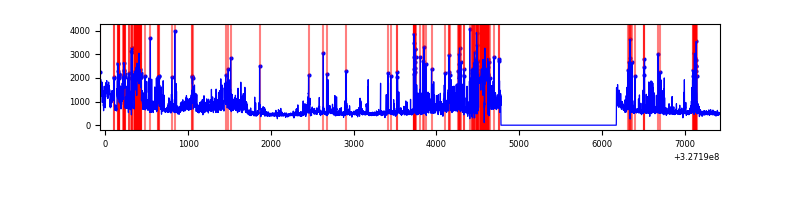 |
Top three noisy pixels from each quadrant. If the there are fewer than three noisy pixels in the level2.evt file, extra rows are filled as -1
| Pixel properties | Quadrant properties | ||||||
|---|---|---|---|---|---|---|---|
| Quadrant | DetID | PixID | Counts | Sigma | Mean | Median | Sigma |
| A | 11 | 208 | 17457 | 100.06 | 833 | 818 | 166.3 |
| A | 13 | 254 | 8646 | 47.07 | 833 | 818 | 166.3 |
| A | 0 | 226 | 7044 | 37.44 | 833 | 818 | 166.3 |
| B | 3 | 64 | 176387 | 1129.98 | 839 | 822 | 155.4 |
| B | 4 | 80 | 89987 | 573.89 | 839 | 822 | 155.4 |
| B | 5 | 172 | 25620 | 159.61 | 839 | 822 | 155.4 |
| C | 7 | 247 | 227598 | 1180.68 | 821 | 830 | 192.1 |
| C | 2 | 16 | 153369 | 794.2 | 821 | 830 | 192.1 |
| C | 14 | 238 | 130452 | 674.88 | 821 | 830 | 192.1 |
| D | 1 | 52 | 1169281 | 6047.98 | 802 | 782 | 193.2 |
| D | 8 | 195 | 495514 | 2560.66 | 802 | 782 | 193.2 |
| D | 7 | 238 | 296329 | 1529.71 | 802 | 782 | 193.2 |
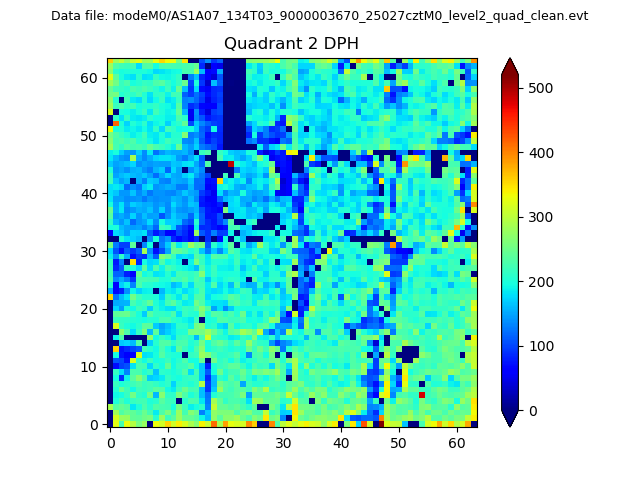
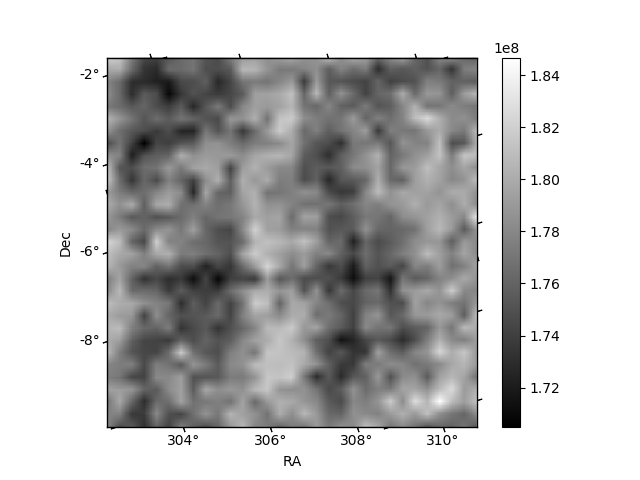
Histogram calculated using DETX and DETY for each event in the final _common_clean file
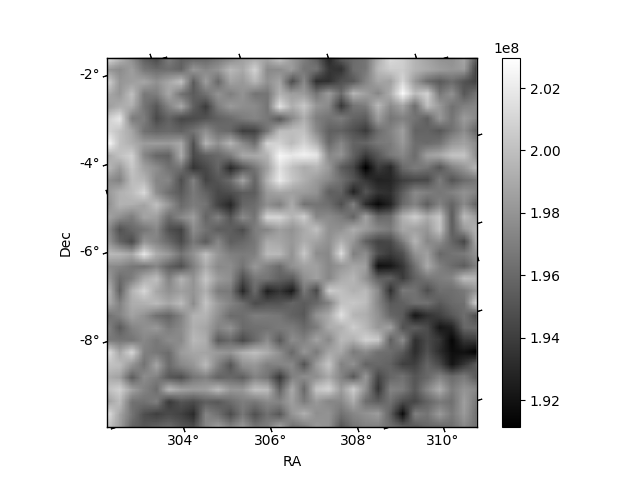
| Quadrant A | 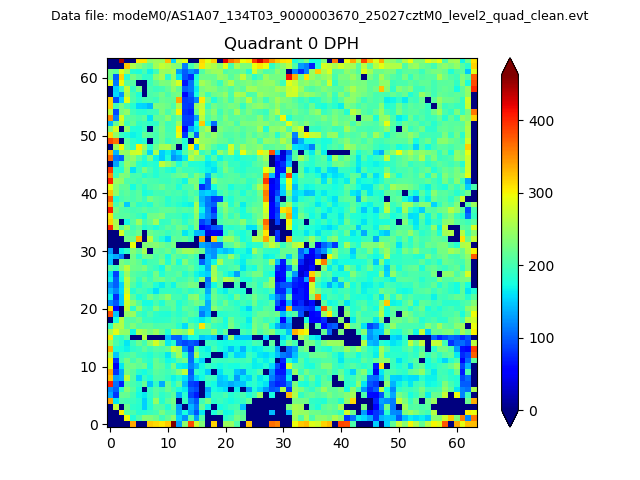 |
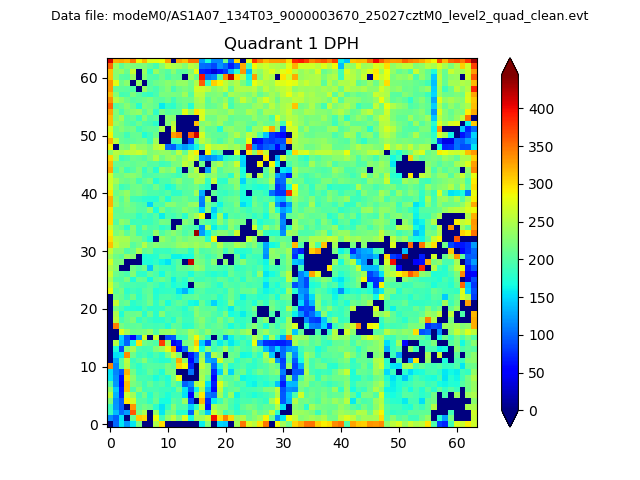 |
Quadrant B |
|---|---|---|---|
| Quadrant D | 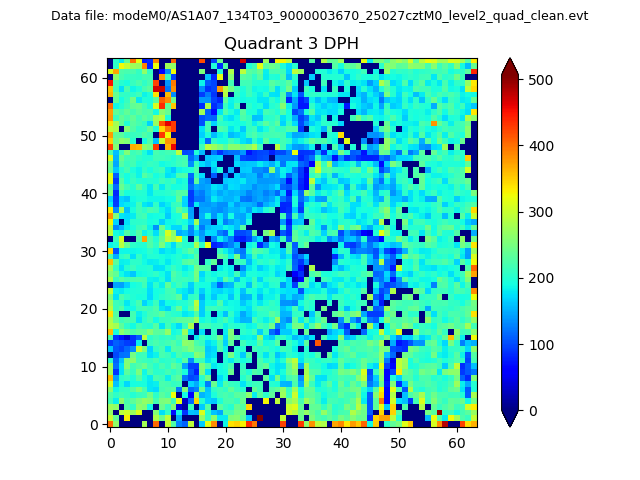 |
 |
Quadrant C |
| Plot type | Count rate plots | Images |
|---|---|---|
| Comparison with Poisson distribution Blue bars denote a histogram of data divided into 1 sec bins. Red curve is a Poisson curve with rate = median count rate of data. |
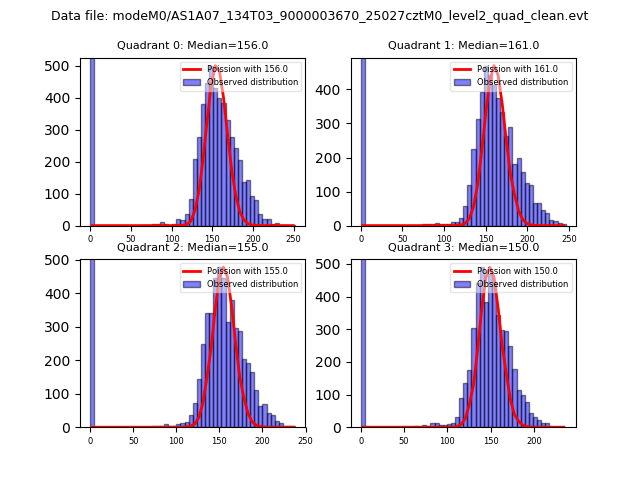 |
 |
| Quadrant-wise count rates Data is divided into 100 sec bins |
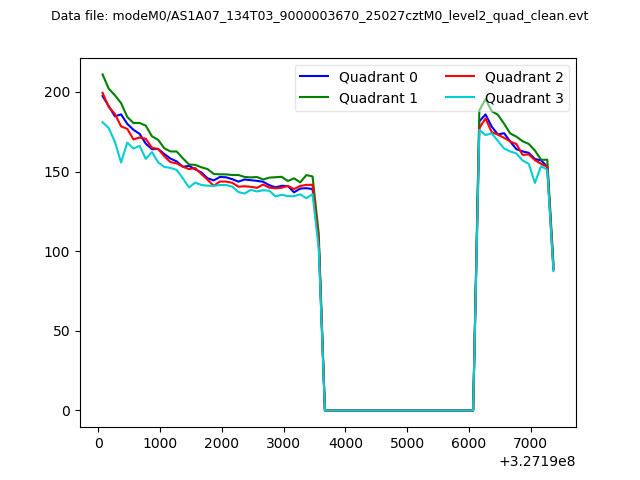 |
|
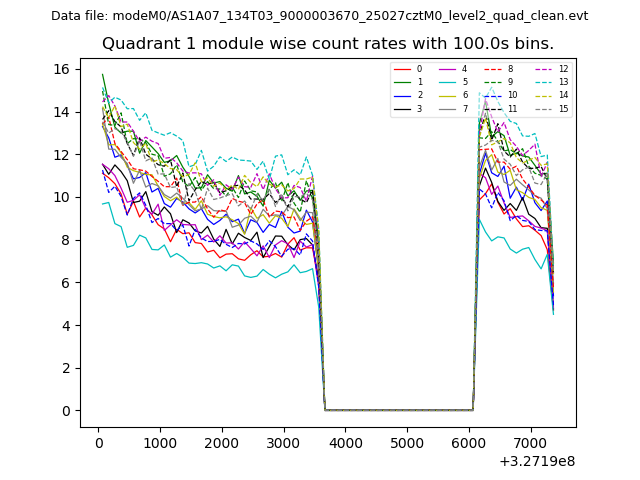
| Module-wise count rates for Quadrant A Data is divided into 100 sec bins |
 |
 |
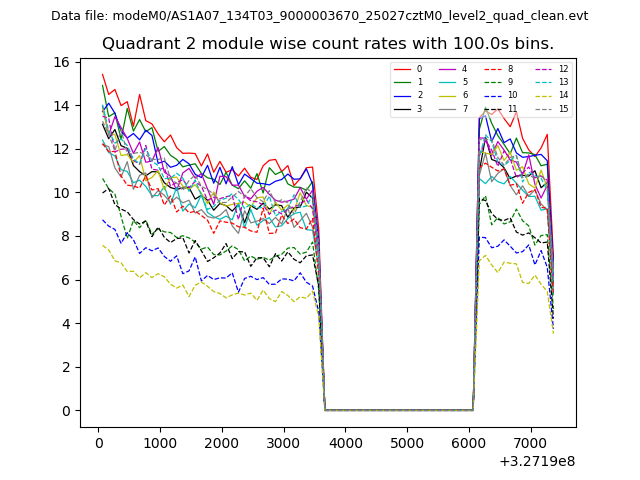
| Module-wise count rates for Quadrant B Data is divided into 100 sec bins |
 |
 |
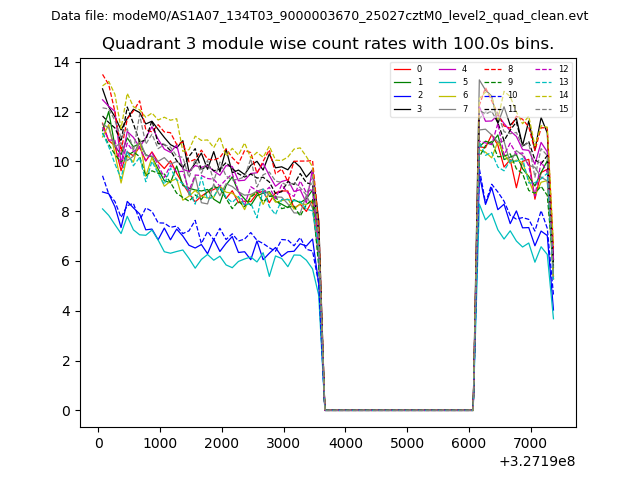
| Module-wise count rates for Quadrant C Data is divided into 100 sec bins |
 |
 |
| Module-wise count rates for Quadrant D Data is divided into 100 sec bins |
 |
 |
| Parameter | Plot |
|---|---|
| CZT HV Monitor | 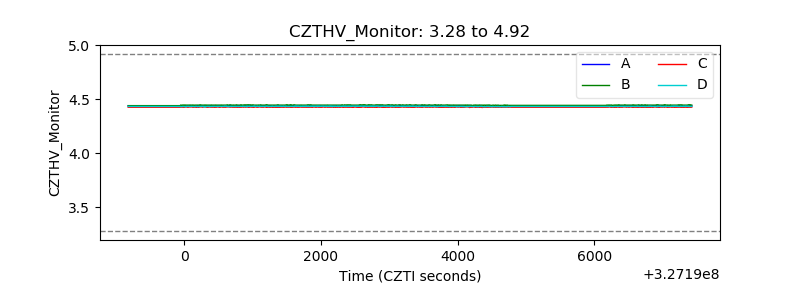 |
| D_VDD |  |
| Temperature 1 | 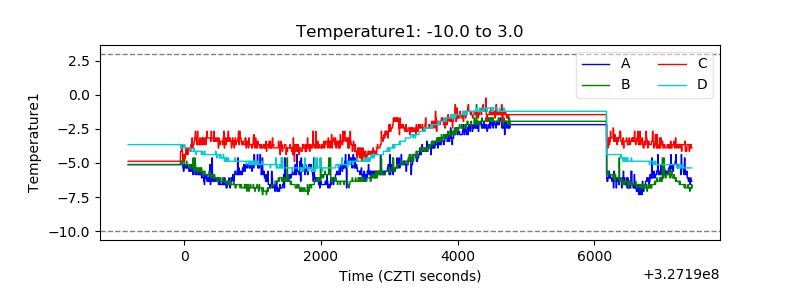 |
| Veto HV Monitor | 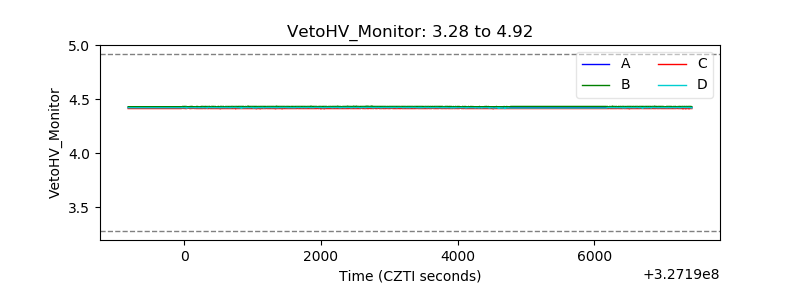 |
| Veto LLD | 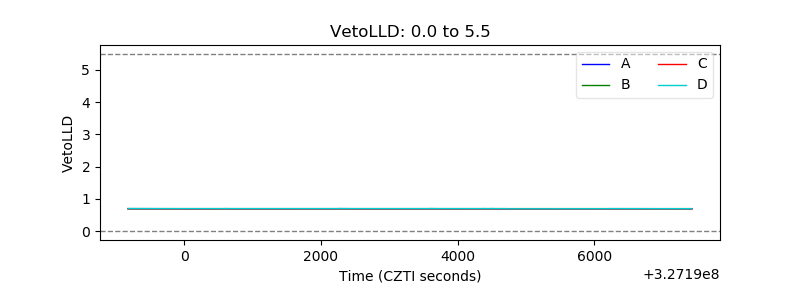 |
| Alpha Counter | 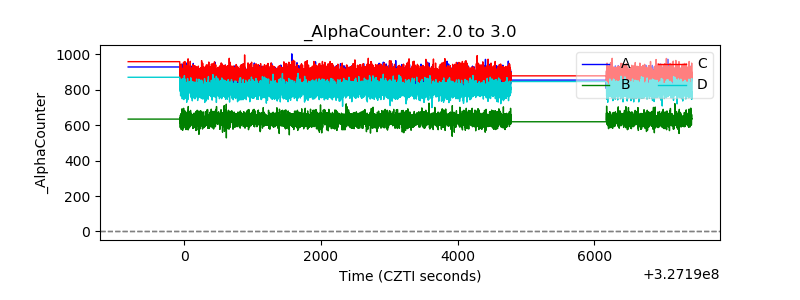 |
| _CPM_Rate | 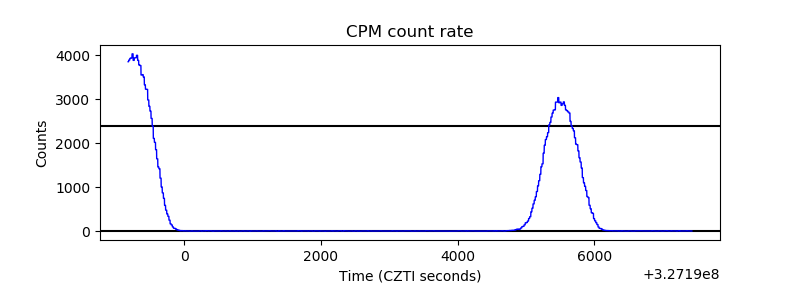 |
| CZT Counter | 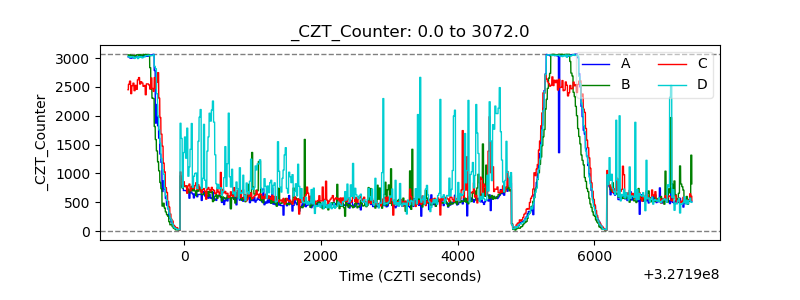 |
| +2.5 Volts monitor |  |
| +5 Volts monitor |  |
| _ROLL_ROT | 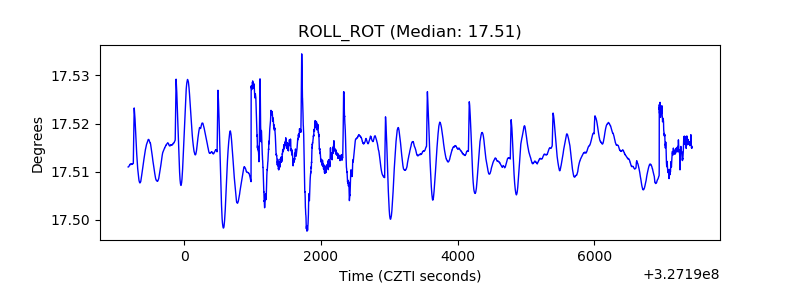 |
| _Roll_DEC | 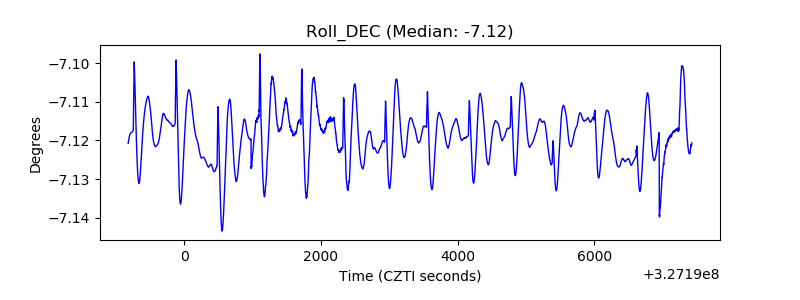 |
| _Roll_RA | 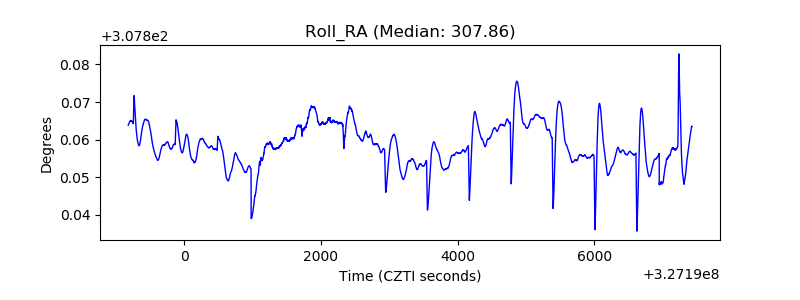 |
| Veto Counter | 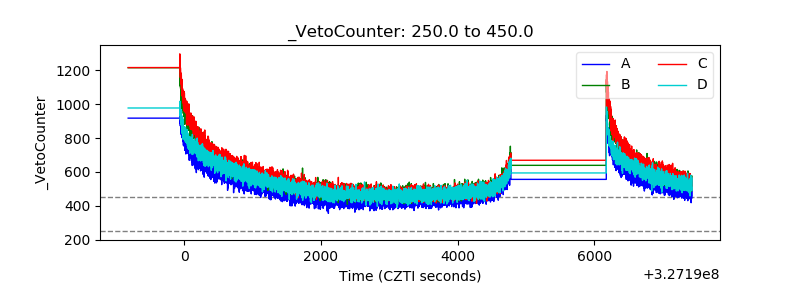 |