| Param | Original file | Final file |
|---|---|---|
| Filename | modeM0/AS1A07_134T03_9000003670_25028cztM0_level2.evt | modeM0/AS1A07_134T03_9000003670_25028cztM0_level2_quad_clean.evt |
| Size (bytes) | 477,221,760 | 104,500,800 |
| Size | 455.1 MB | 99.7 MB |
| Events in quadrant A | 3,128,589 | 687,746 |
| Events in quadrant B | 3,468,775 | 710,792 |
| Events in quadrant C | 3,569,486 | 678,509 |
| Events in quadrant D | 3,871,729 | 661,912 |
| Mode M9 | |||
|---|---|---|---|
| Quadrant | BADHDUFLAG | Total packets | Discarded packets |
| A | 0 | 17 | 0 |
| B | 0 | 18 | 0 |
| C | 0 | 18 | 0 |
| D | 0 | 18 | 0 |
| Mode M0 | |||
|---|---|---|---|
| Quadrant | BADHDUFLAG | Total packets | Discarded packets |
| A | 0 | 12953 | 2 |
| B | 0 | 14159 | 2 |
| C | 0 | 14416 | 2 |
| D | 0 | 15219 | 2 |
| Mode SS | |||
|---|---|---|---|
| Quadrant | BADHDUFLAG | Total packets | Discarded packets |
| A | 0 | 124 | 0 |
| B | 0 | 124 | 0 |
| C | 0 | 124 | 0 |
| D | 0 | 124 | 0 |
| Quadrant | Total seconds | Saturated seconds | Saturation percentage |
|---|---|---|---|
| A | 6101 | 42 | 0.688412% |
| B | 6101 | 64 | 1.049008% |
| C | 6101 | 126 | 2.065235% |
| D | 6101 | 185 | 3.032290% |
Noise dominated data is calculated using 1-second bins in cleaned event files. If a bin has >2000 counts, and if more than 50% of those come from <1% of pixels, then it is considered to be noise-dominated and hence unusable.
| Quadrant | # 1 sec bins | Bins with >0 counts | Bins with >2000 counts | High rate bins dominated by noise | Noise dominated (total time) | Noise dominated (detector-on time) | Marked lightcurve |
|---|---|---|---|---|---|---|---|
| A | 7431 | 6102 | 0 | 0 | 0.00% | 0.00% | 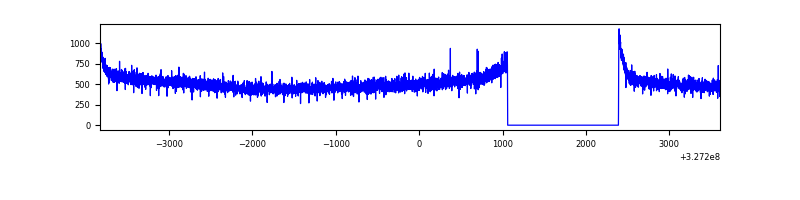 |
| B | 7431 | 6102 | 5 | 5 | 0.07% | 0.08% | 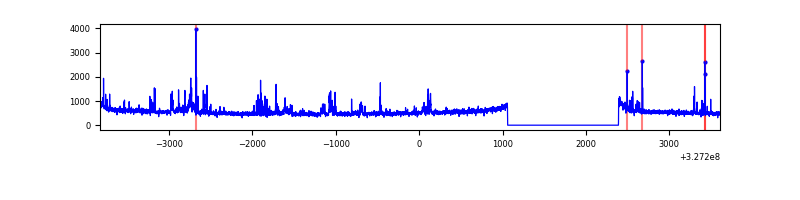 |
| C | 7431 | 6102 | 12 | 12 | 0.16% | 0.20% | 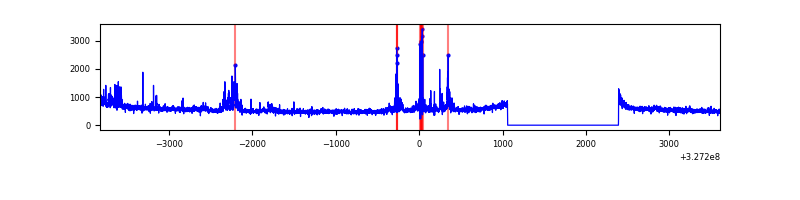 |
| D | 7431 | 6102 | 129 | 129 | 1.74% | 2.11% | 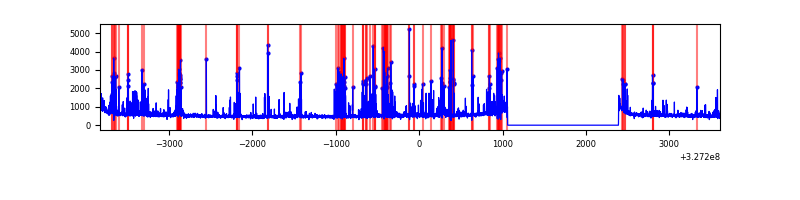 |
Top three noisy pixels from each quadrant. If the there are fewer than three noisy pixels in the level2.evt file, extra rows are filled as -1
| Pixel properties | Quadrant properties | ||||||
|---|---|---|---|---|---|---|---|
| Quadrant | DetID | PixID | Counts | Sigma | Mean | Median | Sigma |
| A | 11 | 208 | 9986 | 56.47 | 810 | 793 | 162.8 |
| A | 13 | 254 | 7780 | 42.92 | 810 | 793 | 162.8 |
| A | 3 | 137 | 6904 | 37.54 | 810 | 793 | 162.8 |
| B | 3 | 64 | 194360 | 1273.9 | 813 | 796 | 151.9 |
| B | 4 | 80 | 58903 | 382.42 | 813 | 796 | 151.9 |
| B | 0 | 190 | 28380 | 181.54 | 813 | 796 | 151.9 |
| C | 0 | 239 | 210616 | 1128.66 | 793 | 804 | 185.9 |
| C | 14 | 238 | 128041 | 684.46 | 793 | 804 | 185.9 |
| C | 7 | 247 | 119063 | 636.16 | 793 | 804 | 185.9 |
| D | 1 | 52 | 699350 | 3688.62 | 791 | 770 | 189.4 |
| D | 8 | 195 | 83746 | 438.13 | 791 | 770 | 189.4 |
| D | 7 | 238 | 71534 | 373.65 | 791 | 770 | 189.4 |
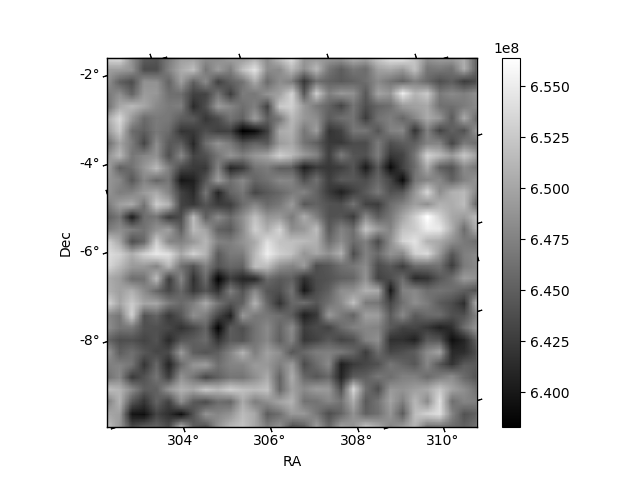
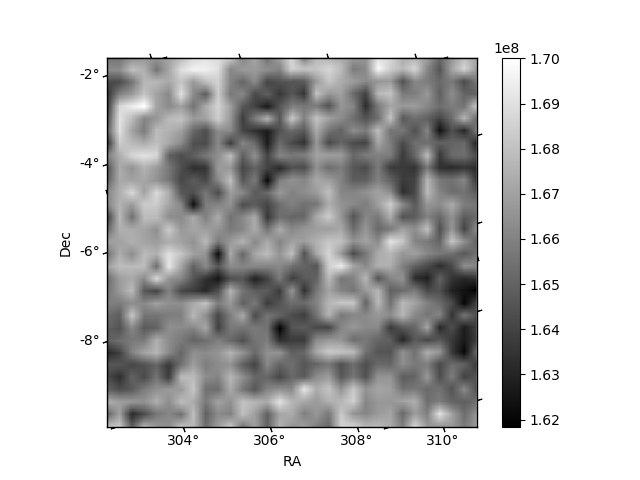
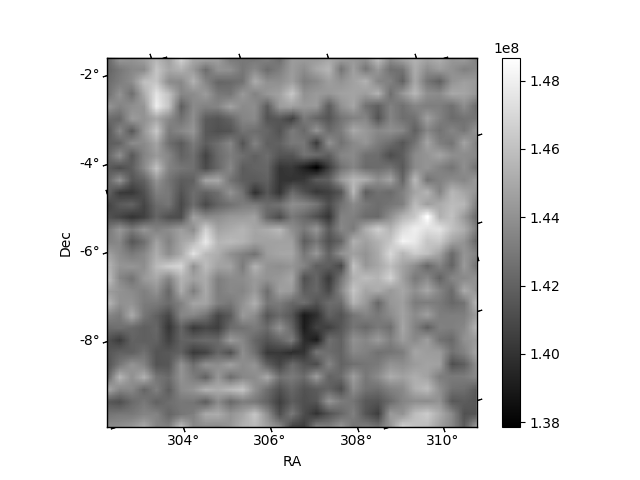
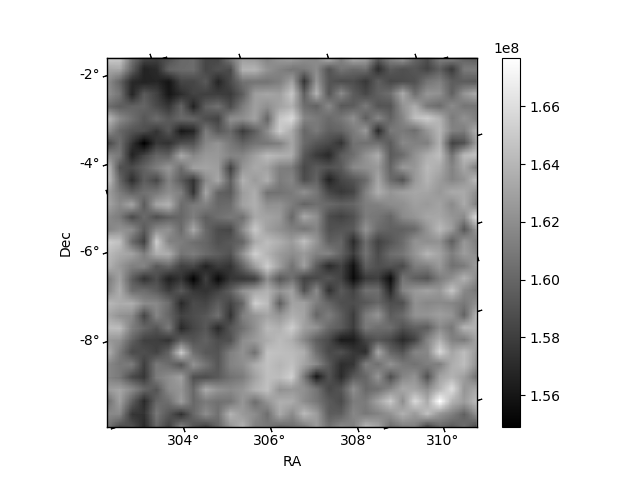
Histogram calculated using DETX and DETY for each event in the final _common_clean file
| Quadrant A | 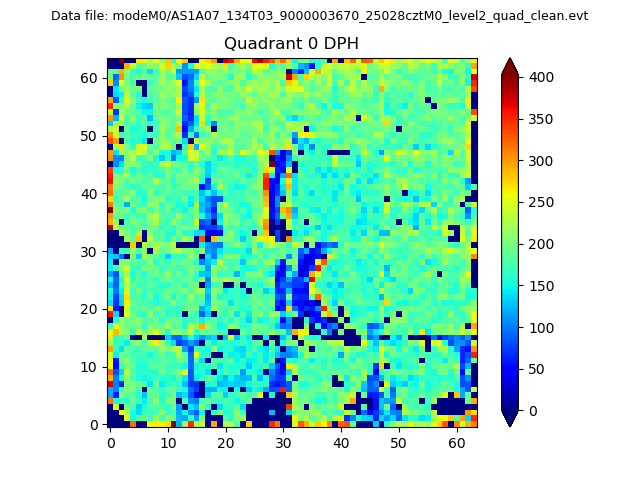 |
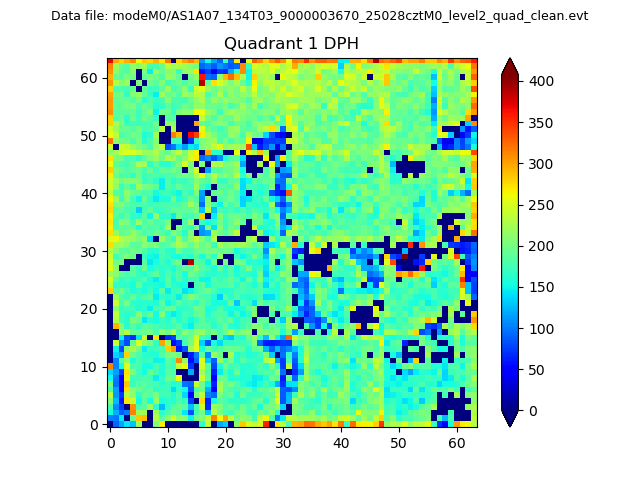 |
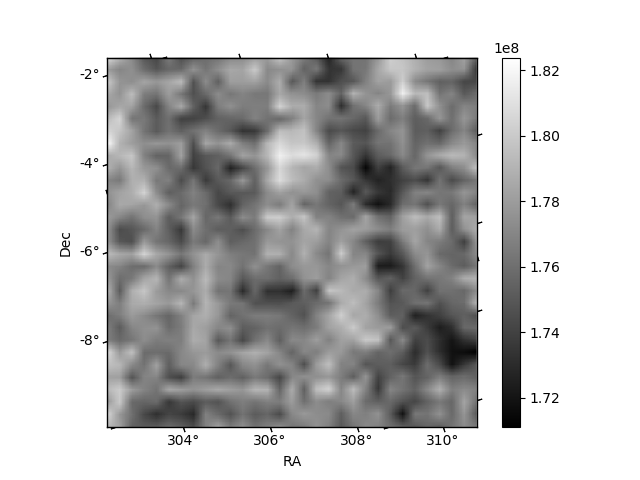
Quadrant B |
|---|---|---|---|
| Quadrant D | 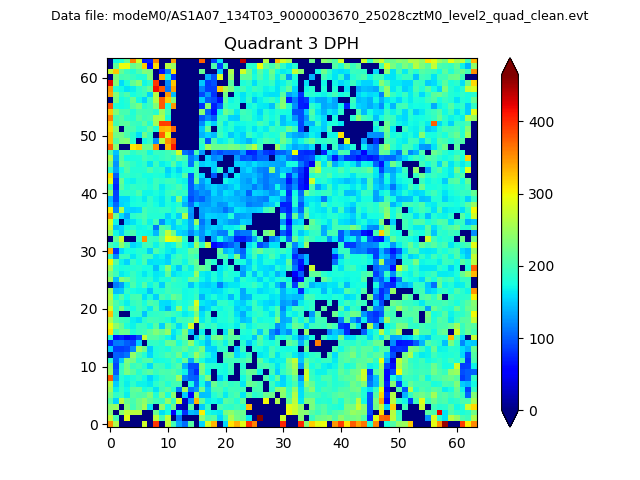 |
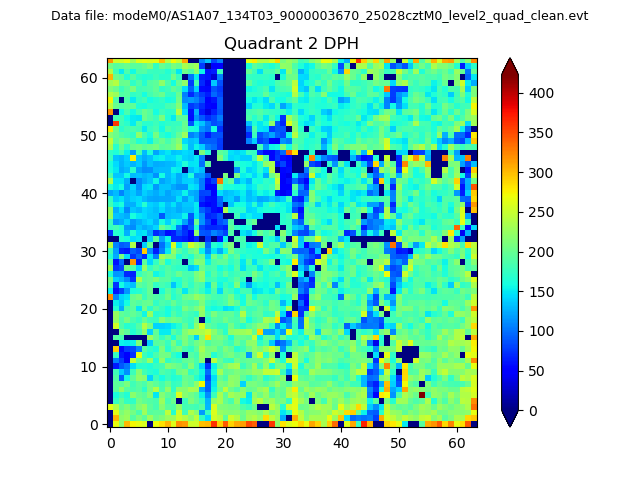 |
Quadrant C |
| Plot type | Count rate plots | Images |
|---|---|---|
| Comparison with Poisson distribution Blue bars denote a histogram of data divided into 1 sec bins. Red curve is a Poisson curve with rate = median count rate of data. |
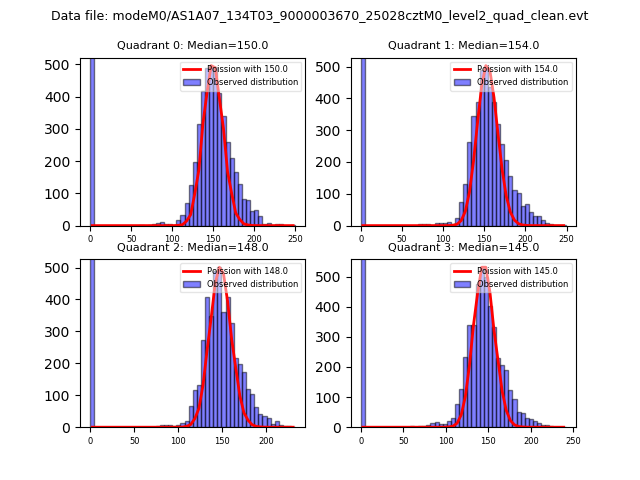 |
 |
| Quadrant-wise count rates Data is divided into 100 sec bins |
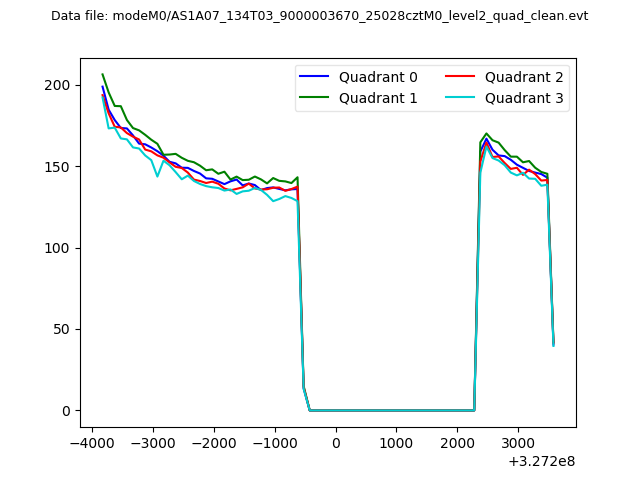 |
|
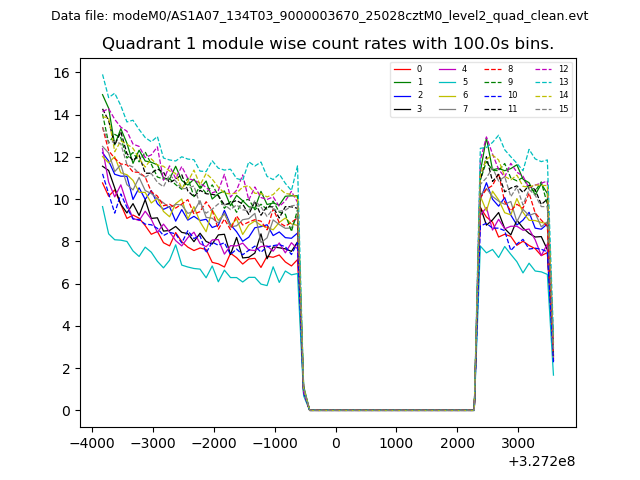
| Module-wise count rates for Quadrant A Data is divided into 100 sec bins |
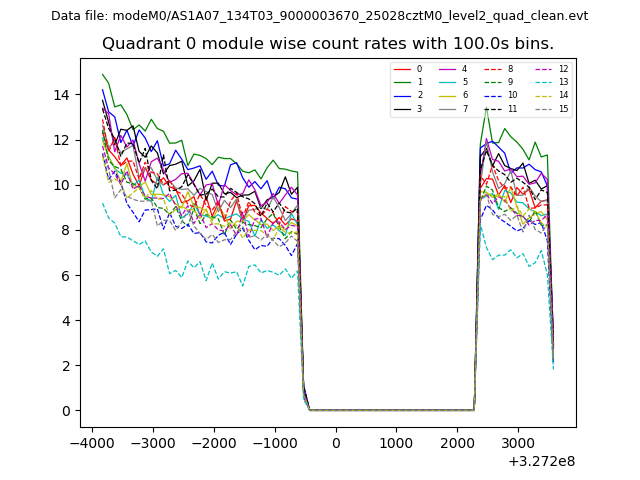 |
 |
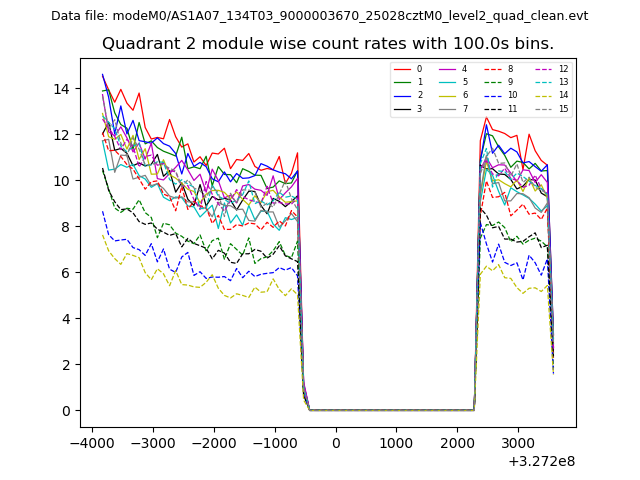
| Module-wise count rates for Quadrant B Data is divided into 100 sec bins |
 |
 |
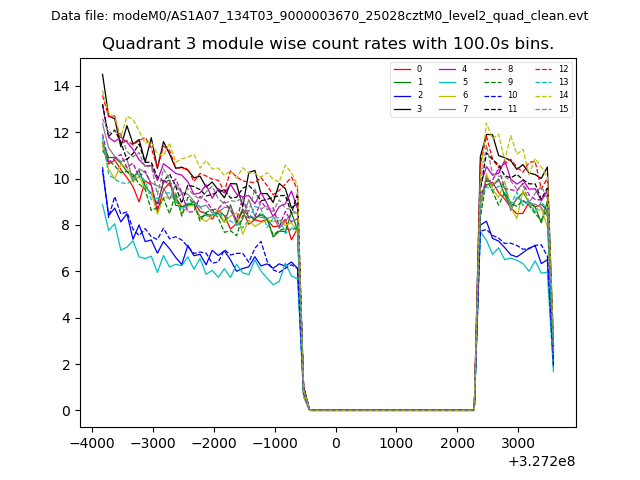
| Module-wise count rates for Quadrant C Data is divided into 100 sec bins |
 |
 |
| Module-wise count rates for Quadrant D Data is divided into 100 sec bins |
 |
 |
| Parameter | Plot |
|---|---|
| CZT HV Monitor | 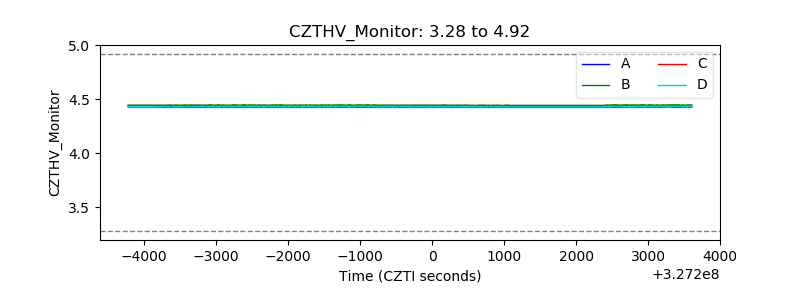 |
| D_VDD | 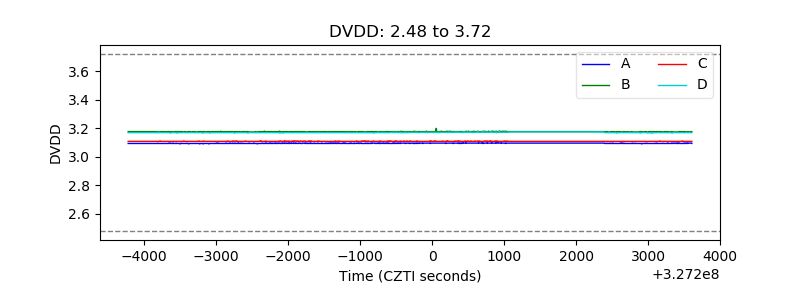 |
| Temperature 1 | 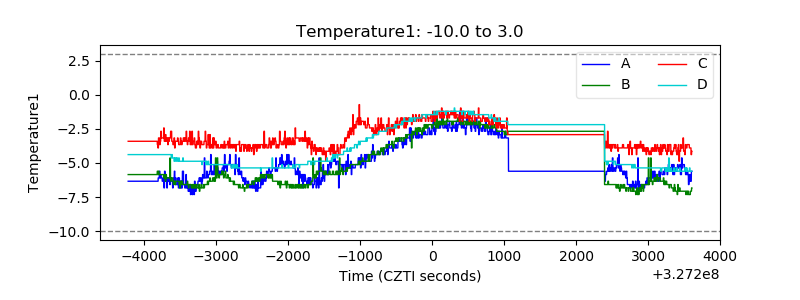 |
| Veto HV Monitor | 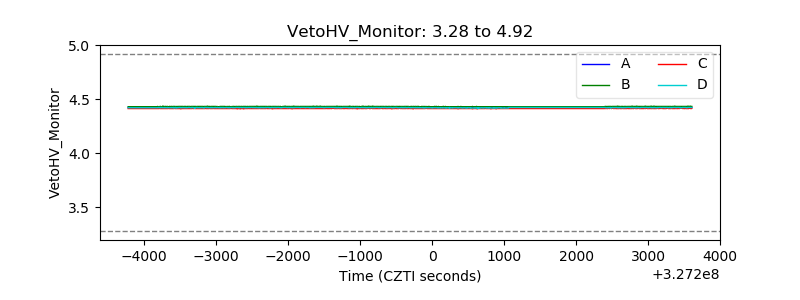 |
| Veto LLD | 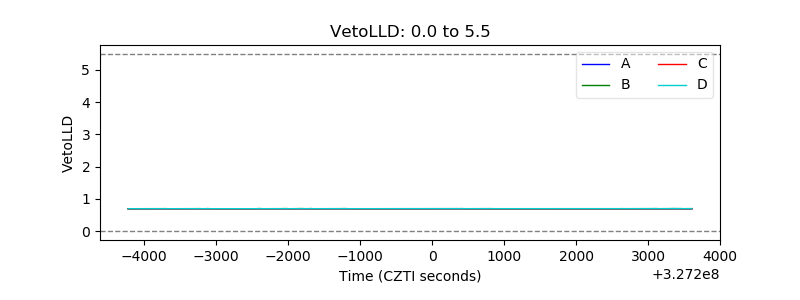 |
| Alpha Counter | 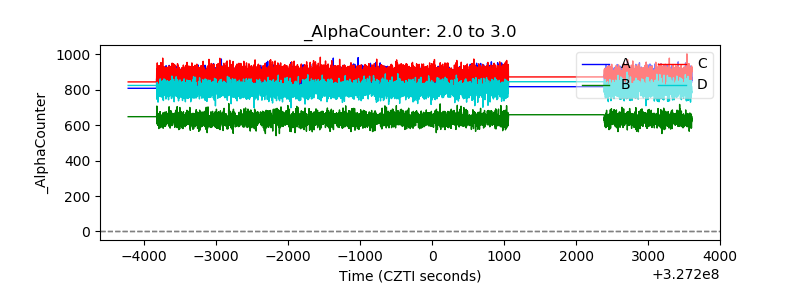 |
| _CPM_Rate | 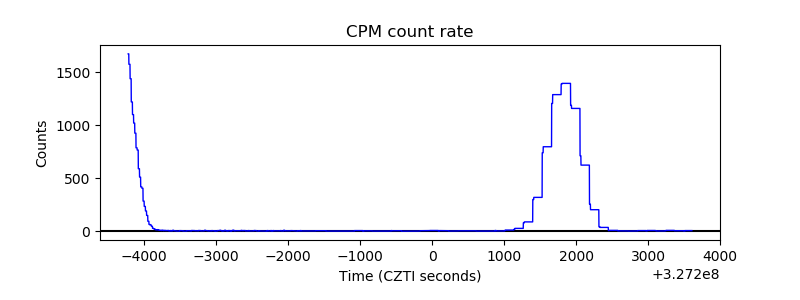 |
| CZT Counter | 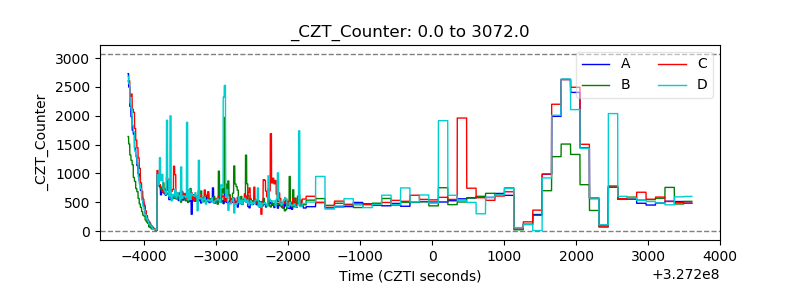 |
| +2.5 Volts monitor |  |
| +5 Volts monitor |  |
| _ROLL_ROT | 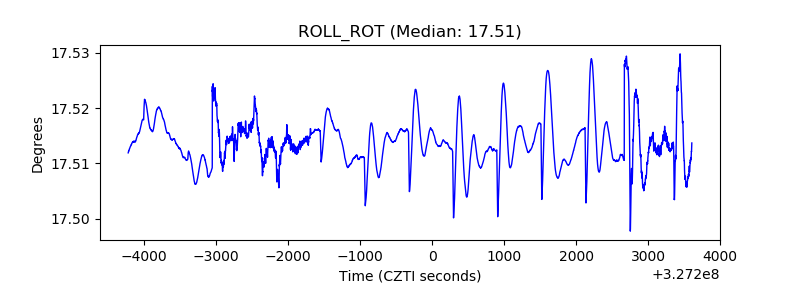 |
| _Roll_DEC | 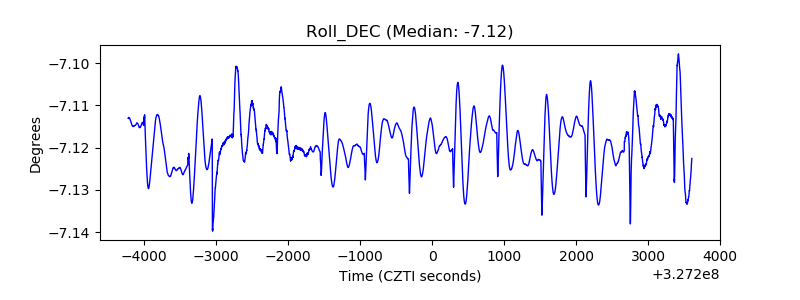 |
| _Roll_RA | 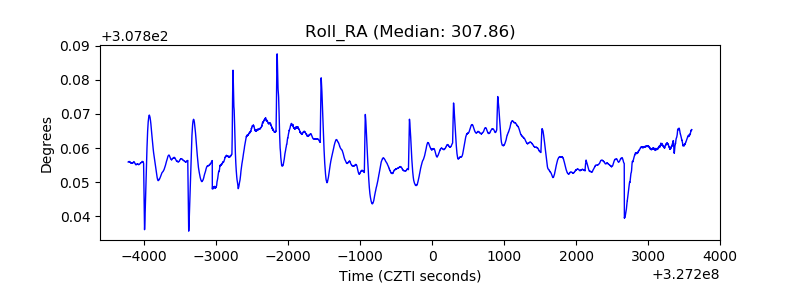 |
| Veto Counter | 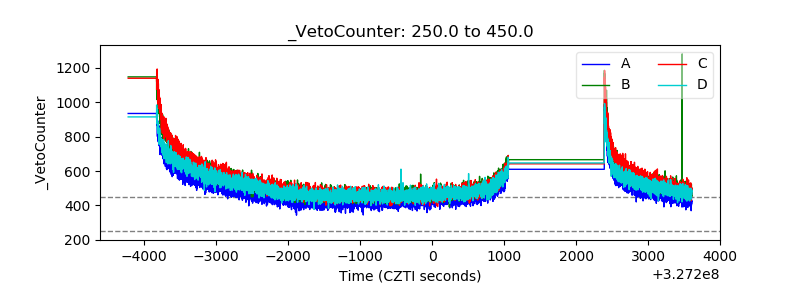 |