| Param | Original file | Final file |
|---|---|---|
| Filename | modeM0/AS1A07_134T03_9000003670_25029cztM0_level2.evt | modeM0/AS1A07_134T03_9000003670_25029cztM0_level2_quad_clean.evt |
| Size (bytes) | 483,076,800 | 94,055,040 |
| Size | 460.7 MB | 89.7 MB |
| Events in quadrant A | 3,246,768 | 603,964 |
| Events in quadrant B | 3,378,214 | 618,065 |
| Events in quadrant C | 3,352,858 | 593,222 |
| Events in quadrant D | 4,208,503 | 577,297 |
| Mode M9 | |||
|---|---|---|---|
| Quadrant | BADHDUFLAG | Total packets | Discarded packets |
| A | 0 | 19 | 0 |
| B | 0 | 20 | 0 |
| C | 0 | 20 | 0 |
| D | 0 | 20 | 0 |
| Mode M0 | |||
|---|---|---|---|
| Quadrant | BADHDUFLAG | Total packets | Discarded packets |
| A | 0 | 13715 | 2 |
| B | 0 | 14079 | 2 |
| C | 0 | 13904 | 2 |
| D | 0 | 16984 | 2 |
| Mode SS | |||
|---|---|---|---|
| Quadrant | BADHDUFLAG | Total packets | Discarded packets |
| A | 0 | 132 | 0 |
| B | 0 | 132 | 0 |
| C | 0 | 132 | 0 |
| D | 0 | 132 | 0 |
| Quadrant | Total seconds | Saturated seconds | Saturation percentage |
|---|---|---|---|
| A | 6533 | 34 | 0.520435% |
| B | 6533 | 77 | 1.178632% |
| C | 6533 | 99 | 1.515383% |
| D | 6533 | 70 | 1.071483% |
Noise dominated data is calculated using 1-second bins in cleaned event files. If a bin has >2000 counts, and if more than 50% of those come from <1% of pixels, then it is considered to be noise-dominated and hence unusable.
| Quadrant | # 1 sec bins | Bins with >0 counts | Bins with >2000 counts | High rate bins dominated by noise | Noise dominated (total time) | Noise dominated (detector-on time) | Marked lightcurve |
|---|---|---|---|---|---|---|---|
| A | 7603 | 6534 | 0 | 0 | 0.00% | 0.00% | 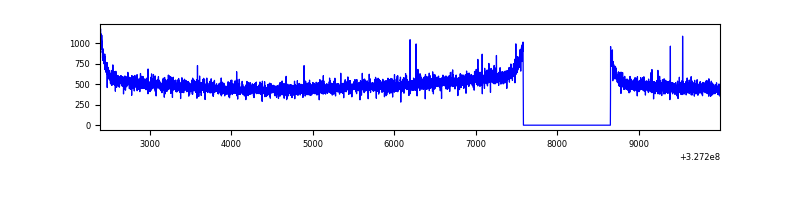 |
| B | 7603 | 6534 | 5 | 5 | 0.07% | 0.08% | 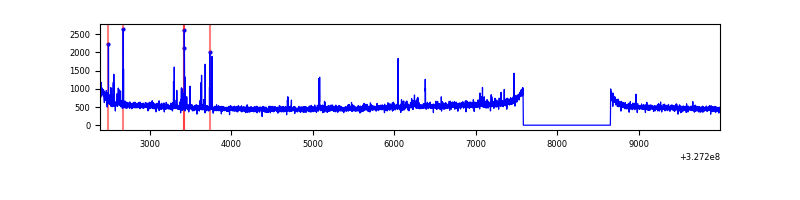 |
| C | 7603 | 6534 | 0 | 0 | 0.00% | 0.00% | 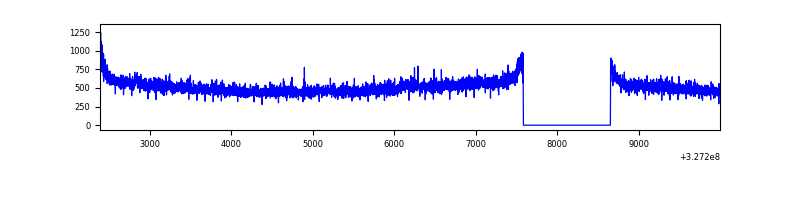 |
| D | 7603 | 6534 | 44 | 44 | 0.58% | 0.67% | 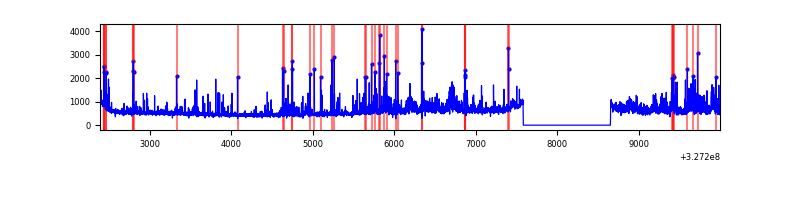 |
Top three noisy pixels from each quadrant. If the there are fewer than three noisy pixels in the level2.evt file, extra rows are filled as -1
| Pixel properties | Quadrant properties | ||||||
|---|---|---|---|---|---|---|---|
| Quadrant | DetID | PixID | Counts | Sigma | Mean | Median | Sigma |
| A | 11 | 208 | 12307 | 68.09 | 840 | 823 | 168.6 |
| A | 13 | 254 | 8325 | 44.48 | 840 | 823 | 168.6 |
| A | 3 | 137 | 7451 | 39.3 | 840 | 823 | 168.6 |
| B | 3 | 64 | 58127 | 353.68 | 839 | 819 | 162.0 |
| B | 12 | 111 | 19520 | 115.41 | 839 | 819 | 162.0 |
| B | 11 | 111 | 17555 | 103.29 | 839 | 819 | 162.0 |
| C | 14 | 238 | 129396 | 677.17 | 814 | 821 | 189.9 |
| C | 7 | 247 | 25709 | 131.08 | 814 | 821 | 189.9 |
| C | 3 | 233 | 17314 | 86.86 | 814 | 821 | 189.9 |
| D | 8 | 195 | 673819 | 3359.5 | 820 | 797 | 200.3 |
| D | 1 | 52 | 383429 | 1909.97 | 820 | 797 | 200.3 |
| D | 10 | 70 | 21500 | 103.34 | 820 | 797 | 200.3 |
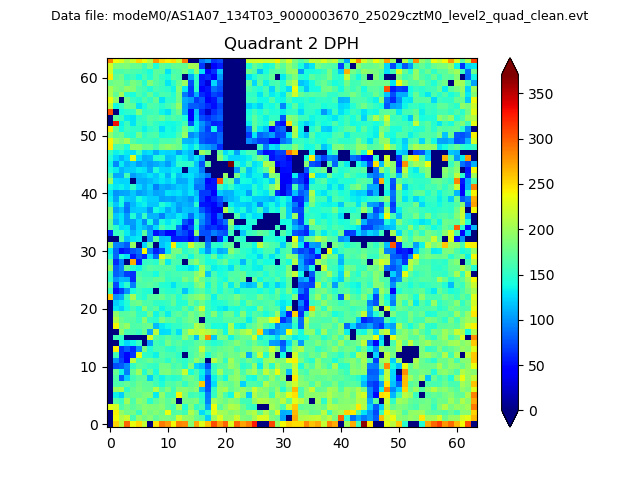
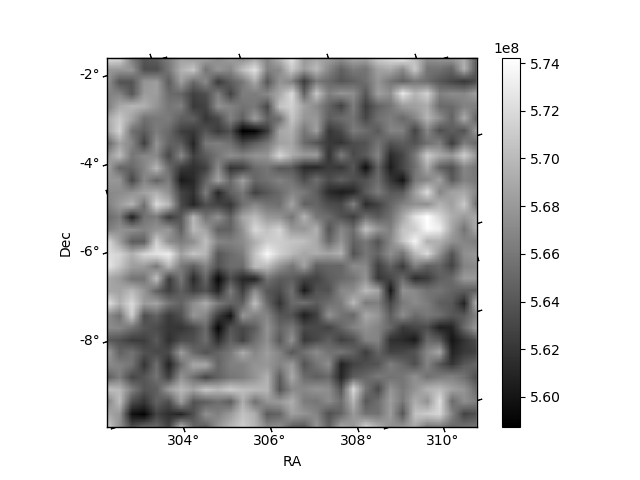
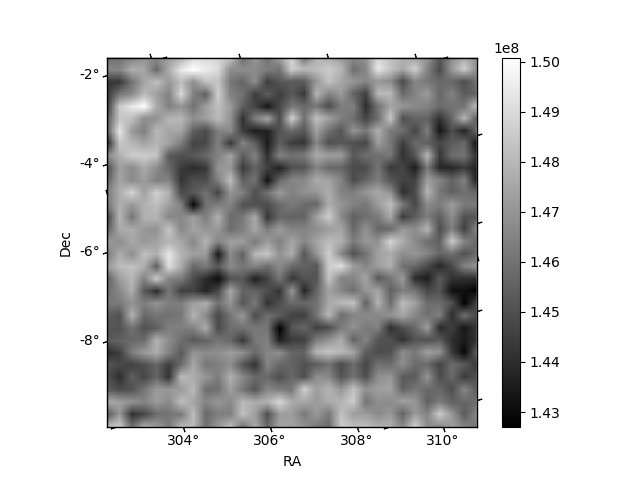
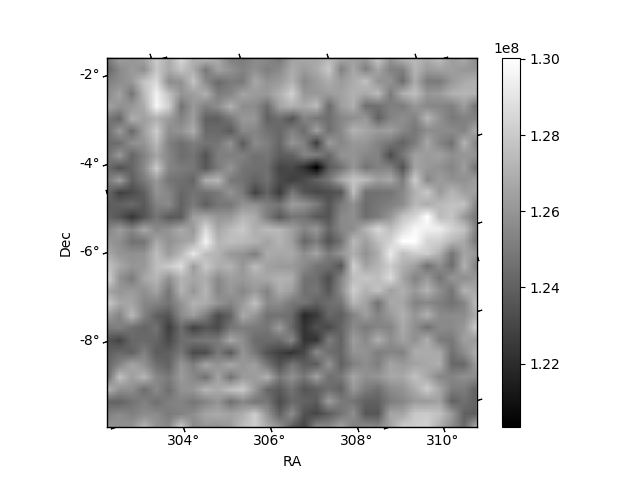
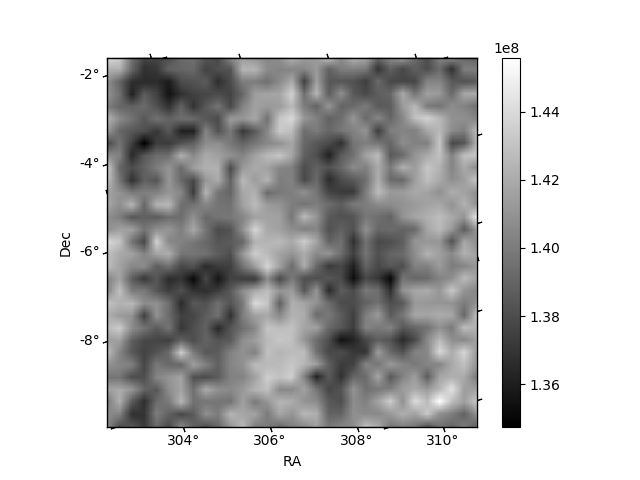
Histogram calculated using DETX and DETY for each event in the final _common_clean file
| Quadrant A | 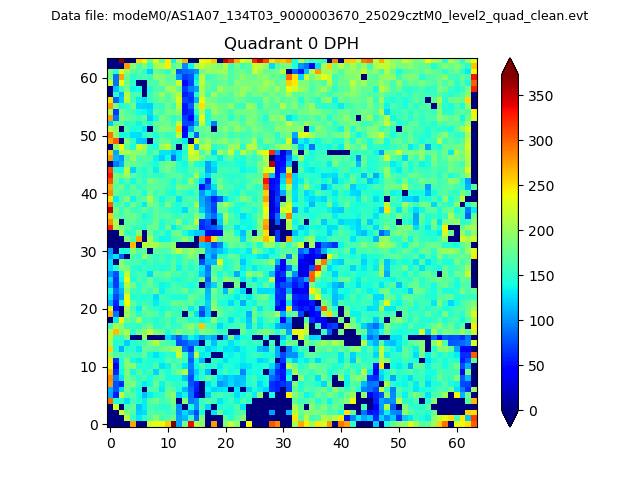 |
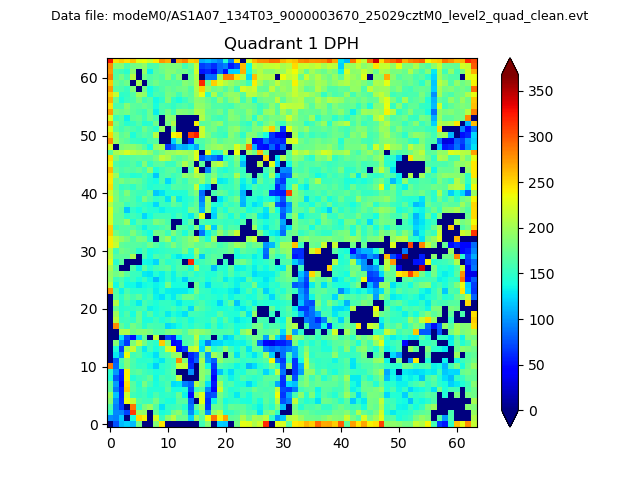 |
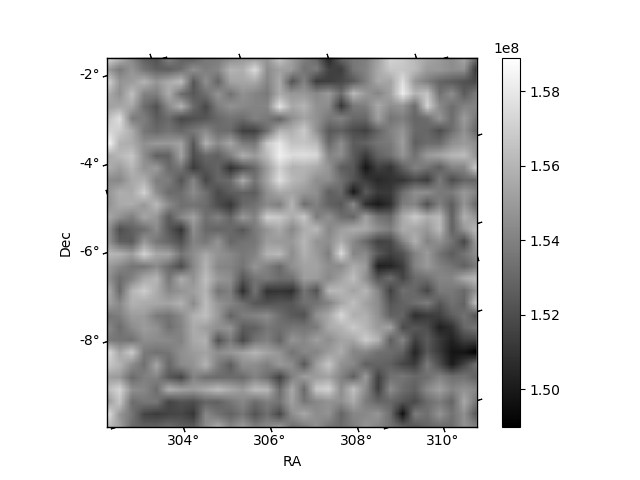
Quadrant B |
|---|---|---|---|
| Quadrant D | 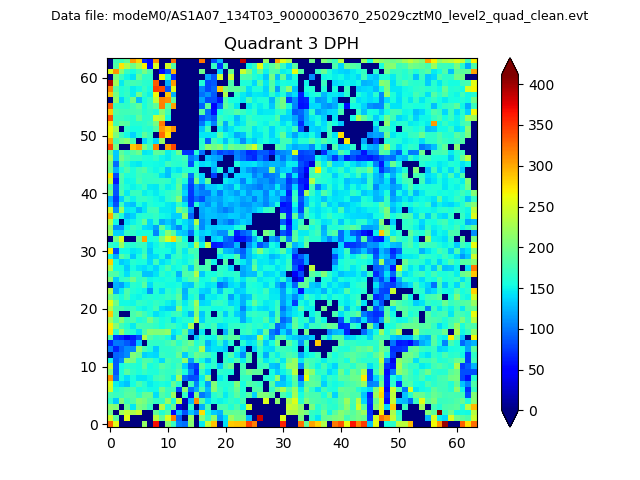 |
 |
Quadrant C |
| Plot type | Count rate plots | Images |
|---|---|---|
| Comparison with Poisson distribution Blue bars denote a histogram of data divided into 1 sec bins. Red curve is a Poisson curve with rate = median count rate of data. |
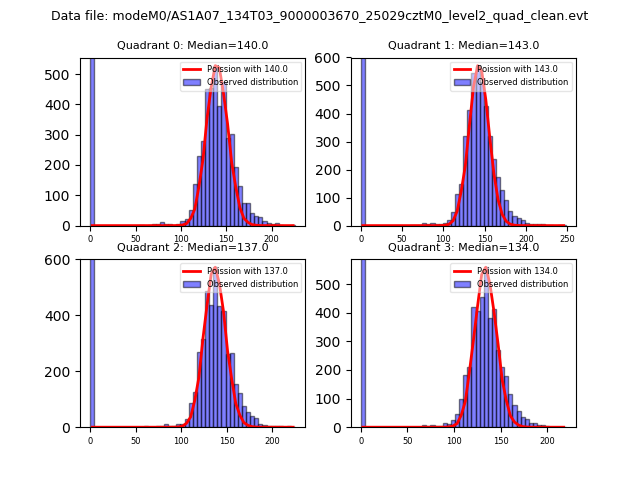 |
 |
| Quadrant-wise count rates Data is divided into 100 sec bins |
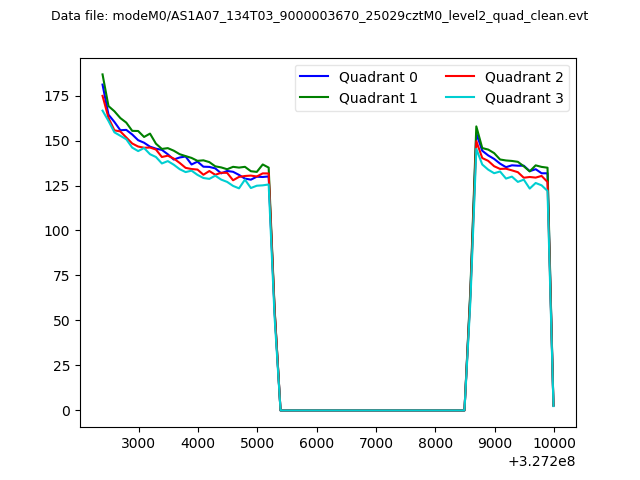 |
|
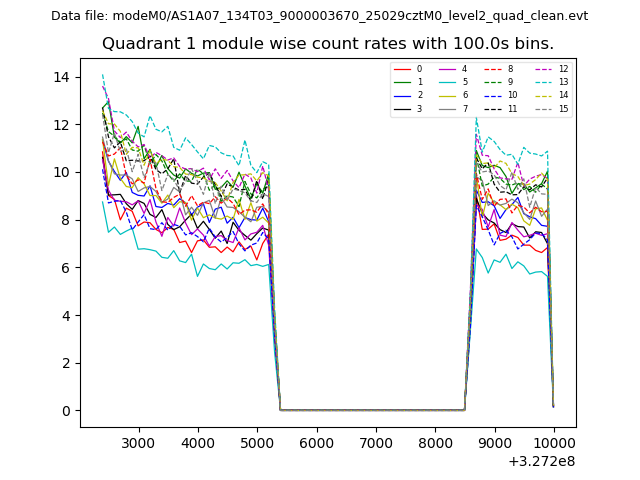
| Module-wise count rates for Quadrant A Data is divided into 100 sec bins |
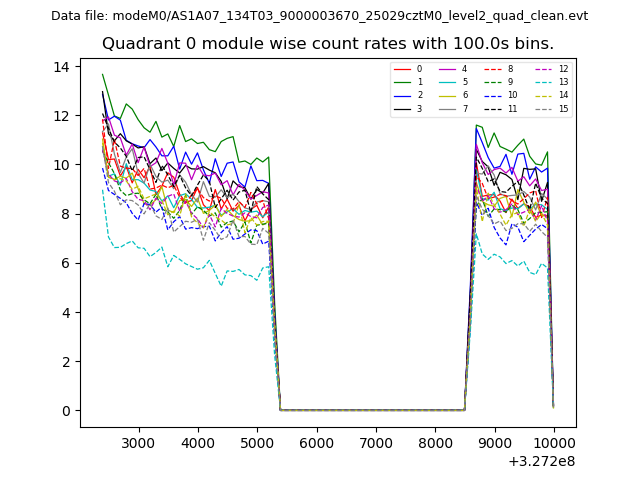 |
 |
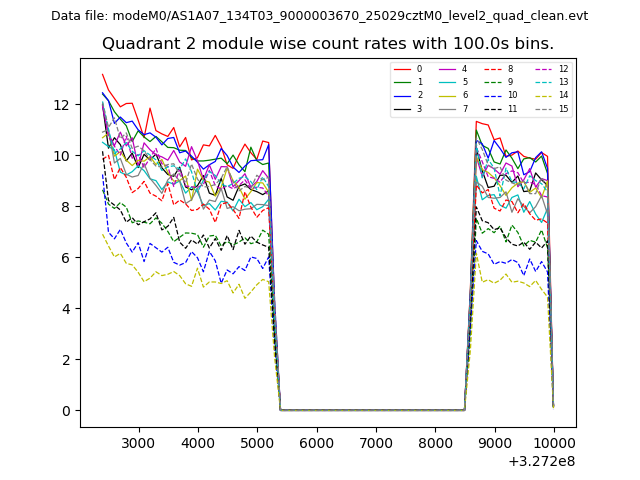
| Module-wise count rates for Quadrant B Data is divided into 100 sec bins |
 |
 |
| Module-wise count rates for Quadrant C Data is divided into 100 sec bins |
 |
 |
| Module-wise count rates for Quadrant D Data is divided into 100 sec bins |
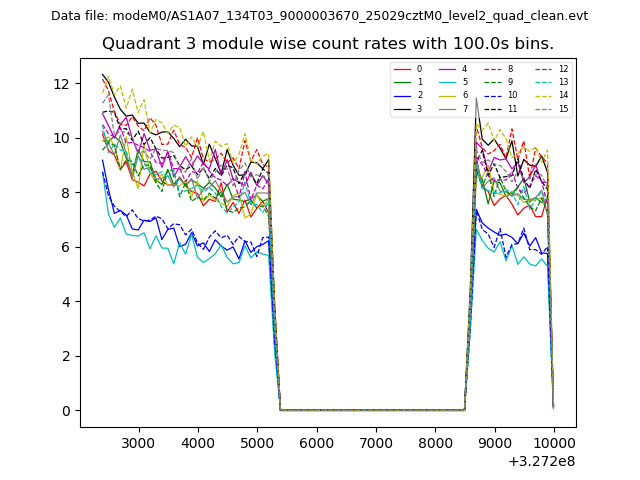 |
 |
| Parameter | Plot |
|---|---|
| CZT HV Monitor | 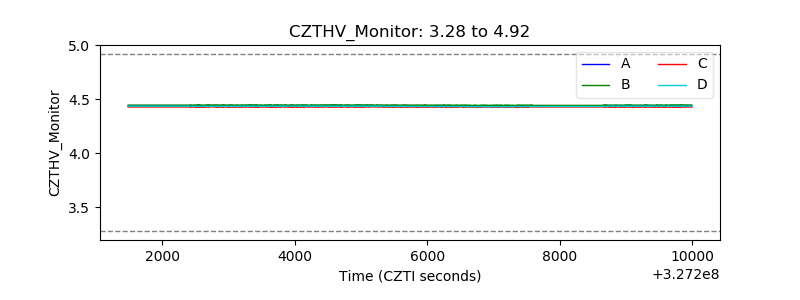 |
| D_VDD |  |
| Temperature 1 | 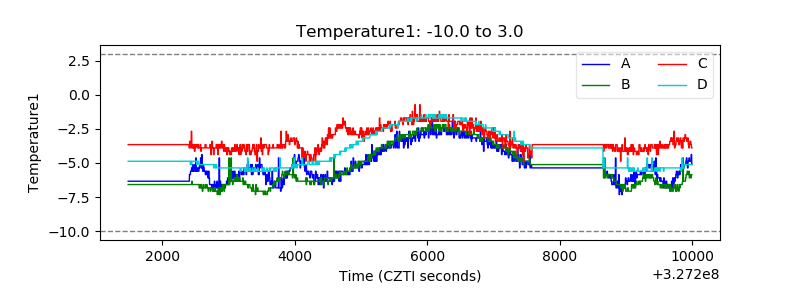 |
| Veto HV Monitor | 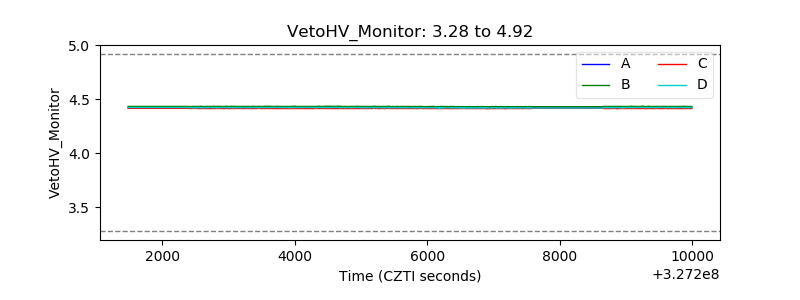 |
| Veto LLD | 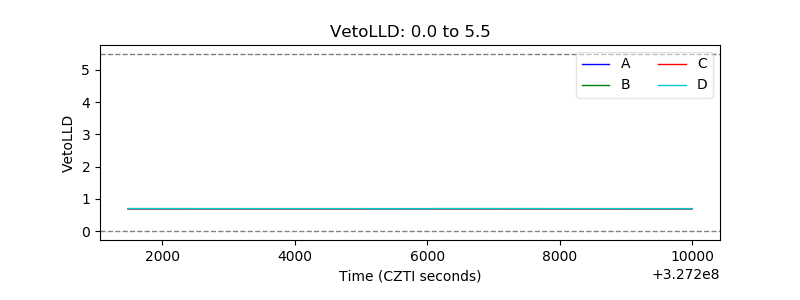 |
| Alpha Counter | 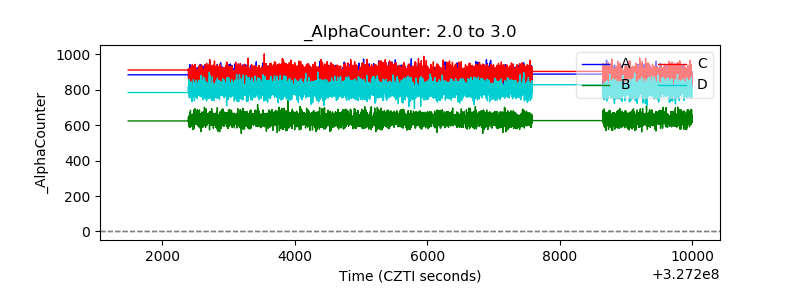 |
| _CPM_Rate | 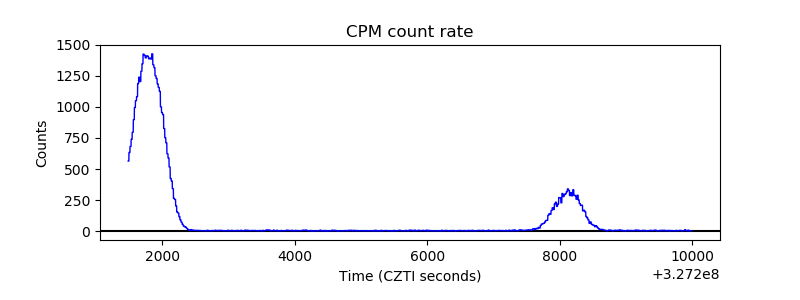 |
| CZT Counter | 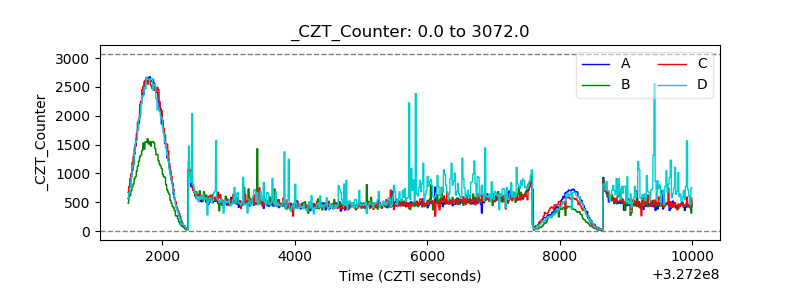 |
| +2.5 Volts monitor |  |
| +5 Volts monitor |  |
| _ROLL_ROT | 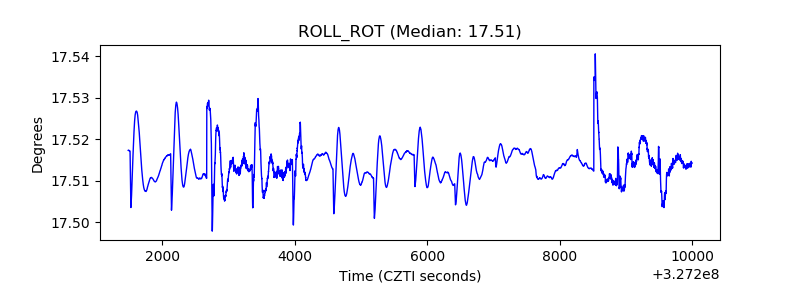 |
| _Roll_DEC | 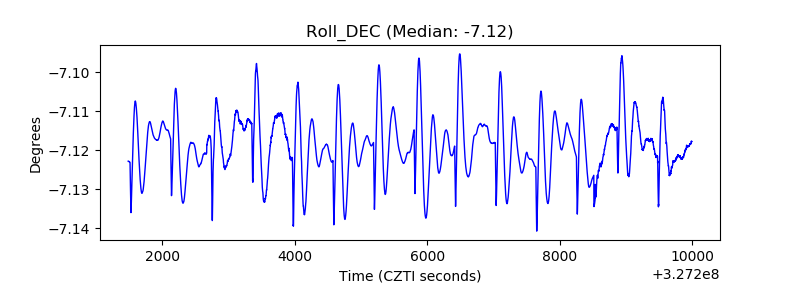 |
| _Roll_RA | 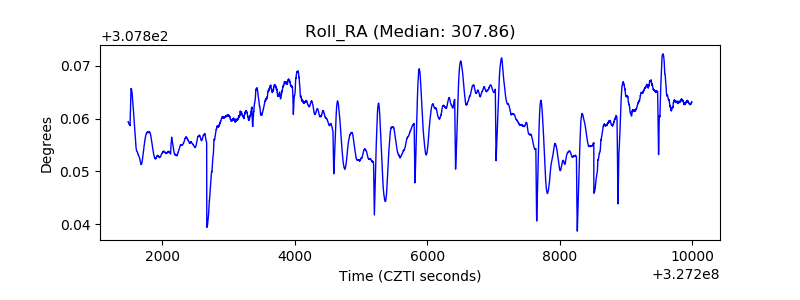 |
| Veto Counter | 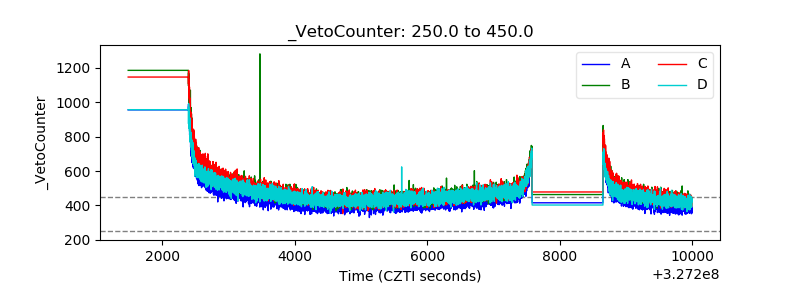 |