| Param | Original file | Final file |
|---|---|---|
| Filename | modeM0/AS1A07_134T03_9000003670_25031cztM0_level2.evt | modeM0/AS1A07_134T03_9000003670_25031cztM0_level2_quad_clean.evt |
| Size (bytes) | 733,176,000 | 128,707,200 |
| Size | 699.2 MB | 122.7 MB |
| Events in quadrant A | 4,144,557 | 834,833 |
| Events in quadrant B | 4,246,332 | 853,124 |
| Events in quadrant C | 4,304,497 | 821,660 |
| Events in quadrant D | 8,918,497 | 782,092 |
| Mode M0 | |||
|---|---|---|---|
| Quadrant | BADHDUFLAG | Total packets | Discarded packets |
| A | 0 | 18009 | 0 |
| B | 0 | 18238 | 0 |
| C | 0 | 18192 | 0 |
| D | 0 | 32801 | 2 |
| Mode SS | |||
|---|---|---|---|
| Quadrant | BADHDUFLAG | Total packets | Discarded packets |
| A | 0 | 176 | 0 |
| B | 0 | 176 | 0 |
| C | 0 | 176 | 0 |
| D | 0 | 176 | 0 |
| Quadrant | Total seconds | Saturated seconds | Saturation percentage |
|---|---|---|---|
| A | 8722 | 316 | 3.623022% |
| B | 8723 | 339 | 3.886278% |
| C | 8724 | 334 | 3.828519% |
| D | 8723 | 606 | 6.947151% |
Noise dominated data is calculated using 1-second bins in cleaned event files. If a bin has >2000 counts, and if more than 50% of those come from <1% of pixels, then it is considered to be noise-dominated and hence unusable.
| Quadrant | # 1 sec bins | Bins with >0 counts | Bins with >2000 counts | High rate bins dominated by noise | Noise dominated (total time) | Noise dominated (detector-on time) | Marked lightcurve |
|---|---|---|---|---|---|---|---|
| A | 14120 | 8724 | 0 | 0 | 0.00% | 0.00% | 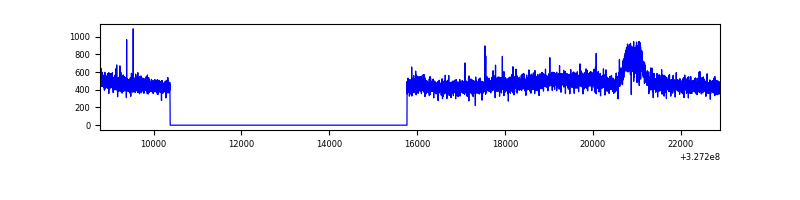 |
| B | 14121 | 8725 | 4 | 4 | 0.03% | 0.05% | 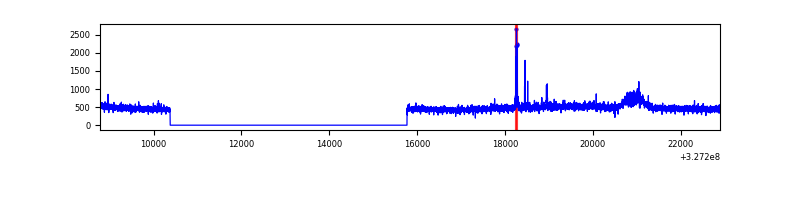 |
| C | 14121 | 8726 | 0 | 0 | 0.00% | 0.00% | 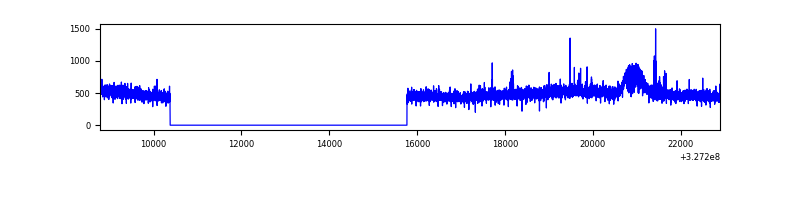 |
| D | 14120 | 8725 | 280 | 280 | 1.98% | 3.21% | 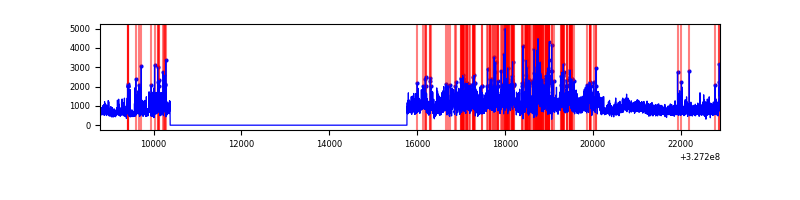 |
Top three noisy pixels from each quadrant. If the there are fewer than three noisy pixels in the level2.evt file, extra rows are filled as -1
| Pixel properties | Quadrant properties | ||||||
|---|---|---|---|---|---|---|---|
| Quadrant | DetID | PixID | Counts | Sigma | Mean | Median | Sigma |
| A | 13 | 254 | 10932 | 45.71 | 1074 | 1050 | 216.2 |
| A | 3 | 137 | 10148 | 42.08 | 1074 | 1050 | 216.2 |
| A | 0 | 226 | 9170 | 37.56 | 1074 | 1050 | 216.2 |
| B | 5 | 172 | 41373 | 195.11 | 1067 | 1039 | 206.7 |
| B | 12 | 111 | 25859 | 120.06 | 1067 | 1039 | 206.7 |
| B | 11 | 111 | 23480 | 108.55 | 1067 | 1039 | 206.7 |
| C | 14 | 238 | 162437 | 659.56 | 1039 | 1046 | 244.7 |
| C | 7 | 247 | 69535 | 279.9 | 1039 | 1046 | 244.7 |
| C | 0 | 239 | 12952 | 48.66 | 1039 | 1046 | 244.7 |
| D | 8 | 195 | 3226386 | 12798.41 | 1041 | 1010 | 252.0 |
| D | 1 | 52 | 1672833 | 6633.85 | 1041 | 1010 | 252.0 |
| D | 2 | 244 | 64623 | 252.42 | 1041 | 1010 | 252.0 |
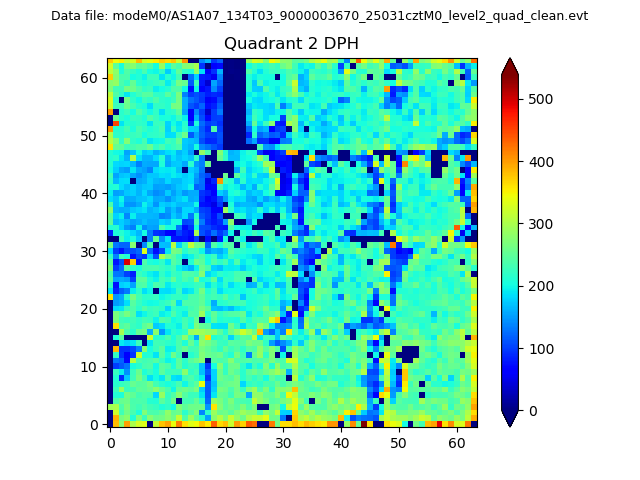
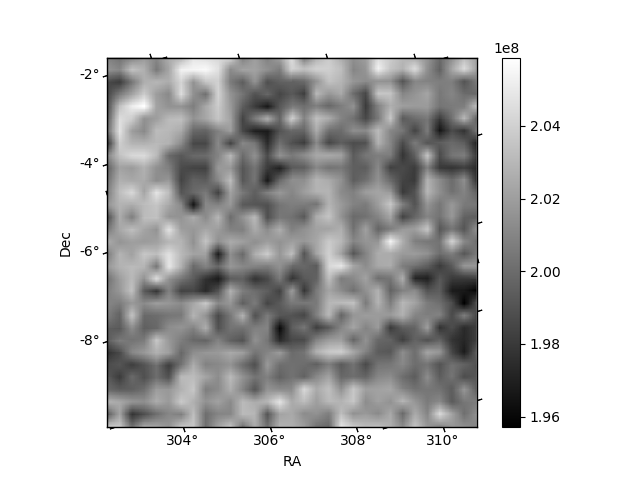
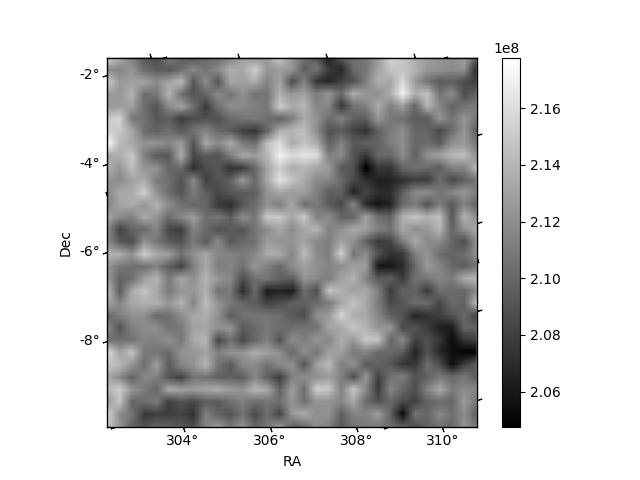
Histogram calculated using DETX and DETY for each event in the final _common_clean file
| Quadrant A | 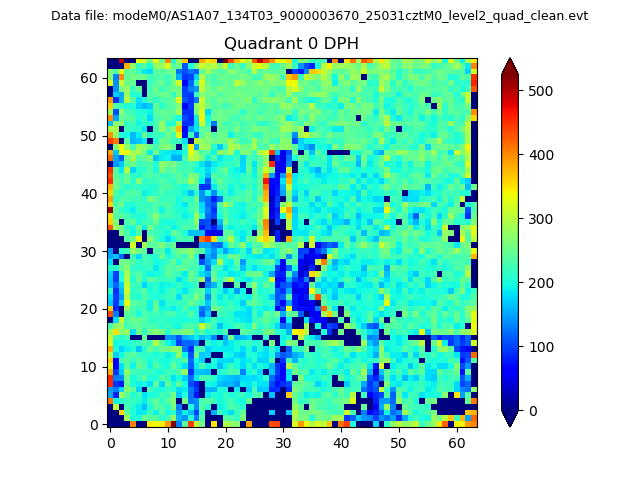 |
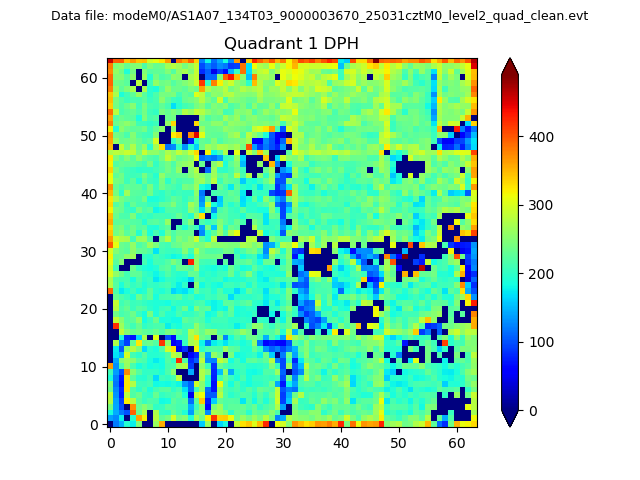 |
Quadrant B |
|---|---|---|---|
| Quadrant D | 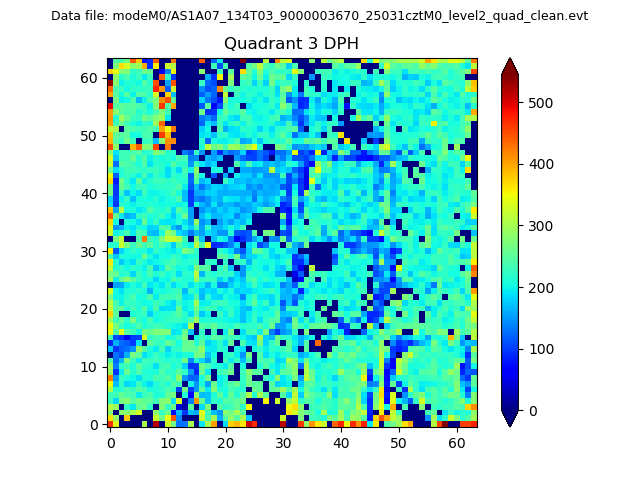 |
 |
Quadrant C |
| Plot type | Count rate plots | Images |
|---|---|---|
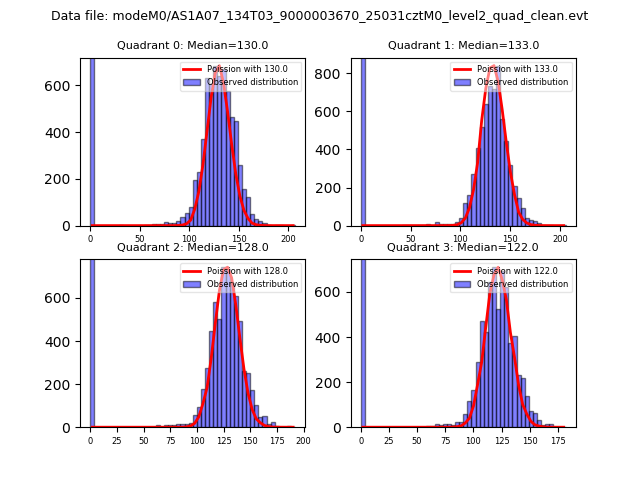
| Comparison with Poisson distribution Blue bars denote a histogram of data divided into 1 sec bins. Red curve is a Poisson curve with rate = median count rate of data. |
 |
 |
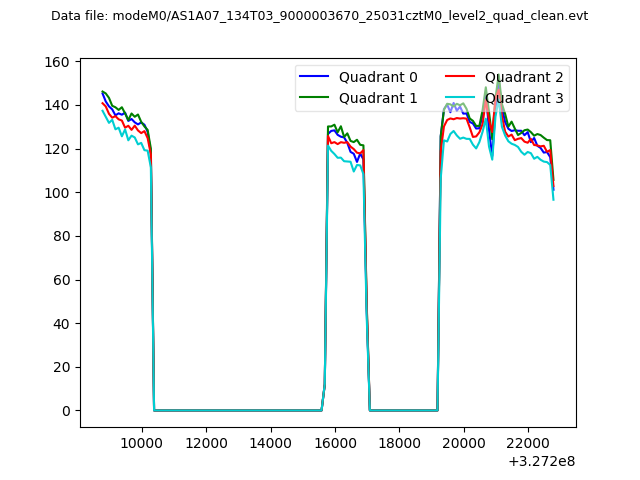
| Quadrant-wise count rates Data is divided into 100 sec bins |
 |
|
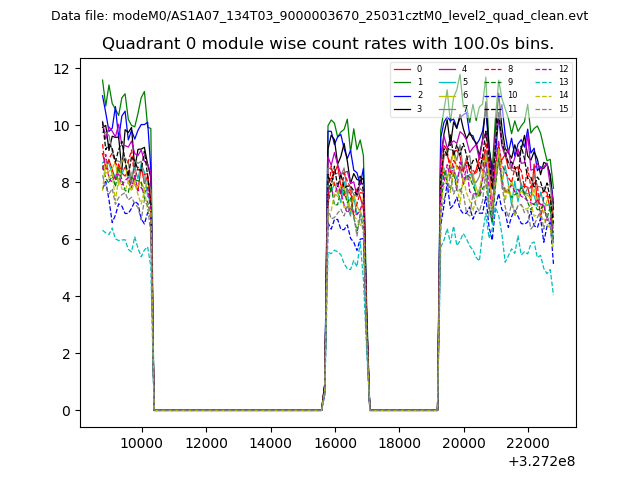
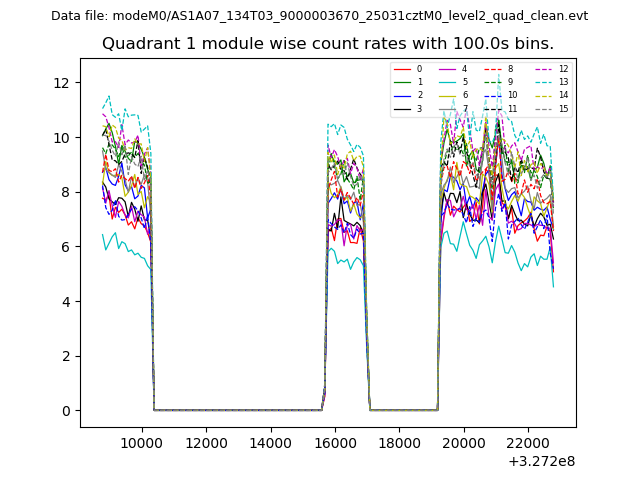
| Module-wise count rates for Quadrant A Data is divided into 100 sec bins |
 |
 |
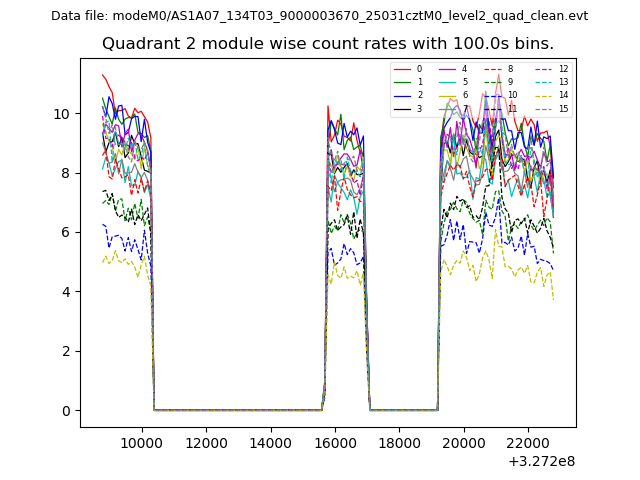
| Module-wise count rates for Quadrant B Data is divided into 100 sec bins |
 |
 |
| Module-wise count rates for Quadrant C Data is divided into 100 sec bins |
 |
 |
| Module-wise count rates for Quadrant D Data is divided into 100 sec bins |
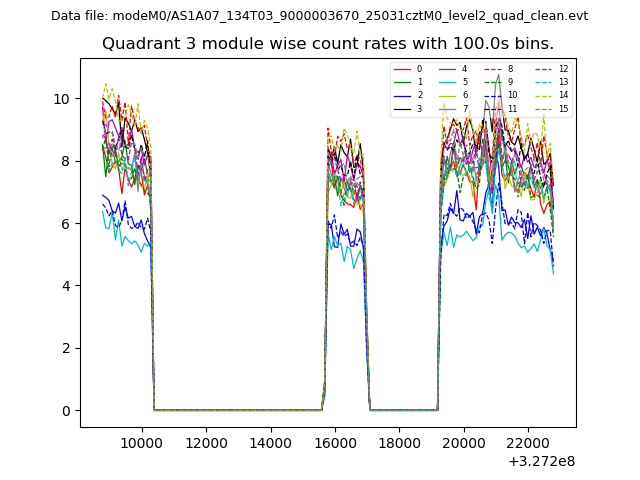 |
 |
| Parameter | Plot |
|---|---|
| CZT HV Monitor | 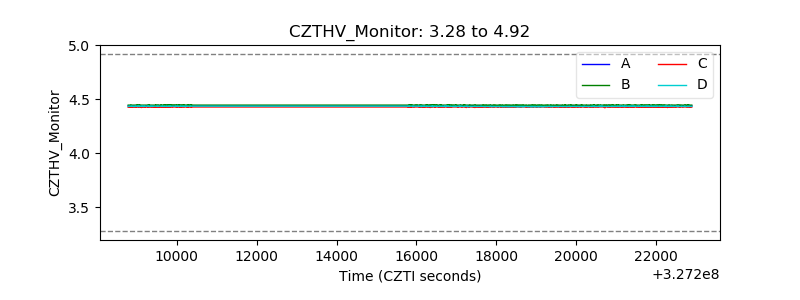 |
| D_VDD | 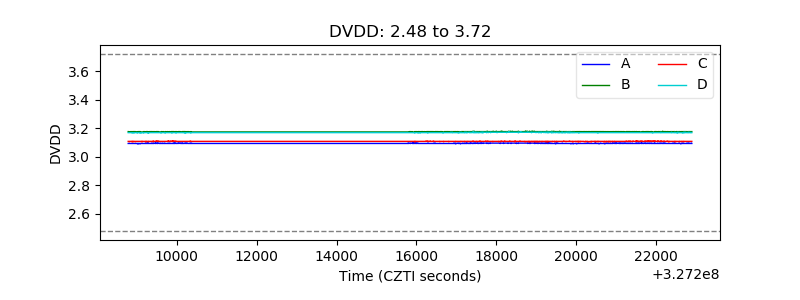 |
| Temperature 1 | 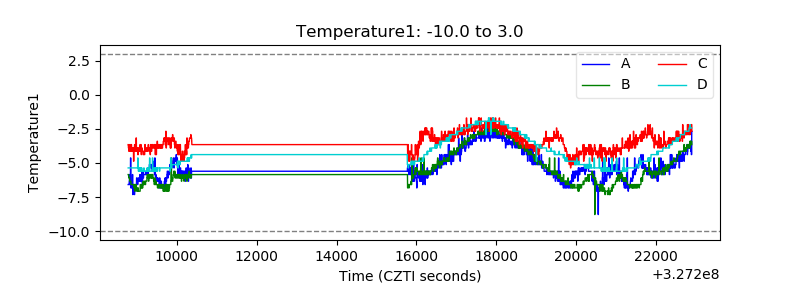 |
| Veto HV Monitor | 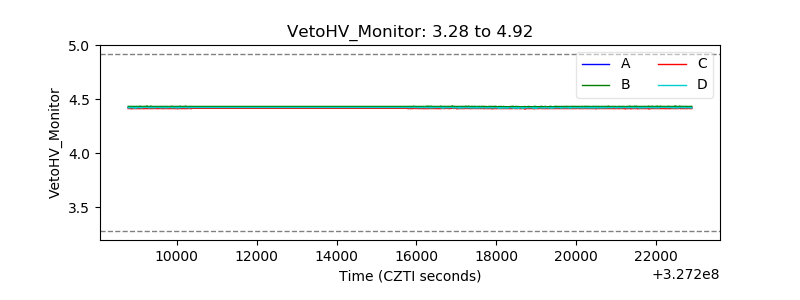 |
| Veto LLD | 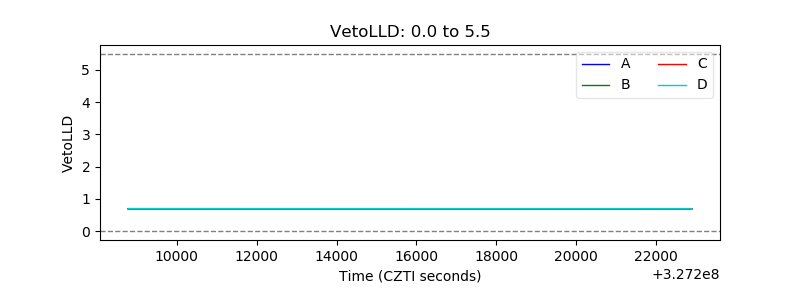 |
| Alpha Counter | 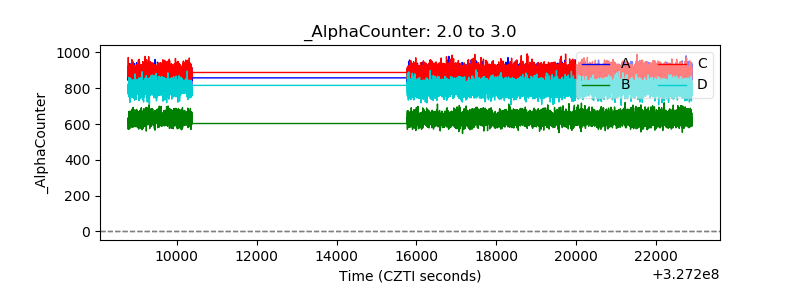 |
| _CPM_Rate | 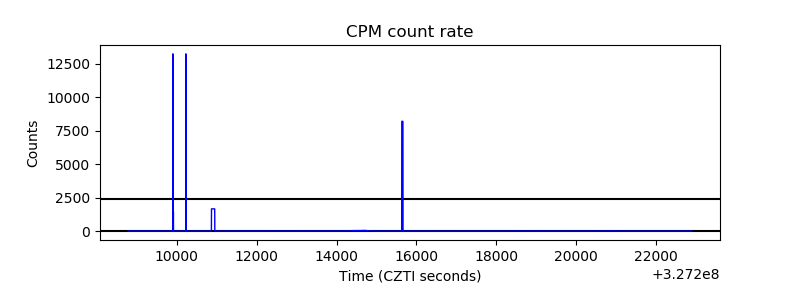 |
| CZT Counter | 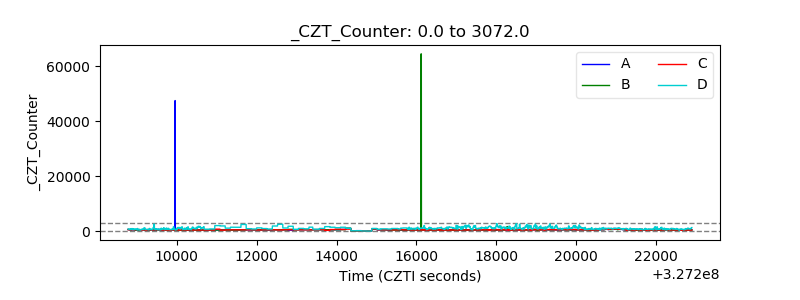 |
| +2.5 Volts monitor | 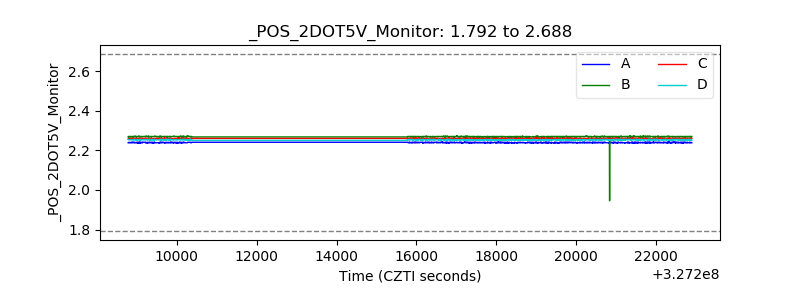 |
| +5 Volts monitor | 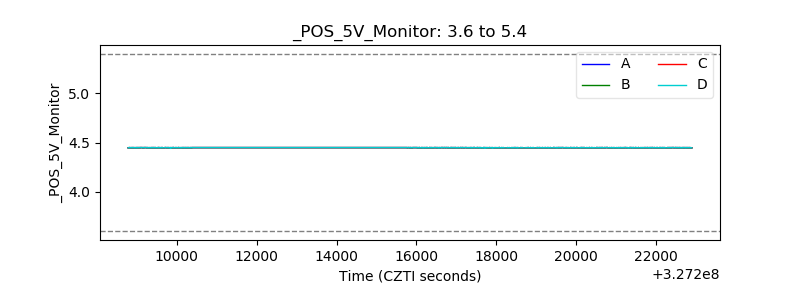 |
| _ROLL_ROT | 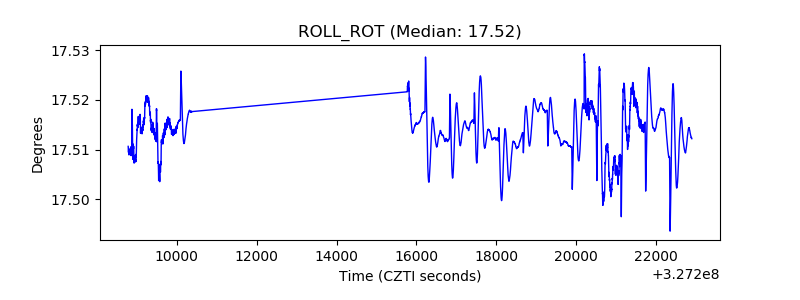 |
| _Roll_DEC | 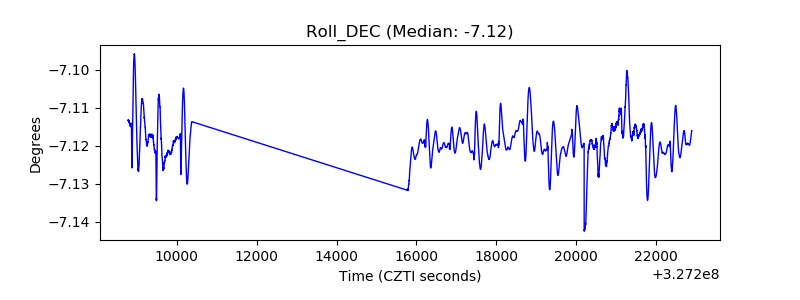 |
| _Roll_RA | 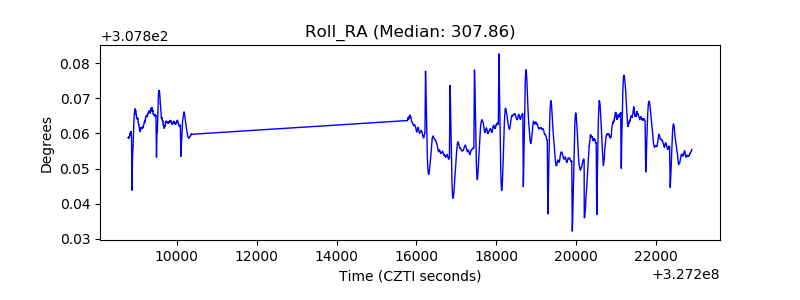 |
| Veto Counter | 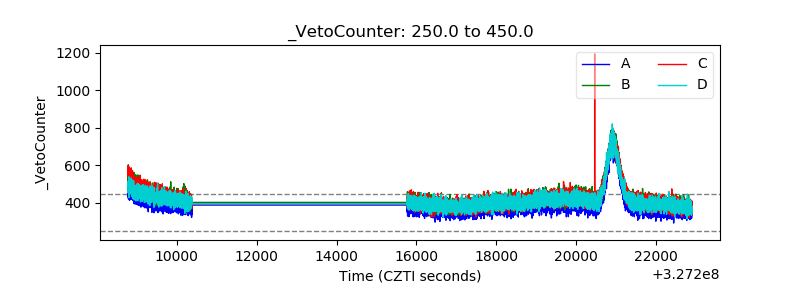 |