| Param | Original file | Final file |
|---|---|---|
| Filename | modeM0/AS1A07_134T03_9000003670_25036cztM0_level2.evt | modeM0/AS1A07_134T03_9000003670_25036cztM0_level2_quad_clean.evt |
| Size (bytes) | 1,443,876,480 | 203,578,560 |
| Size | 1.3 GB | 194.1 MB |
| Events in quadrant A | 7,946,614 | 1,277,572 |
| Events in quadrant B | 8,082,911 | 1,301,456 |
| Events in quadrant C | 8,222,368 | 1,254,314 |
| Events in quadrant D | 18,361,295 | 1,190,798 |
| Mode M9 | |||
|---|---|---|---|
| Quadrant | BADHDUFLAG | Total packets | Discarded packets |
| A | 0 | 6 | 0 |
| B | 0 | 6 | 0 |
| C | 0 | 6 | 0 |
| D | 0 | 6 | 0 |
| Mode M0 | |||
|---|---|---|---|
| Quadrant | BADHDUFLAG | Total packets | Discarded packets |
| A | 0 | 34123 | 1 |
| B | 0 | 34486 | 1 |
| C | 0 | 34574 | 1 |
| D | 0 | 66438 | 1 |
| Mode SS | |||
|---|---|---|---|
| Quadrant | BADHDUFLAG | Total packets | Discarded packets |
| A | 0 | 334 | 0 |
| B | 0 | 334 | 0 |
| C | 0 | 334 | 0 |
| D | 0 | 334 | 0 |
| Quadrant | Total seconds | Saturated seconds | Saturation percentage |
|---|---|---|---|
| A | 16541 | 393 | 2.375914% |
| B | 16542 | 444 | 2.684077% |
| C | 16542 | 481 | 2.907750% |
| D | 16542 | 1209 | 7.308669% |
Noise dominated data is calculated using 1-second bins in cleaned event files. If a bin has >2000 counts, and if more than 50% of those come from <1% of pixels, then it is considered to be noise-dominated and hence unusable.
| Quadrant | # 1 sec bins | Bins with >0 counts | Bins with >2000 counts | High rate bins dominated by noise | Noise dominated (total time) | Noise dominated (detector-on time) | Marked lightcurve |
|---|---|---|---|---|---|---|---|
| A | 17132 | 16543 | 0 | 0 | 0.00% | 0.00% |  |
| B | 17133 | 16544 | 7 | 7 | 0.04% | 0.04% |  |
| C | 17133 | 16544 | 1 | 1 | 0.01% | 0.01% |  |
| D | 17133 | 16544 | 749 | 749 | 4.37% | 4.53% |  |
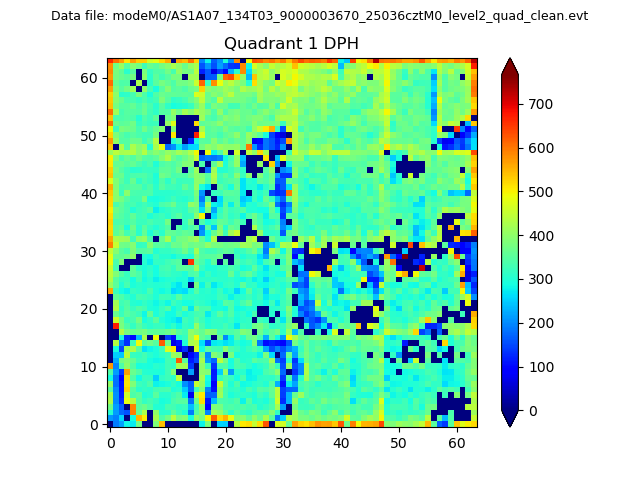
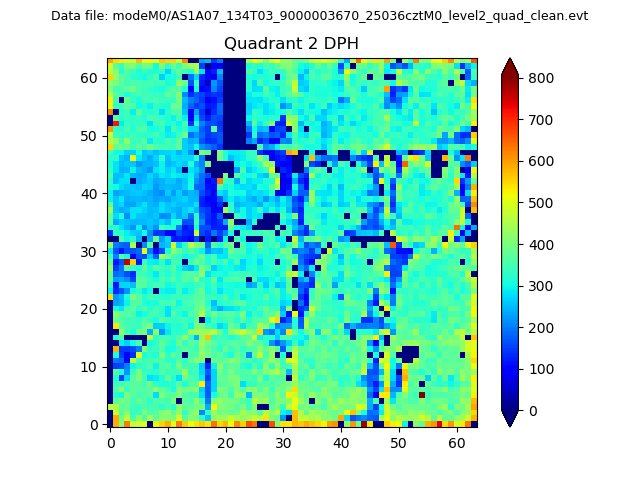
Top three noisy pixels from each quadrant. If the there are fewer than three noisy pixels in the level2.evt file, extra rows are filled as -1
| Pixel properties | Quadrant properties | ||||||
|---|---|---|---|---|---|---|---|
| Quadrant | DetID | PixID | Counts | Sigma | Mean | Median | Sigma |
| A | 11 | 208 | 32165 | 73.05 | 2053 | 2007 | 412.9 |
| A | 13 | 254 | 22141 | 48.77 | 2053 | 2007 | 412.9 |
| A | 3 | 137 | 19349 | 42.0 | 2053 | 2007 | 412.9 |
| B | 12 | 111 | 49249 | 120.89 | 2033 | 1981 | 391.0 |
| B | 0 | 190 | 48444 | 118.83 | 2033 | 1981 | 391.0 |
| B | 5 | 172 | 48343 | 118.58 | 2033 | 1981 | 391.0 |
| C | 14 | 238 | 311947 | 667.45 | 1974 | 1984 | 464.4 |
| C | 7 | 247 | 181855 | 387.32 | 1974 | 1984 | 464.4 |
| C | 0 | 239 | 19929 | 38.64 | 1974 | 1984 | 464.4 |
| D | 8 | 195 | 8127699 | 17022.9 | 1976 | 1920 | 477.3 |
| D | 1 | 52 | 2567905 | 5375.55 | 1976 | 1920 | 477.3 |
| D | 2 | 244 | 84540 | 173.08 | 1976 | 1920 | 477.3 |
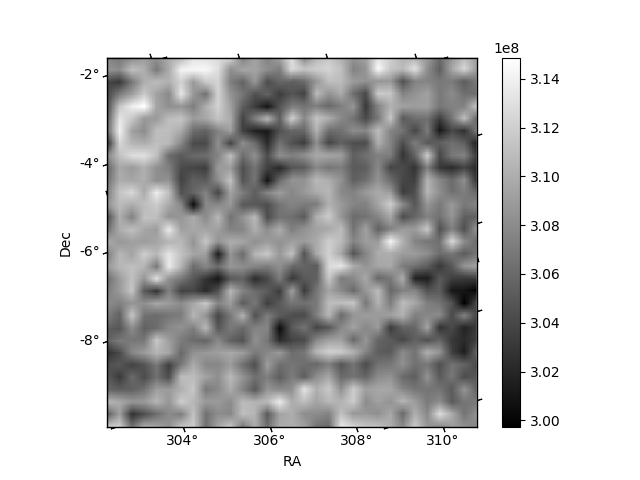
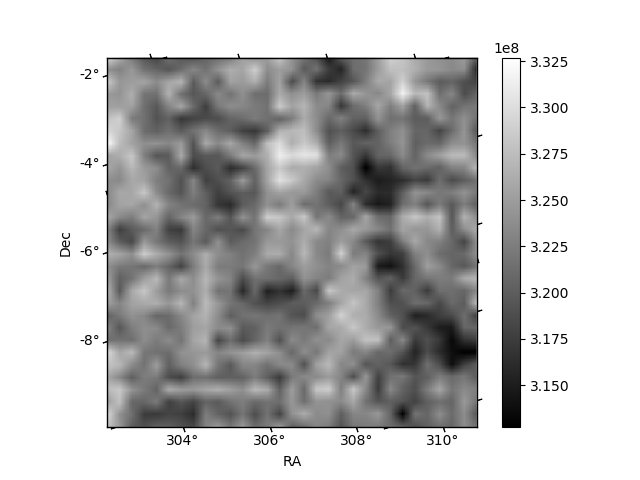
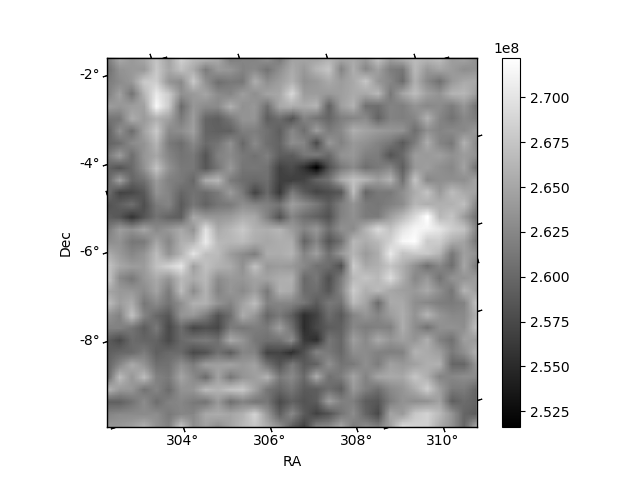
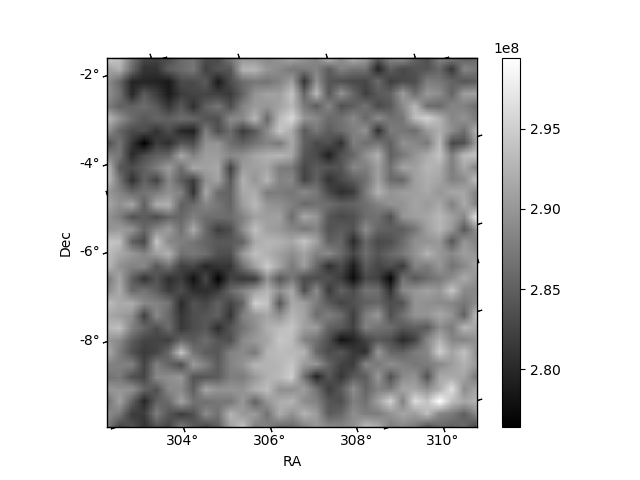
Histogram calculated using DETX and DETY for each event in the final _common_clean file
| Quadrant A | 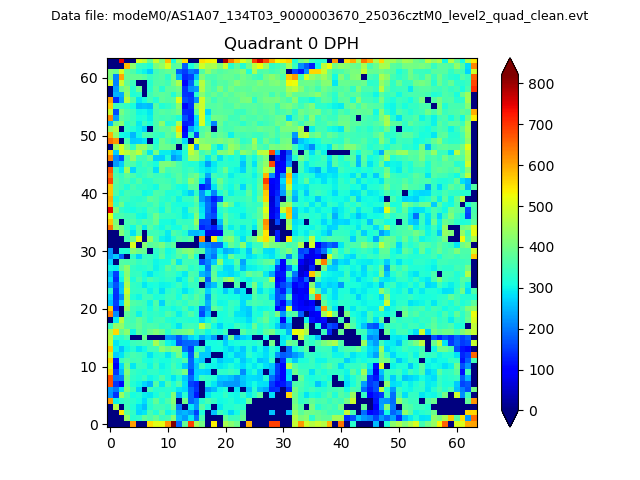 |
 |
Quadrant B |
|---|---|---|---|
| Quadrant D | 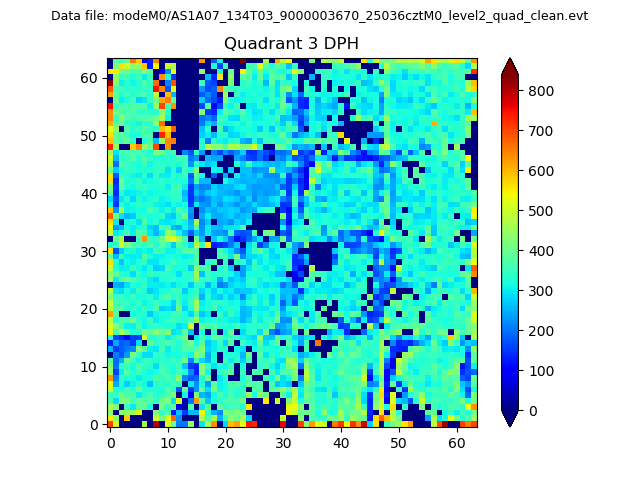 |
 |
Quadrant C |
| Plot type | Count rate plots | Images |
|---|---|---|
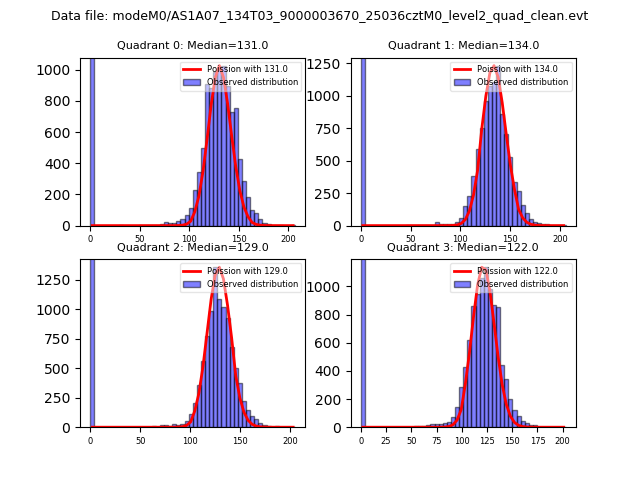
| Comparison with Poisson distribution Blue bars denote a histogram of data divided into 1 sec bins. Red curve is a Poisson curve with rate = median count rate of data. |
 |
 |
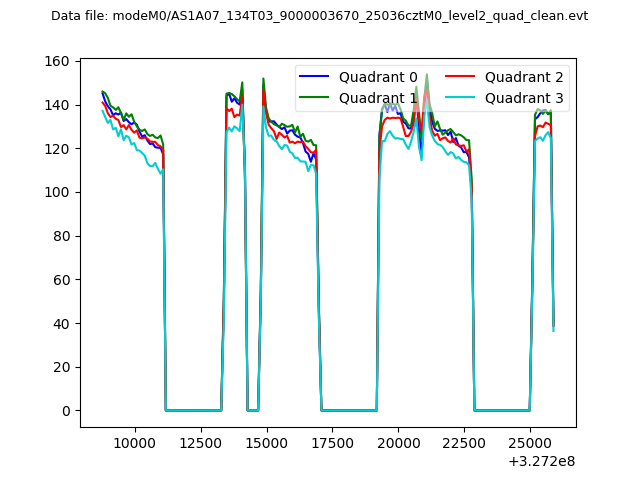
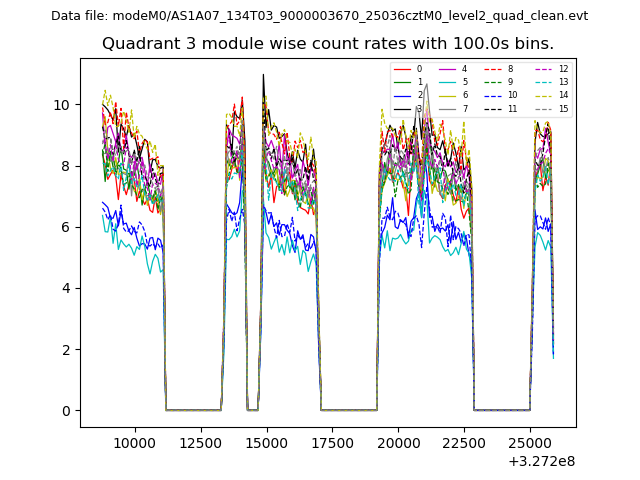
| Quadrant-wise count rates Data is divided into 100 sec bins |
 |
|
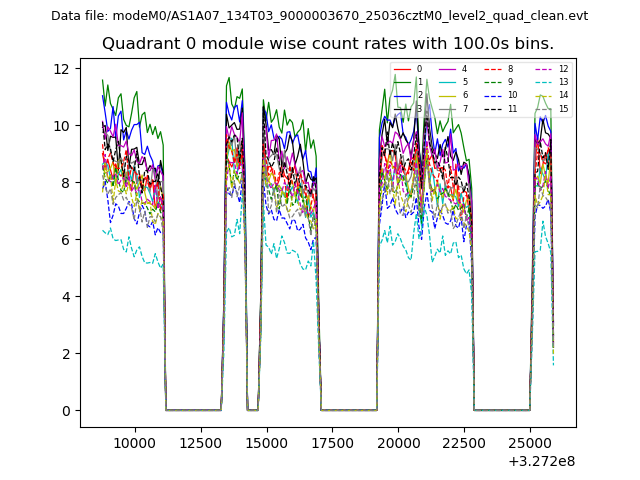
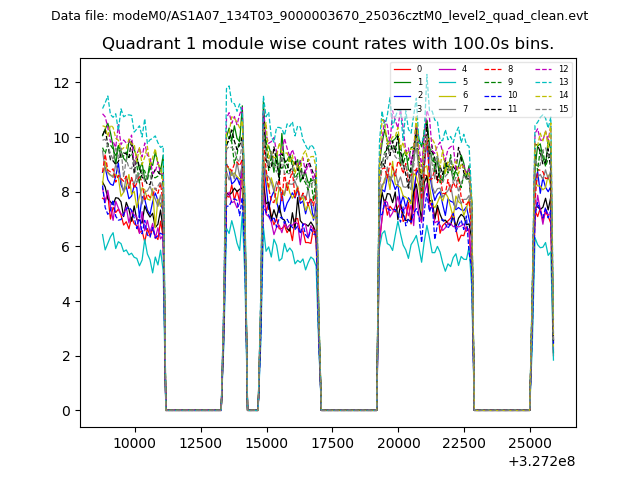
| Module-wise count rates for Quadrant A Data is divided into 100 sec bins |
 |
 |
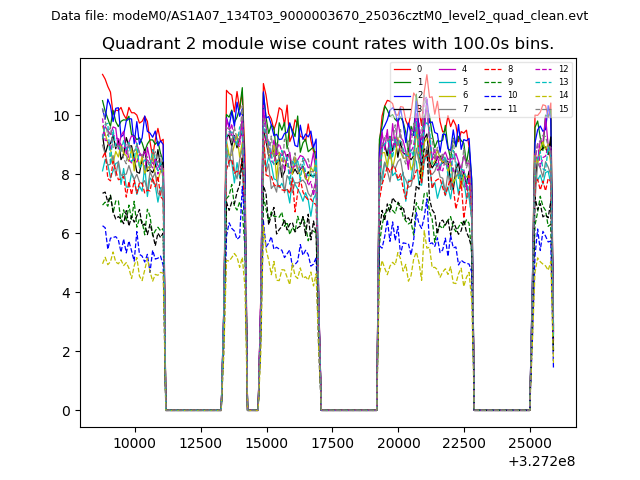
| Module-wise count rates for Quadrant B Data is divided into 100 sec bins |
 |
 |
| Module-wise count rates for Quadrant C Data is divided into 100 sec bins |
 |
 |
| Module-wise count rates for Quadrant D Data is divided into 100 sec bins |
 |
 |
| Parameter | Plot |
|---|---|
| CZT HV Monitor | 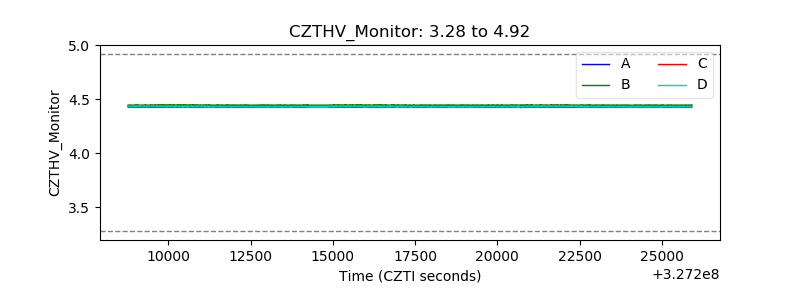 |
| D_VDD |  |
| Temperature 1 | 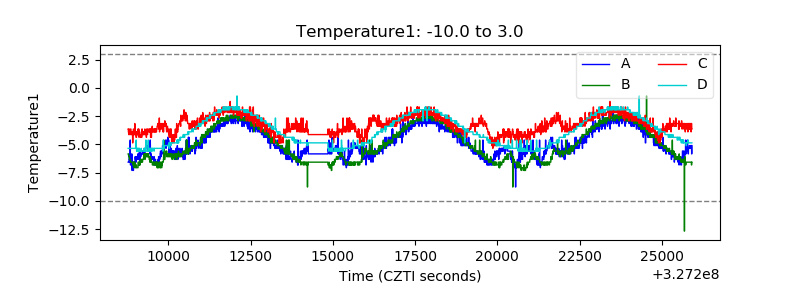 |
| Veto HV Monitor | 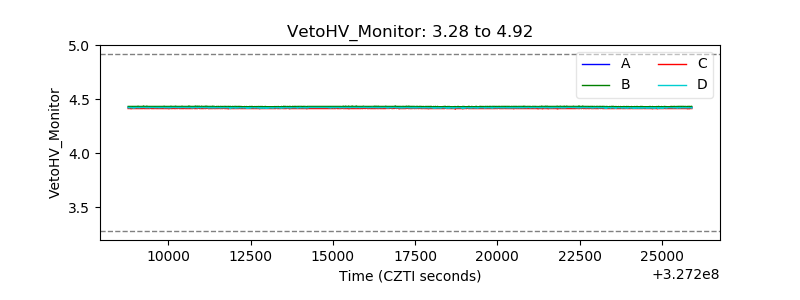 |
| Veto LLD | 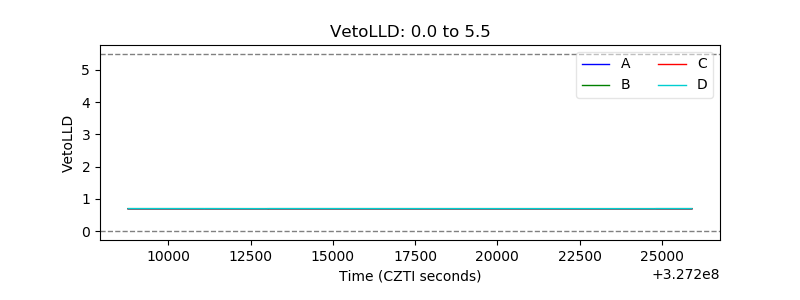 |
| Alpha Counter | 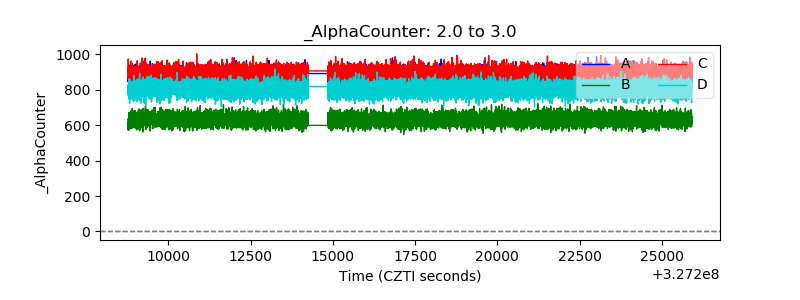 |
| _CPM_Rate | 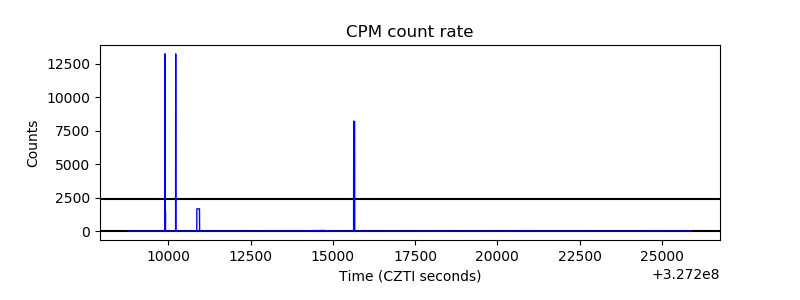 |
| CZT Counter | 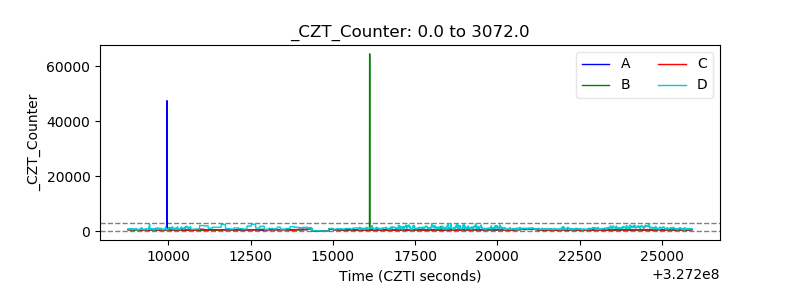 |
| +2.5 Volts monitor |  |
| +5 Volts monitor |  |
| _ROLL_ROT | 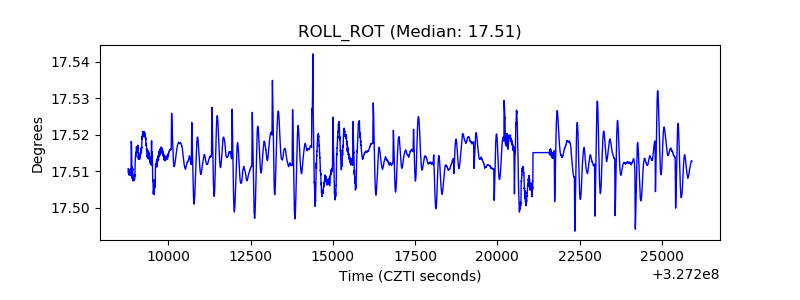 |
| _Roll_DEC | 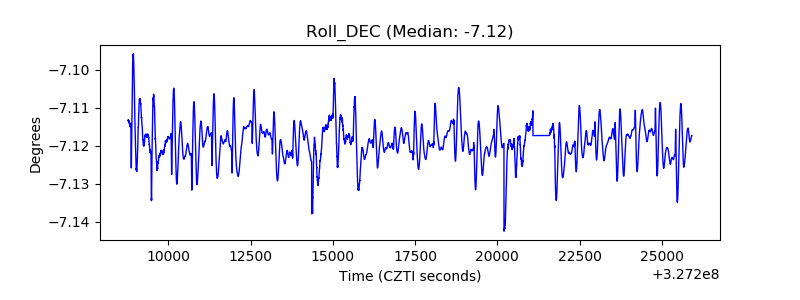 |
| _Roll_RA | 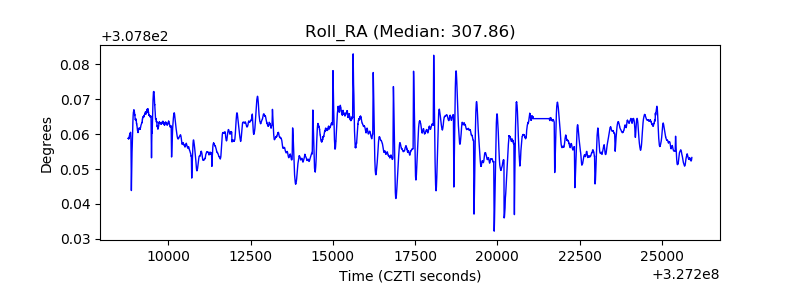 |
| Veto Counter | 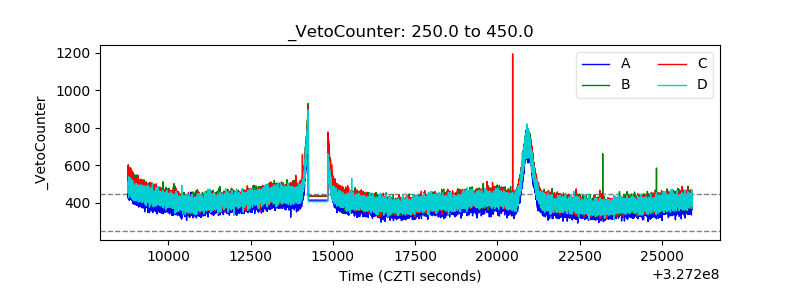 |