| Param | Original file | Final file |
|---|---|---|
| Filename | modeM0/AS1T03_206T01_9000003672cztM0_level2.fits | modeM0/AS1T03_206T01_9000003672cztM0_level2_quad_clean.evt |
| Size (bytes) | 557,962,560 | 357,096,960 |
| Size | 532.1 MB | 340.6 MB |
| Events in quadrant A | 3,505,633 | 1,867,144 |
| Events in quadrant B | 3,361,127 | 1,869,106 |
| Events in quadrant C | 3,361,157 | 1,754,032 |
| Events in quadrant D | 2,835,412 | 1,487,104 |
| Mode M9 | |||
|---|---|---|---|
| Quadrant | BADHDUFLAG | Total packets | Discarded packets |
| A | 0 | 111 | 0 |
| B | 0 | 111 | 0 |
| C | 0 | 110 | 0 |
| D | 0 | 110 | 0 |
| Mode SS | |||
|---|---|---|---|
| Quadrant | BADHDUFLAG | Total packets | Discarded packets |
| A | 0 | 1138 | 0 |
| B | 0 | 1138 | 0 |
| C | 0 | 1140 | 0 |
| D | 0 | 1142 | 0 |
| Mode M0 | |||
|---|---|---|---|
| Quadrant | BADHDUFLAG | Total packets | Discarded packets |
| A | 0 | 118056 | 0 |
| B | 0 | 120105 | 0 |
| C | 0 | 120549 | 0 |
| D | 0 | 185497 | 0 |
| Quadrant | Total seconds | Saturated seconds | Saturation percentage |
|---|---|---|---|
| A | 55939 | 512 | 0.915283% |
| B | 55915 | 675 | 1.207189% |
| C | 55829 | 815 | 1.459815% |
| D | 55831 | 3376 | 6.046820% |
Noise dominated data is calculated using 1-second bins in cleaned event files. If a bin has >2000 counts, and if more than 50% of those come from <1% of pixels, then it is considered to be noise-dominated and hence unusable.
| Quadrant | # 1 sec bins | Bins with >0 counts | Bins with >2000 counts | High rate bins dominated by noise | Noise dominated (total time) | Noise dominated (detector-on time) | Marked lightcurve |
|---|---|---|---|---|---|---|---|
| A | 69171 | 56143 | 0 | 0 | 0.00% | 0.00% |  |
| B | 69171 | 56140 | 0 | 0 | 0.00% | 0.00% |  |
| C | 69171 | 55987 | 0 | 0 | 0.00% | 0.00% |  |
| D | 69171 | 55970 | 0 | 0 | 0.00% | 0.00% |  |
Top three noisy pixels from each quadrant. If the there are fewer than three noisy pixels in the level2.evt file, extra rows are filled as -1
| Pixel properties | Quadrant properties | ||||||
|---|---|---|---|---|---|---|---|
| Quadrant | DetID | PixID | Counts | Sigma | Mean | Median | Sigma |
| A | 0 | 29 | 3419 | 11.46 | 912 | 857 | 223.5 |
| A | 7 | 110 | 2808 | 8.73 | 912 | 857 | 223.5 |
| A | 0 | 30 | 2659 | 8.06 | 912 | 857 | 223.5 |
| B | 2 | 9 | 2643 | 10.28 | 890 | 851 | 174.4 |
| B | 2 | 8 | 2231 | 7.91 | 890 | 851 | 174.4 |
| B | 5 | 128 | 2196 | 7.71 | 890 | 851 | 174.4 |
| C | 1 | 81 | 2563 | 7.64 | 887 | 830 | 226.8 |
| C | 1 | 80 | 2483 | 7.29 | 887 | 830 | 226.8 |
| C | 3 | 126 | 2342 | 6.67 | 887 | 830 | 226.8 |
| D | 15 | 46 | 1997 | 5.87 | 811 | 737 | 214.4 |
| D | 7 | 3 | 1993 | 5.86 | 811 | 737 | 214.4 |
| D | 4 | 160 | 1966 | 5.73 | 811 | 737 | 214.4 |
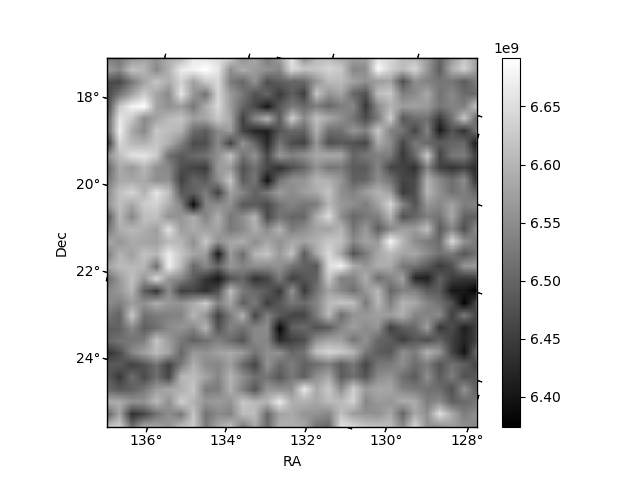
Histogram calculated using DETX and DETY for each event in the final _common_clean file
| Quadrant A | 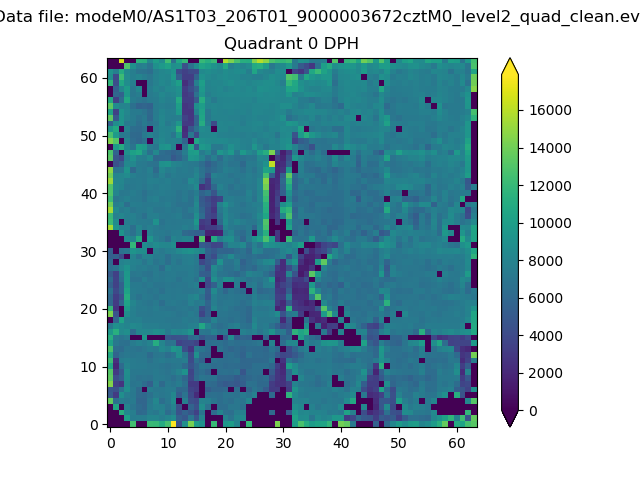 |
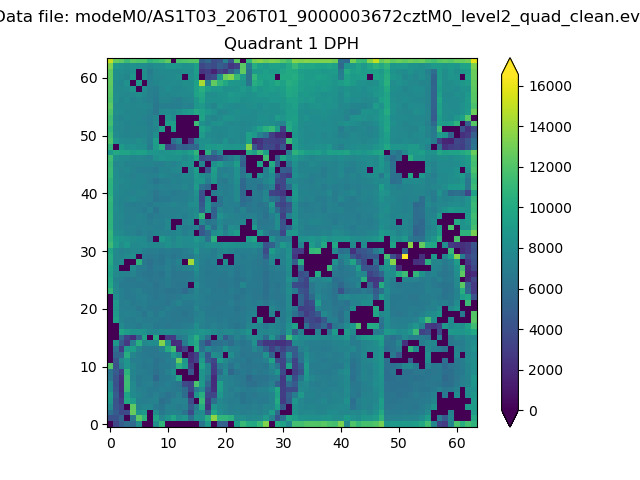 |
Quadrant B |
|---|---|---|---|
| Quadrant D |  |
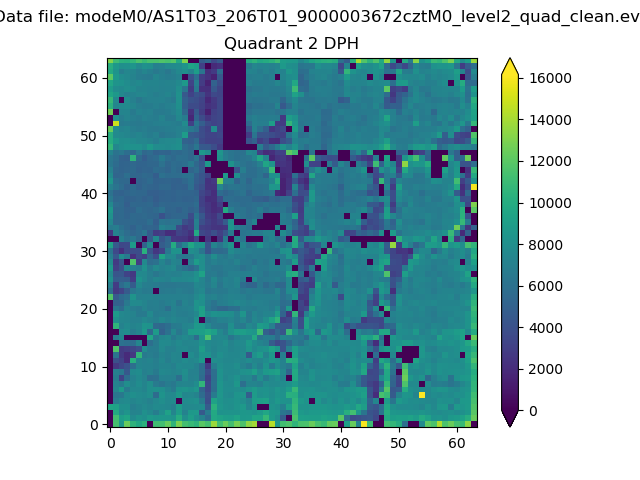 |
Quadrant C |
| Plot type | Count rate plots | Images |
|---|---|---|
| Comparison with Poisson distribution Blue bars denote a histogram of data divided into 1 sec bins. Red curve is a Poisson curve with rate = median count rate of data. |
 |
 |
| Quadrant-wise count rates Data is divided into 100 sec bins |
 |
|
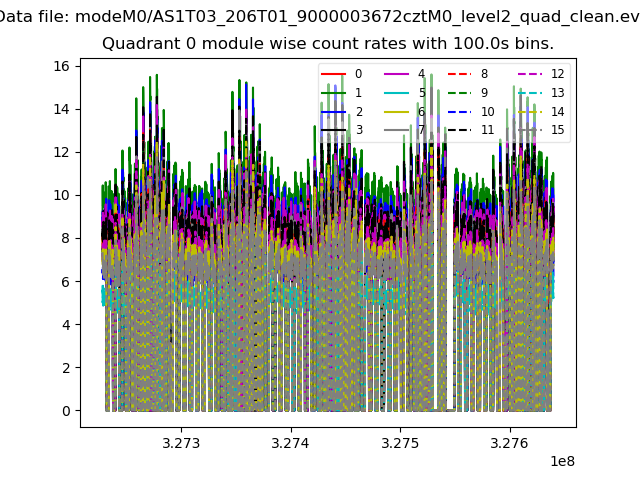
| Module-wise count rates for Quadrant A Data is divided into 100 sec bins |
 |
 |
| Module-wise count rates for Quadrant B Data is divided into 100 sec bins |
 |
 |
| Module-wise count rates for Quadrant C Data is divided into 100 sec bins |
 |
 |
| Module-wise count rates for Quadrant D Data is divided into 100 sec bins |
 |
 |
| Parameter | Plot |
|---|---|
| CZT HV Monitor |  |
| D_VDD | 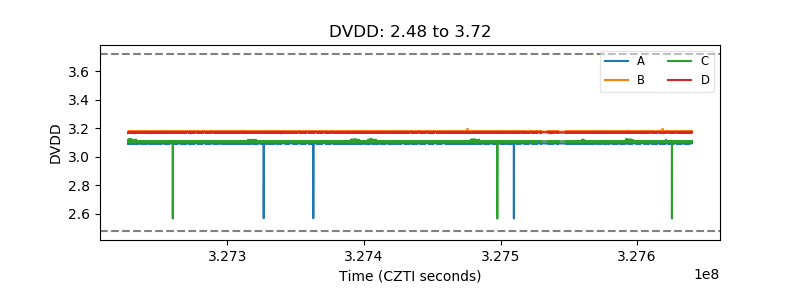 |
| Temperature 1 |  |
| Veto HV Monitor |  |
| Veto LLD | 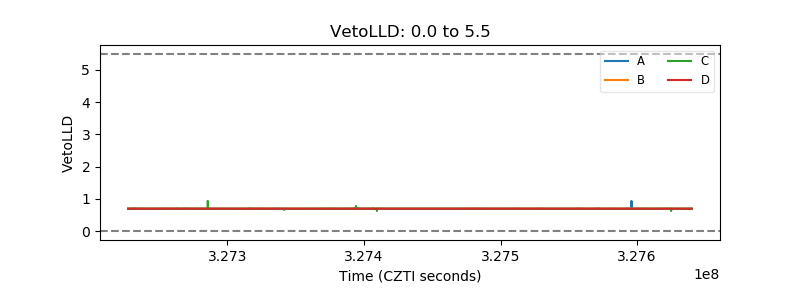 |
| Alpha Counter |  |
| _CPM_Rate |  |
| CZT Counter |  |
| +2.5 Volts monitor |  |
| +5 Volts monitor |  |
| _ROLL_ROT | 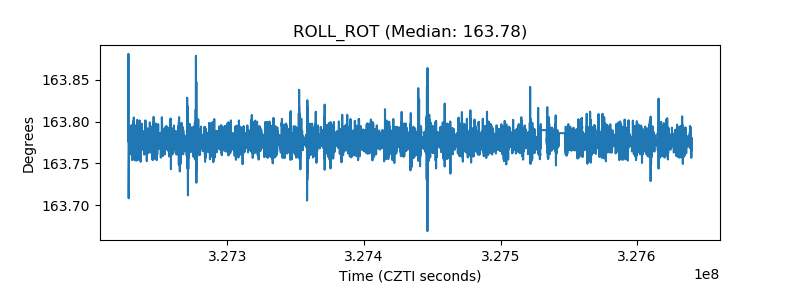 |
| _Roll_DEC |  |
| _Roll_RA |  |
| Veto Counter |  |