| Param | Original file | Final file |
|---|---|---|
| Filename | modeM0/AS1T03_206T01_9000003672_25035cztM0_level2.evt | modeM0/AS1T03_206T01_9000003672_25035cztM0_level2_quad_clean.evt |
| Size (bytes) | 1,583,593,920 | 235,560,960 |
| Size | 1.5 GB | 224.6 MB |
| Events in quadrant A | 8,578,119 | 1,529,673 |
| Events in quadrant B | 8,980,651 | 1,542,237 |
| Events in quadrant C | 8,918,759 | 1,477,600 |
| Events in quadrant D | 20,267,523 | 1,342,430 |
| Mode M9 | |||
|---|---|---|---|
| Quadrant | BADHDUFLAG | Total packets | Discarded packets |
| A | 0 | 18 | 0 |
| B | 0 | 18 | 0 |
| C | 0 | 18 | 0 |
| D | 0 | 18 | 0 |
| Mode SS | |||
|---|---|---|---|
| Quadrant | BADHDUFLAG | Total packets | Discarded packets |
| A | 0 | 364 | 0 |
| B | 0 | 364 | 0 |
| C | 0 | 364 | 0 |
| D | 0 | 364 | 0 |
| Mode M0 | |||
|---|---|---|---|
| Quadrant | BADHDUFLAG | Total packets | Discarded packets |
| A | 0 | 37225 | 3 |
| B | 0 | 38117 | 3 |
| C | 0 | 37648 | 3 |
| D | 0 | 72615 | 3 |
| Quadrant | Total seconds | Saturated seconds | Saturation percentage |
|---|---|---|---|
| A | 18028 | 195 | 1.081651% |
| B | 18029 | 261 | 1.447668% |
| C | 18029 | 293 | 1.625159% |
| D | 18029 | 2161 | 11.986244% |
Noise dominated data is calculated using 1-second bins in cleaned event files. If a bin has >2000 counts, and if more than 50% of those come from <1% of pixels, then it is considered to be noise-dominated and hence unusable.
| Quadrant | # 1 sec bins | Bins with >0 counts | Bins with >2000 counts | High rate bins dominated by noise | Noise dominated (total time) | Noise dominated (detector-on time) | Marked lightcurve |
|---|---|---|---|---|---|---|---|
| A | 19733 | 18031 | 1 | 1 | 0.01% | 0.01% | 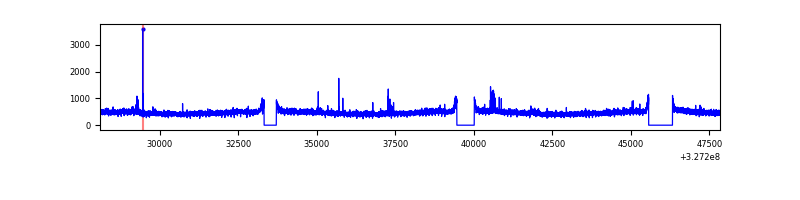 |
| B | 19734 | 18030 | 25 | 25 | 0.13% | 0.14% | 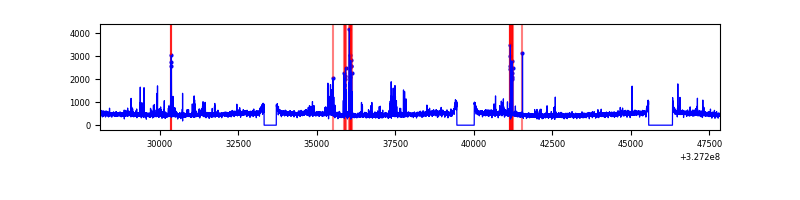 |
| C | 19734 | 18032 | 8 | 8 | 0.04% | 0.04% | 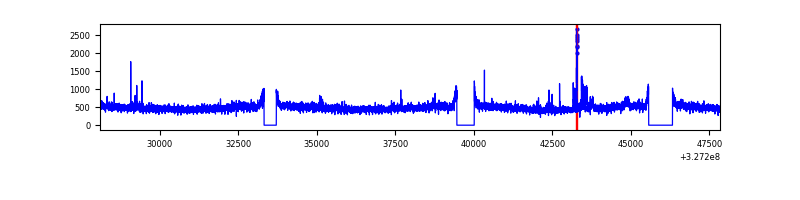 |
| D | 19734 | 18030 | 1582 | 1582 | 8.02% | 8.77% | 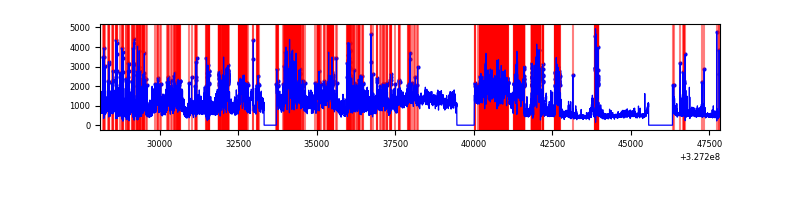 |
Top three noisy pixels from each quadrant. If the there are fewer than three noisy pixels in the level2.evt file, extra rows are filled as -1
| Pixel properties | Quadrant properties | ||||||
|---|---|---|---|---|---|---|---|
| Quadrant | DetID | PixID | Counts | Sigma | Mean | Median | Sigma |
| A | 11 | 208 | 74628 | 163.85 | 2181 | 2133 | 442.4 |
| A | 4 | 2 | 66900 | 146.38 | 2181 | 2133 | 442.4 |
| A | 15 | 174 | 35424 | 75.24 | 2181 | 2133 | 442.4 |
| B | 0 | 245 | 148278 | 353.28 | 2165 | 2111 | 413.7 |
| B | 3 | 64 | 89163 | 210.4 | 2165 | 2111 | 413.7 |
| B | 15 | 33 | 87204 | 205.67 | 2165 | 2111 | 413.7 |
| C | 7 | 247 | 373770 | 753.96 | 2093 | 2102 | 493.0 |
| C | 14 | 238 | 330324 | 665.83 | 2093 | 2102 | 493.0 |
| C | 2 | 16 | 20624 | 37.57 | 2093 | 2102 | 493.0 |
| D | 7 | 238 | 5378637 | 10844.12 | 2043 | 1989 | 495.8 |
| D | 8 | 195 | 4537345 | 9147.32 | 2043 | 1989 | 495.8 |
| D | 1 | 52 | 1986319 | 4002.18 | 2043 | 1989 | 495.8 |
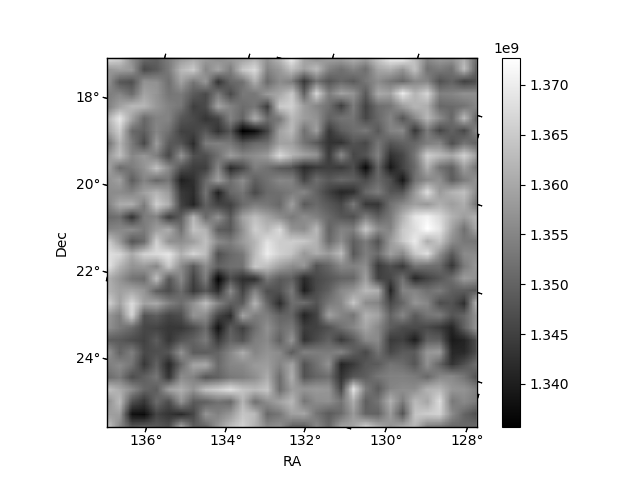
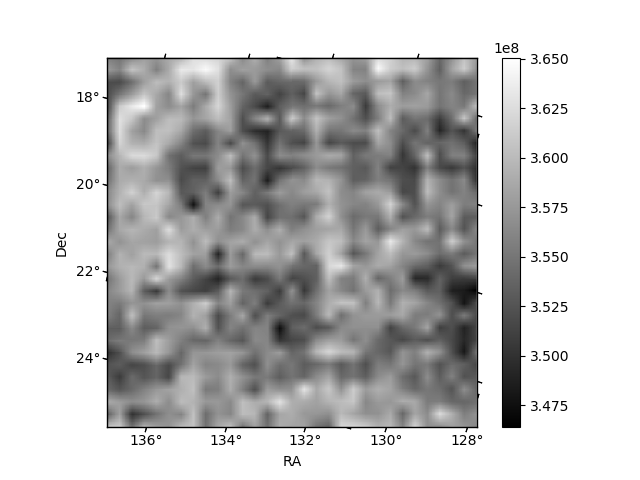
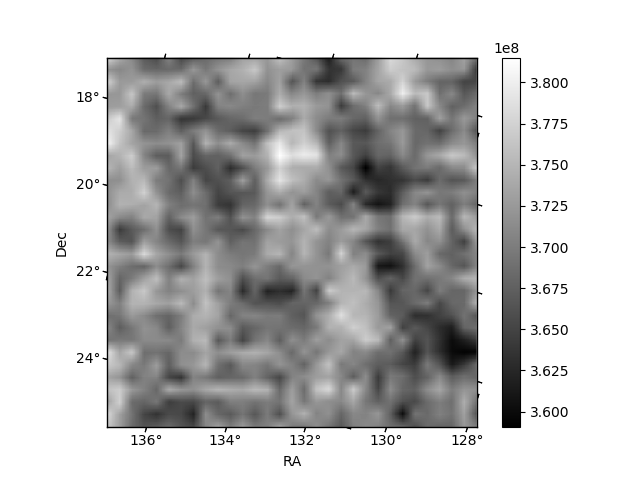
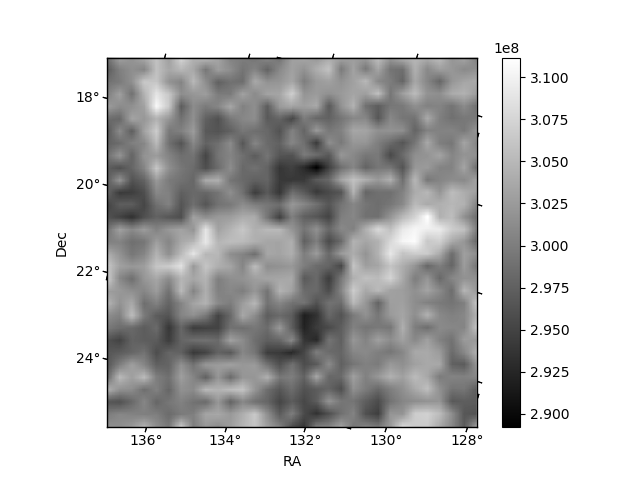
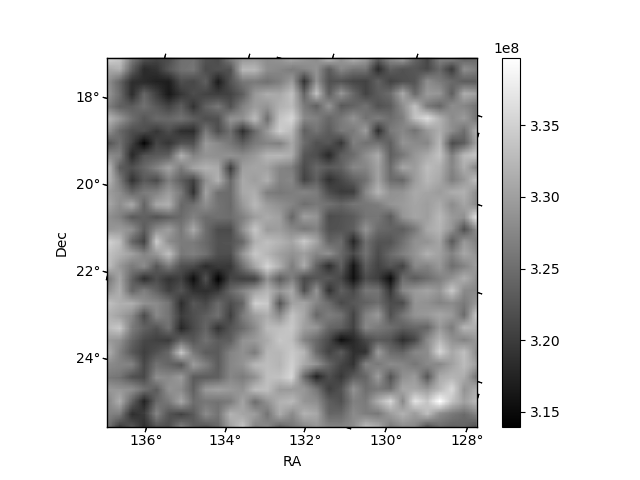
Histogram calculated using DETX and DETY for each event in the final _common_clean file
| Quadrant A | 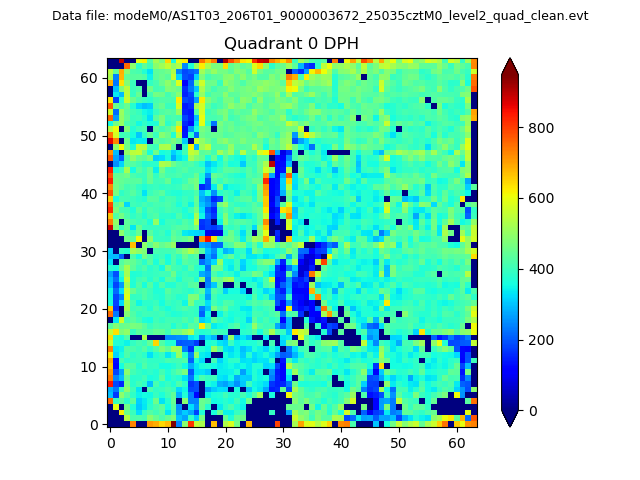 |
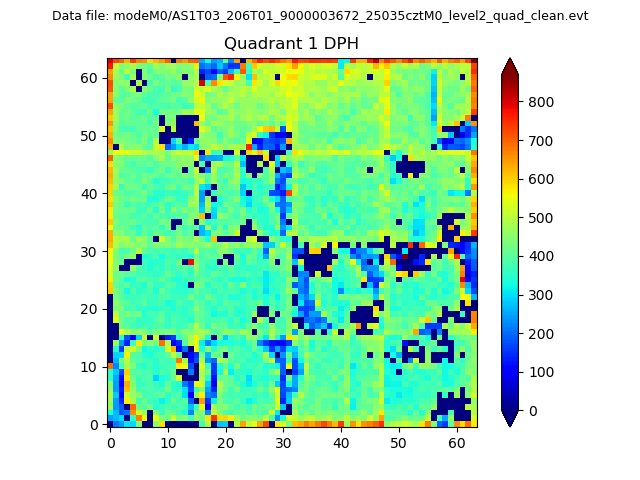 |
Quadrant B |
|---|---|---|---|
| Quadrant D | 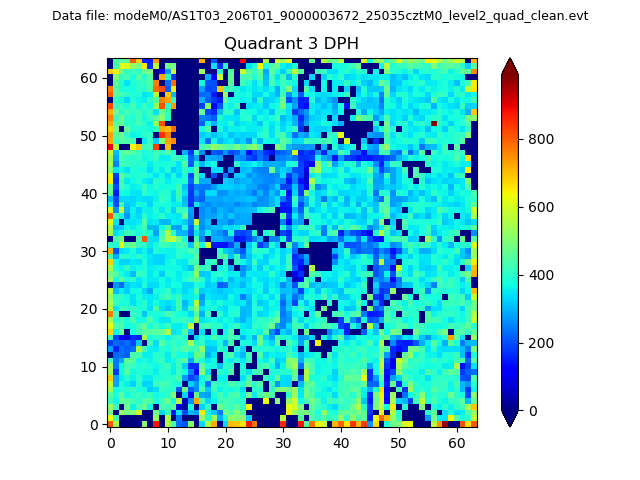 |
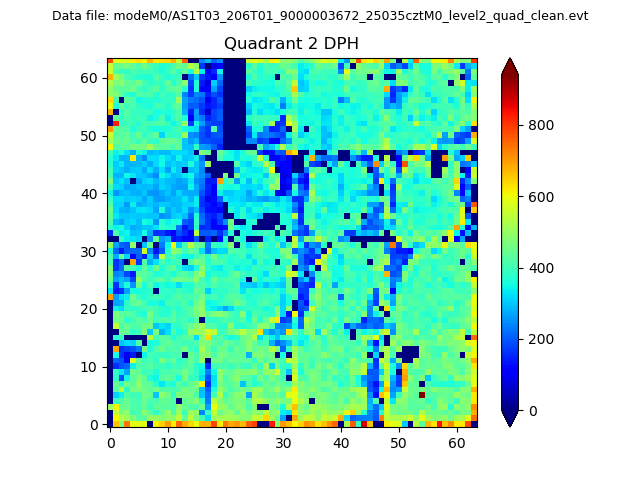 |
Quadrant C |
| Plot type | Count rate plots | Images |
|---|---|---|
| Comparison with Poisson distribution Blue bars denote a histogram of data divided into 1 sec bins. Red curve is a Poisson curve with rate = median count rate of data. |
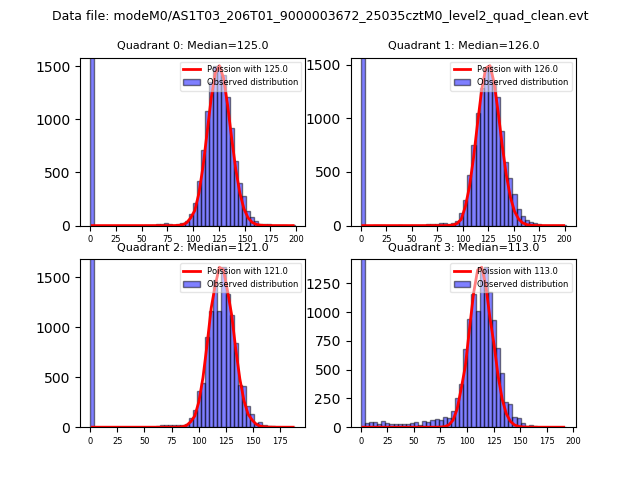 |
 |
| Quadrant-wise count rates Data is divided into 100 sec bins |
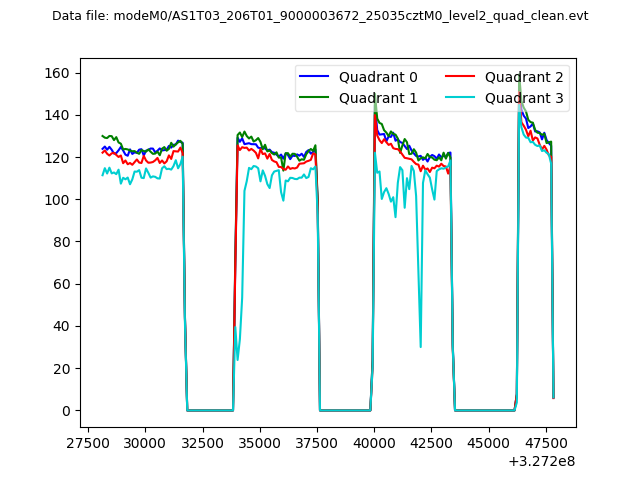 |
|
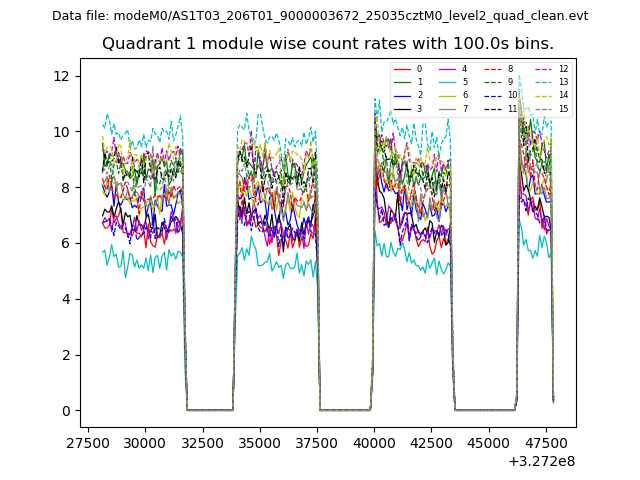
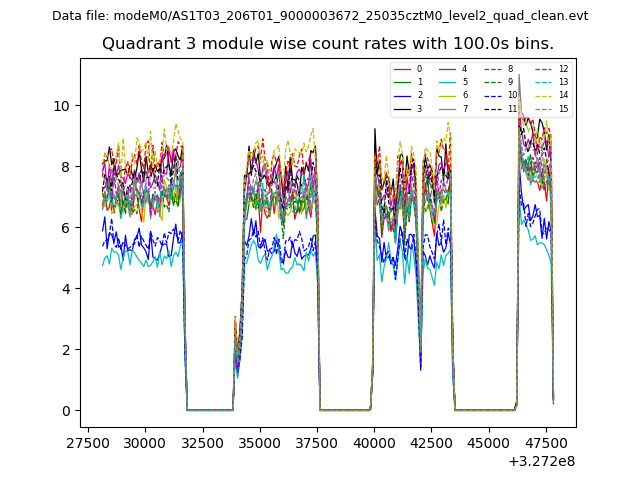
| Module-wise count rates for Quadrant A Data is divided into 100 sec bins |
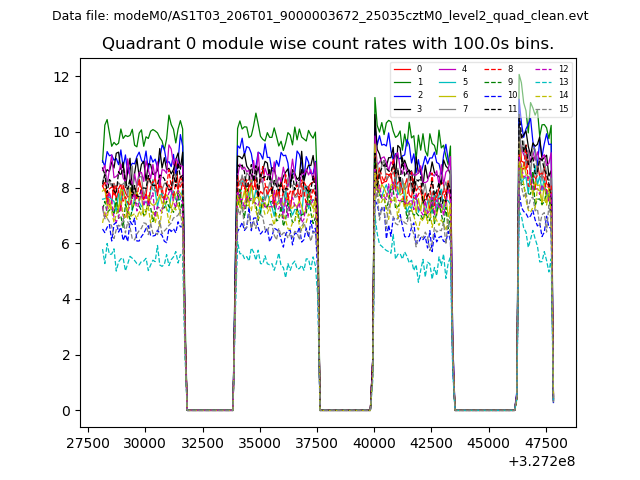 |
 |
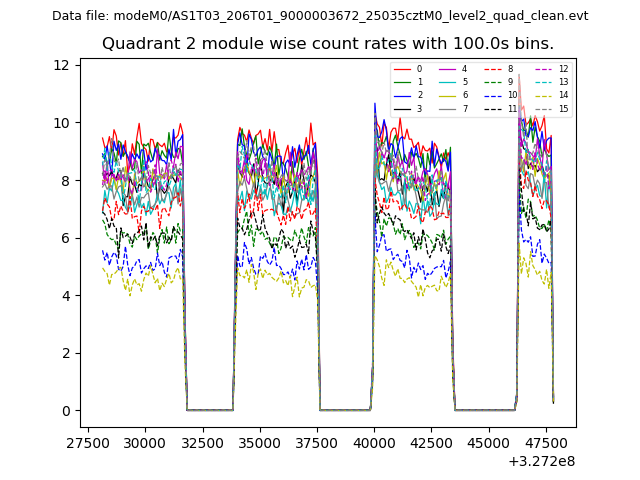
| Module-wise count rates for Quadrant B Data is divided into 100 sec bins |
 |
 |
| Module-wise count rates for Quadrant C Data is divided into 100 sec bins |
 |
 |
| Module-wise count rates for Quadrant D Data is divided into 100 sec bins |
 |
 |
| Parameter | Plot |
|---|---|
| CZT HV Monitor | 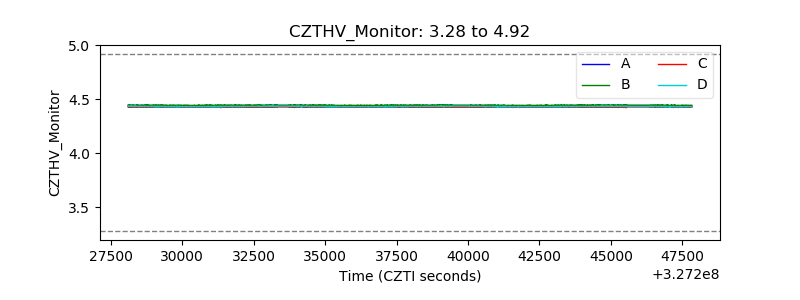 |
| D_VDD | 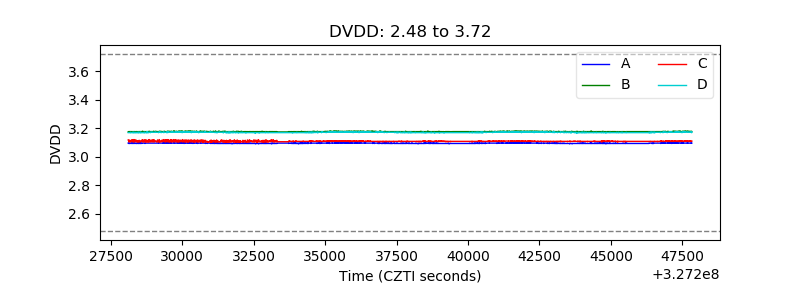 |
| Temperature 1 | 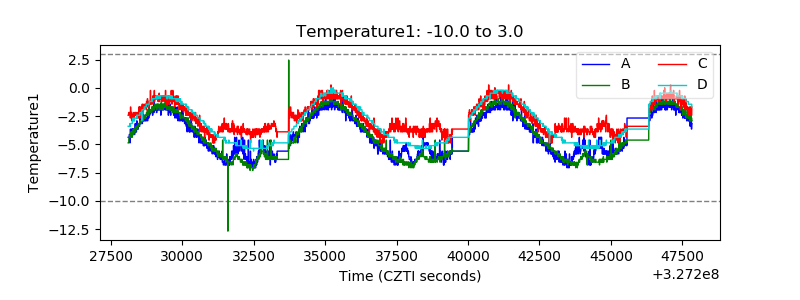 |
| Veto HV Monitor | 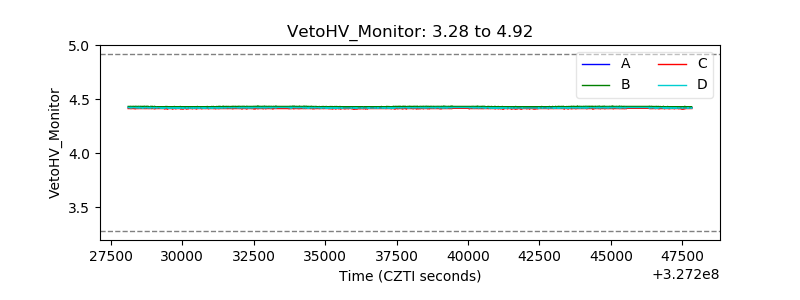 |
| Veto LLD | 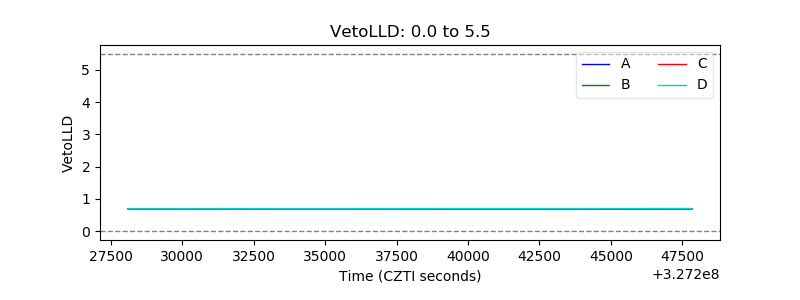 |
| Alpha Counter | 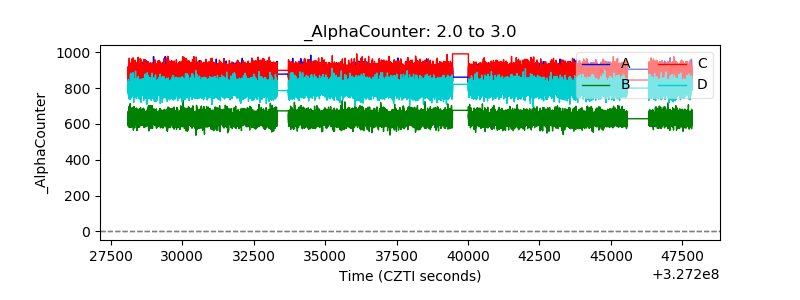 |
| _CPM_Rate | 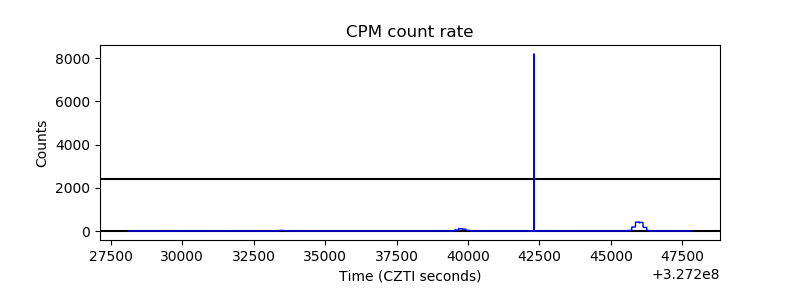 |
| CZT Counter | 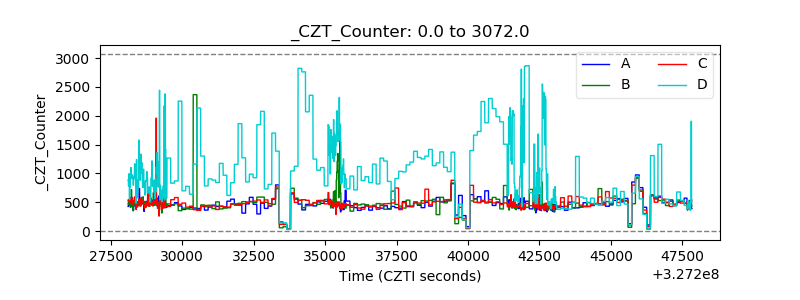 |
| +2.5 Volts monitor |  |
| +5 Volts monitor |  |
| _ROLL_ROT | 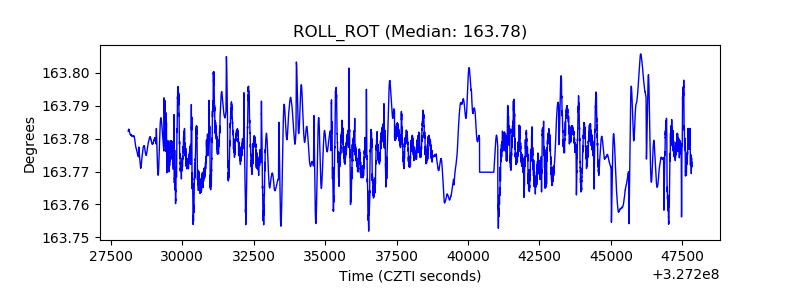 |
| _Roll_DEC | 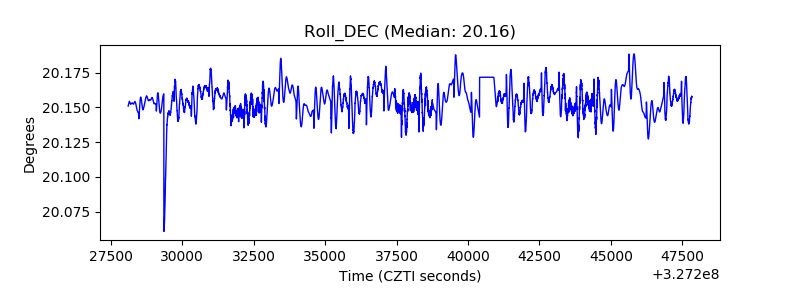 |
| _Roll_RA | 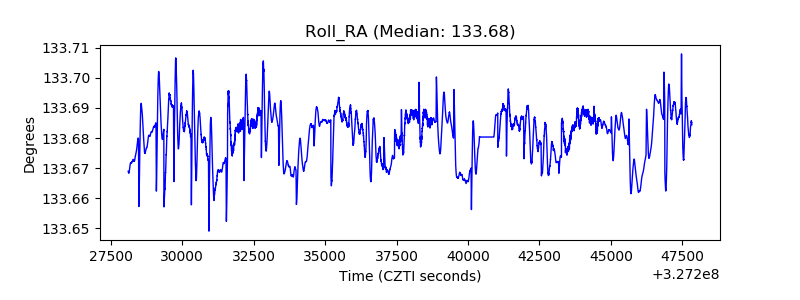 |
| Veto Counter | 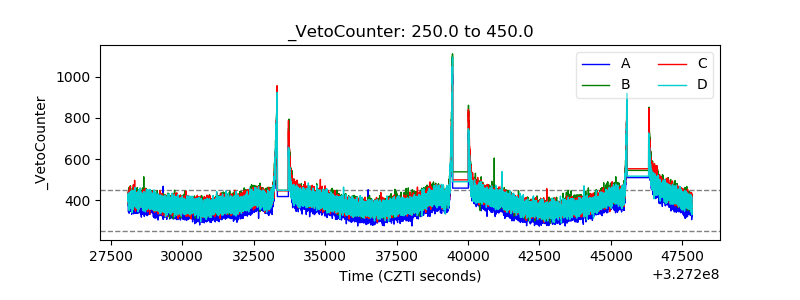 |