| Param | Original file | Final file |
|---|---|---|
| Filename | modeM0/AS1T03_206T01_9000003672_25039cztM0_level2.evt | modeM0/AS1T03_206T01_9000003672_25039cztM0_level2_quad_clean.evt |
| Size (bytes) | 467,182,080 | 88,721,280 |
| Size | 445.5 MB | 84.6 MB |
| Events in quadrant A | 3,031,884 | 582,001 |
| Events in quadrant B | 3,182,678 | 597,172 |
| Events in quadrant C | 3,189,703 | 559,708 |
| Events in quadrant D | 4,328,606 | 520,386 |
| Mode M9 | |||
|---|---|---|---|
| Quadrant | BADHDUFLAG | Total packets | Discarded packets |
| A | 0 | 12 | 0 |
| B | 0 | 12 | 0 |
| C | 0 | 12 | 0 |
| D | 0 | 12 | 0 |
| Mode SS | |||
|---|---|---|---|
| Quadrant | BADHDUFLAG | Total packets | Discarded packets |
| A | 0 | 124 | 0 |
| B | 0 | 124 | 0 |
| C | 0 | 124 | 0 |
| D | 0 | 124 | 0 |
| Mode M0 | |||
|---|---|---|---|
| Quadrant | BADHDUFLAG | Total packets | Discarded packets |
| A | 0 | 12838 | 1 |
| B | 0 | 13312 | 1 |
| C | 0 | 13184 | 1 |
| D | 0 | 16893 | 1 |
| Quadrant | Total seconds | Saturated seconds | Saturation percentage |
|---|---|---|---|
| A | 6124 | 28 | 0.457218% |
| B | 6125 | 37 | 0.604082% |
| C | 6125 | 67 | 1.093878% |
| D | 6125 | 331 | 5.404082% |
Noise dominated data is calculated using 1-second bins in cleaned event files. If a bin has >2000 counts, and if more than 50% of those come from <1% of pixels, then it is considered to be noise-dominated and hence unusable.
| Quadrant | # 1 sec bins | Bins with >0 counts | Bins with >2000 counts | High rate bins dominated by noise | Noise dominated (total time) | Noise dominated (detector-on time) | Marked lightcurve |
|---|---|---|---|---|---|---|---|
| A | 7359 | 6125 | 0 | 0 | 0.00% | 0.00% | 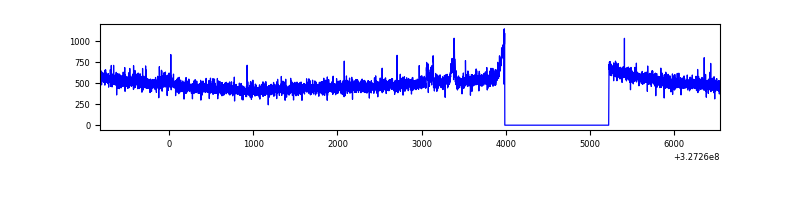 |
| B | 7360 | 6126 | 3 | 3 | 0.04% | 0.05% | 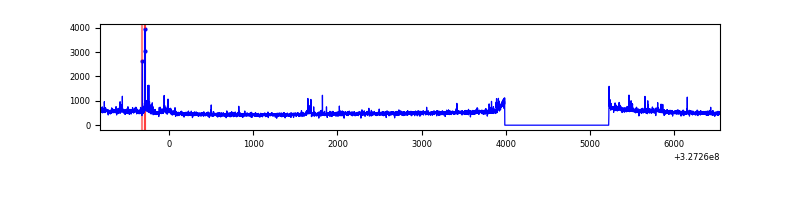 |
| C | 7360 | 6126 | 8 | 8 | 0.11% | 0.13% | 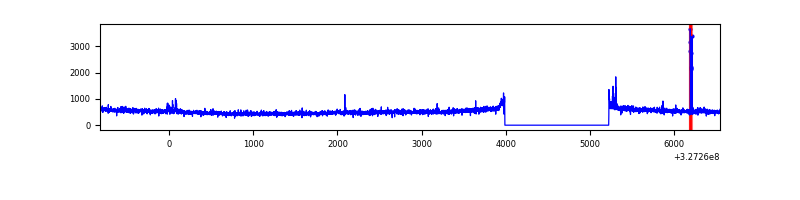 |
| D | 7360 | 6126 | 250 | 250 | 3.40% | 4.08% | 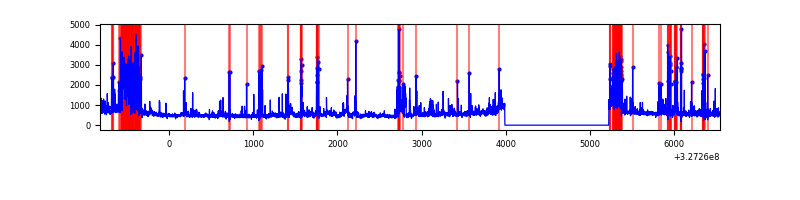 |
Top three noisy pixels from each quadrant. If the there are fewer than three noisy pixels in the level2.evt file, extra rows are filled as -1
| Pixel properties | Quadrant properties | ||||||
|---|---|---|---|---|---|---|---|
| Quadrant | DetID | PixID | Counts | Sigma | Mean | Median | Sigma |
| A | 15 | 174 | 24036 | 149.3 | 774 | 760 | 155.9 |
| A | 11 | 208 | 23415 | 145.32 | 774 | 760 | 155.9 |
| A | 13 | 254 | 10296 | 61.17 | 774 | 760 | 155.9 |
| B | 0 | 190 | 64839 | 436.93 | 778 | 759 | 146.7 |
| B | 5 | 172 | 33147 | 220.84 | 778 | 759 | 146.7 |
| B | 0 | 169 | 20516 | 134.71 | 778 | 759 | 146.7 |
| C | 14 | 238 | 119328 | 677.85 | 744 | 751 | 174.9 |
| C | 7 | 247 | 108116 | 613.75 | 744 | 751 | 174.9 |
| C | 0 | 239 | 36169 | 202.47 | 744 | 751 | 174.9 |
| D | 1 | 52 | 933580 | 5263.85 | 730 | 710 | 177.2 |
| D | 7 | 38 | 118215 | 663.04 | 730 | 710 | 177.2 |
| D | 12 | 233 | 113259 | 635.07 | 730 | 710 | 177.2 |
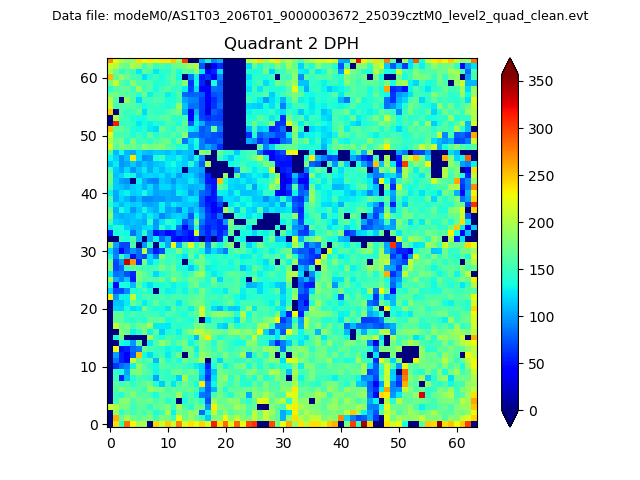
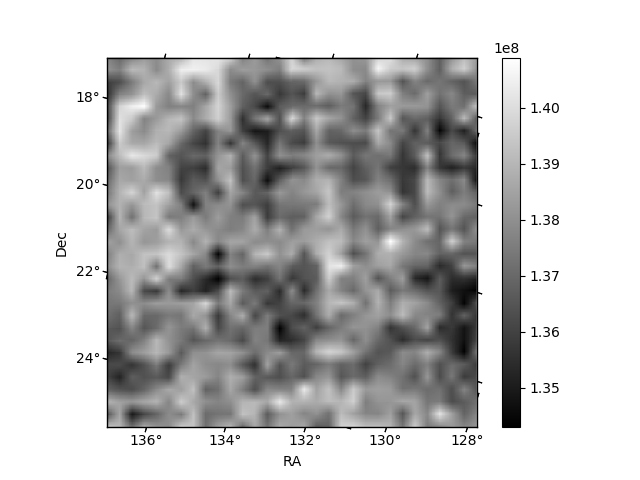
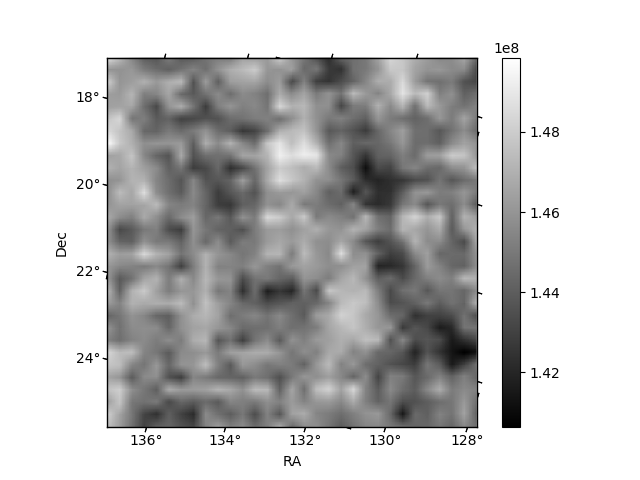
Histogram calculated using DETX and DETY for each event in the final _common_clean file
| Quadrant A | 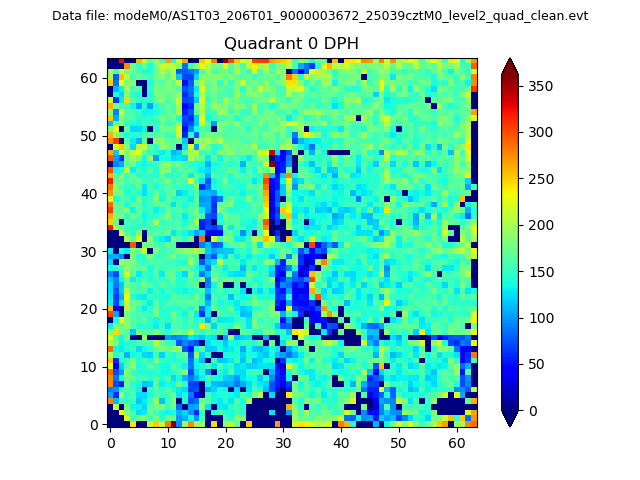 |
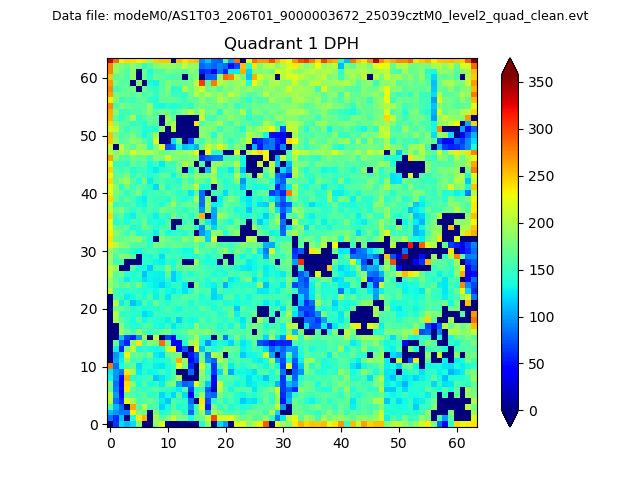 |
Quadrant B |
|---|---|---|---|
| Quadrant D | 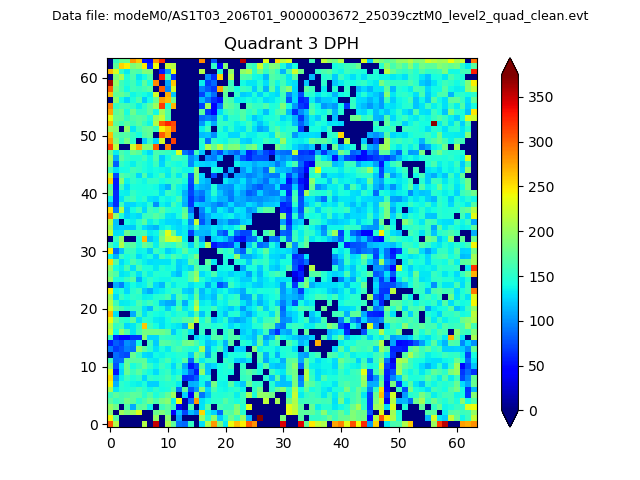 |
 |
Quadrant C |
| Plot type | Count rate plots | Images |
|---|---|---|
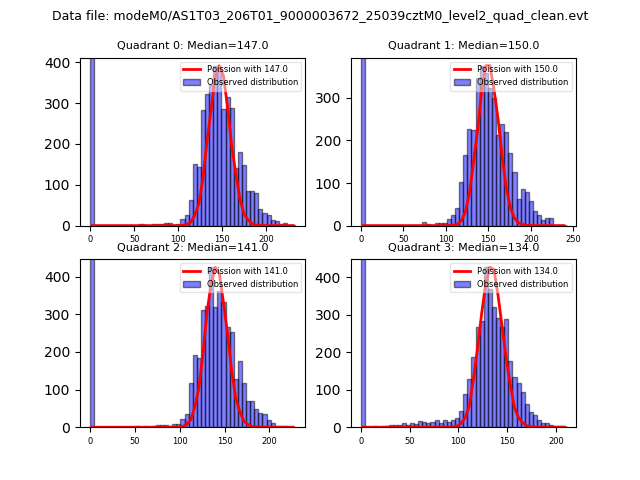
| Comparison with Poisson distribution Blue bars denote a histogram of data divided into 1 sec bins. Red curve is a Poisson curve with rate = median count rate of data. |
 |
 |
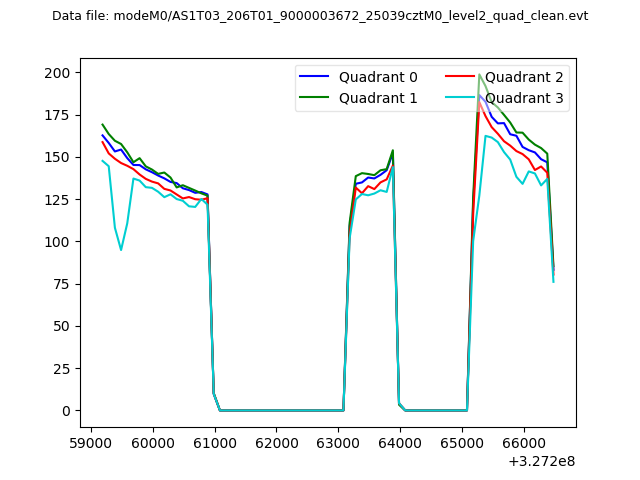
| Quadrant-wise count rates Data is divided into 100 sec bins |
 |
|
| Module-wise count rates for Quadrant A Data is divided into 100 sec bins |
 |
 |
| Module-wise count rates for Quadrant B Data is divided into 100 sec bins |
 |
 |
| Module-wise count rates for Quadrant C Data is divided into 100 sec bins |
 |
 |
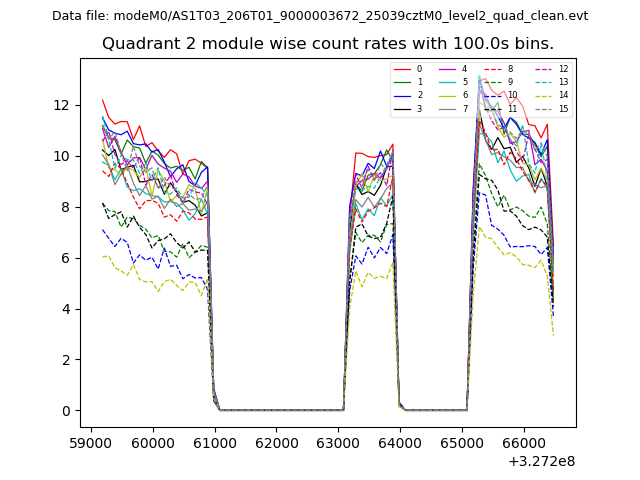
| Module-wise count rates for Quadrant D Data is divided into 100 sec bins |
 |
 |
| Parameter | Plot |
|---|---|
| CZT HV Monitor | 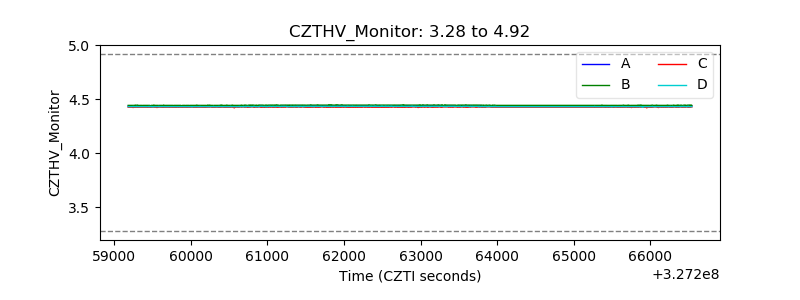 |
| D_VDD | 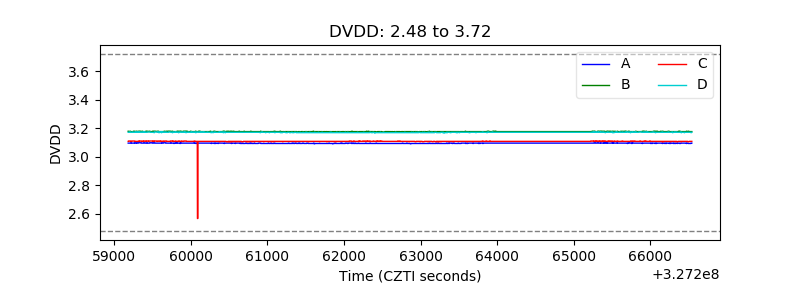 |
| Temperature 1 | 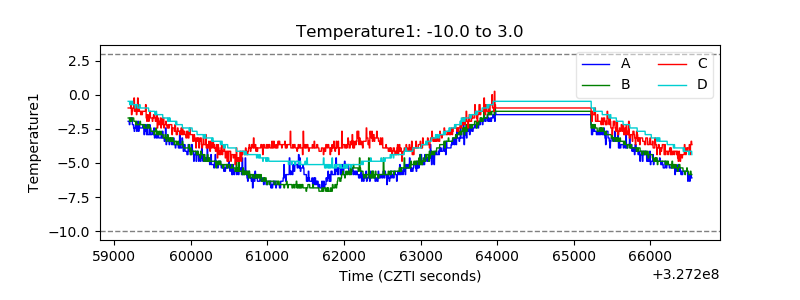 |
| Veto HV Monitor |  |
| Veto LLD | 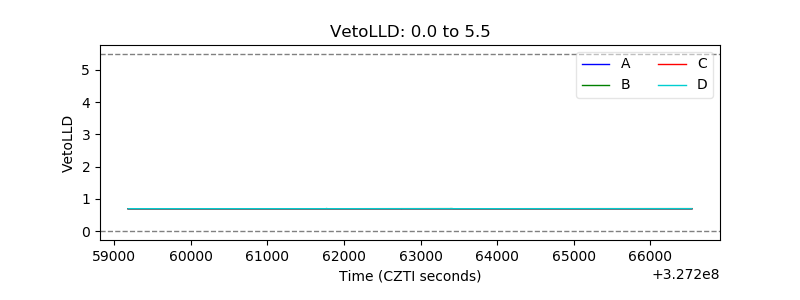 |
| Alpha Counter | 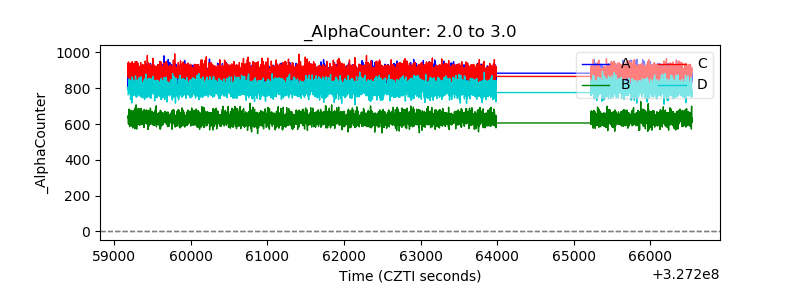 |
| _CPM_Rate | 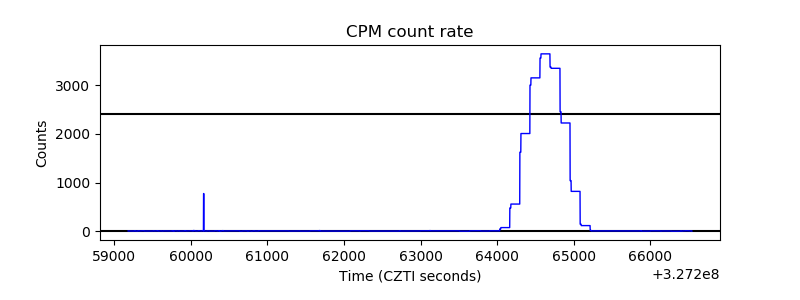 |
| CZT Counter |  |
| +2.5 Volts monitor | 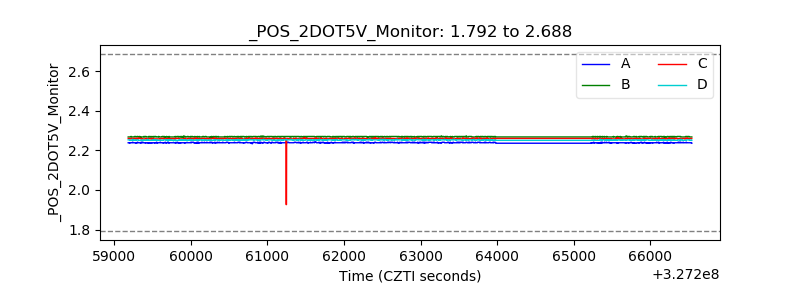 |
| +5 Volts monitor |  |
| _ROLL_ROT | 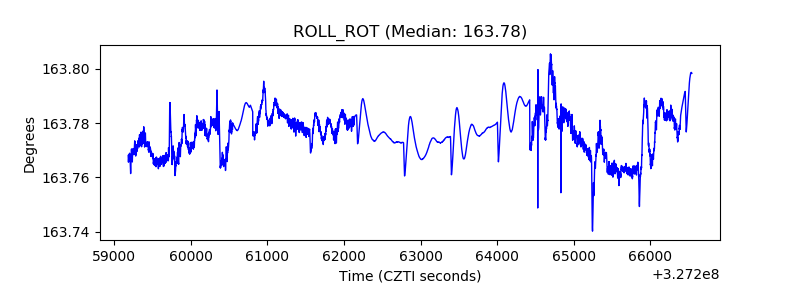 |
| _Roll_DEC | 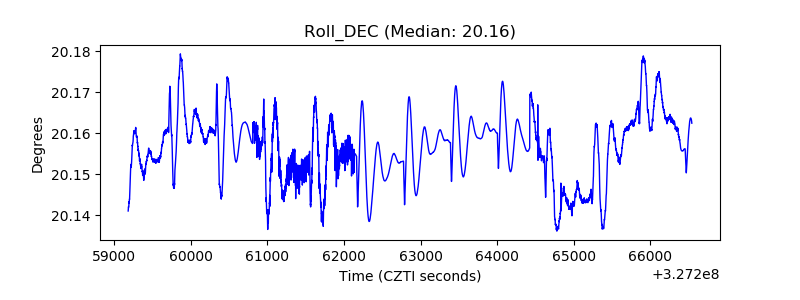 |
| _Roll_RA |  |
| Veto Counter |  |