| Param | Original file | Final file |
|---|---|---|
| Filename | modeM0/AS1T03_206T01_9000003672_25040cztM0_level2.evt | modeM0/AS1T03_206T01_9000003672_25040cztM0_level2_quad_clean.evt |
| Size (bytes) | 519,425,280 | 94,415,040 |
| Size | 495.4 MB | 90.0 MB |
| Events in quadrant A | 3,265,323 | 625,939 |
| Events in quadrant B | 3,361,617 | 649,426 |
| Events in quadrant C | 3,394,714 | 597,615 |
| Events in quadrant D | 5,293,188 | 557,508 |
| Mode M9 | |||
|---|---|---|---|
| Quadrant | BADHDUFLAG | Total packets | Discarded packets |
| A | 0 | 17 | 0 |
| B | 0 | 18 | 0 |
| C | 0 | 18 | 0 |
| D | 0 | 18 | 0 |
| Mode SS | |||
|---|---|---|---|
| Quadrant | BADHDUFLAG | Total packets | Discarded packets |
| A | 0 | 126 | 0 |
| B | 0 | 126 | 0 |
| C | 0 | 126 | 0 |
| D | 0 | 126 | 0 |
| Mode M0 | |||
|---|---|---|---|
| Quadrant | BADHDUFLAG | Total packets | Discarded packets |
| A | 0 | 13520 | 2 |
| B | 0 | 13717 | 2 |
| C | 0 | 13752 | 2 |
| D | 0 | 20081 | 2 |
| Quadrant | Total seconds | Saturated seconds | Saturation percentage |
|---|---|---|---|
| A | 6137 | 45 | 0.733257% |
| B | 6137 | 43 | 0.700668% |
| C | 6136 | 87 | 1.417862% |
| D | 6136 | 245 | 3.992829% |
Noise dominated data is calculated using 1-second bins in cleaned event files. If a bin has >2000 counts, and if more than 50% of those come from <1% of pixels, then it is considered to be noise-dominated and hence unusable.
| Quadrant | # 1 sec bins | Bins with >0 counts | Bins with >2000 counts | High rate bins dominated by noise | Noise dominated (total time) | Noise dominated (detector-on time) | Marked lightcurve |
|---|---|---|---|---|---|---|---|
| A | 7472 | 6138 | 15 | 15 | 0.20% | 0.24% | 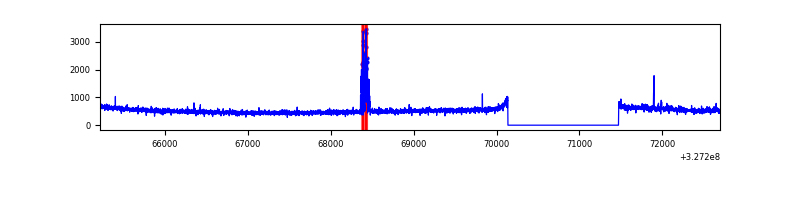 |
| B | 7472 | 6138 | 3 | 3 | 0.04% | 0.05% | 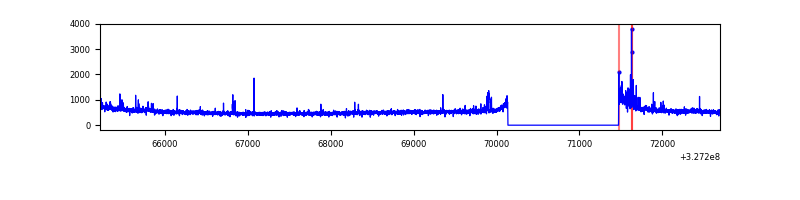 |
| C | 7471 | 6137 | 11 | 11 | 0.15% | 0.18% | 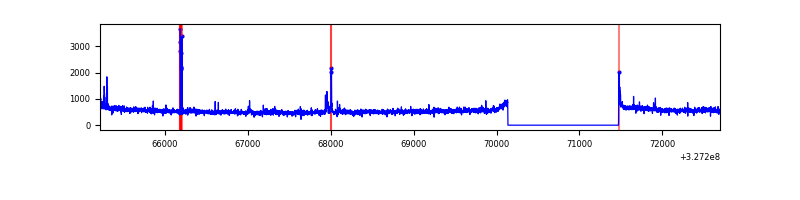 |
| D | 7471 | 6137 | 194 | 194 | 2.60% | 3.16% | 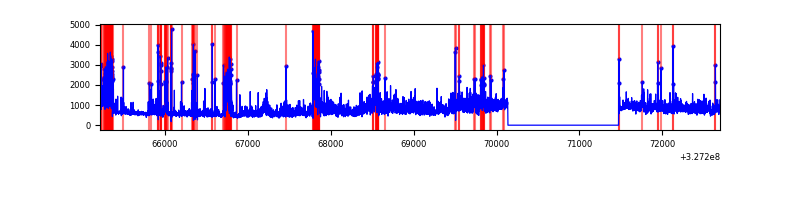 |
Top three noisy pixels from each quadrant. If the there are fewer than three noisy pixels in the level2.evt file, extra rows are filled as -1
| Pixel properties | Quadrant properties | ||||||
|---|---|---|---|---|---|---|---|
| Quadrant | DetID | PixID | Counts | Sigma | Mean | Median | Sigma |
| A | 4 | 2 | 97742 | 600.58 | 811 | 798 | 161.4 |
| A | 11 | 208 | 32397 | 195.76 | 811 | 798 | 161.4 |
| A | 13 | 254 | 10665 | 61.13 | 811 | 798 | 161.4 |
| B | 3 | 64 | 60208 | 391.27 | 817 | 799 | 151.8 |
| B | 0 | 190 | 47121 | 305.08 | 817 | 799 | 151.8 |
| B | 5 | 172 | 28892 | 185.02 | 817 | 799 | 151.8 |
| C | 7 | 247 | 154063 | 843.38 | 776 | 783 | 181.7 |
| C | 14 | 238 | 126800 | 693.38 | 776 | 783 | 181.7 |
| C | 3 | 233 | 37046 | 199.53 | 776 | 783 | 181.7 |
| D | 8 | 195 | 1355821 | 7269.35 | 765 | 743 | 186.4 |
| D | 1 | 52 | 560960 | 3005.3 | 765 | 743 | 186.4 |
| D | 12 | 233 | 167356 | 893.8 | 765 | 743 | 186.4 |
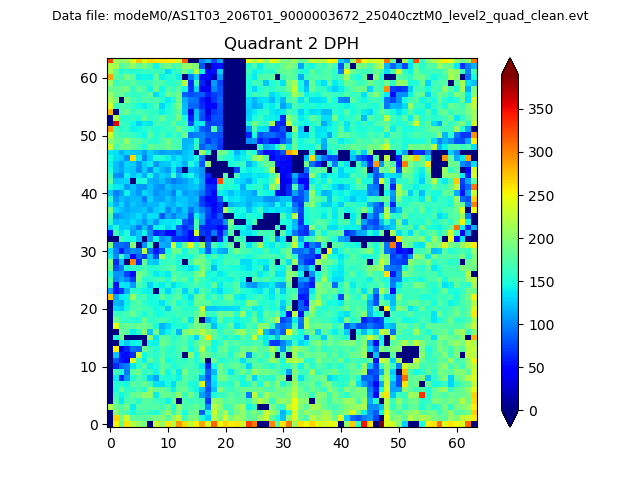
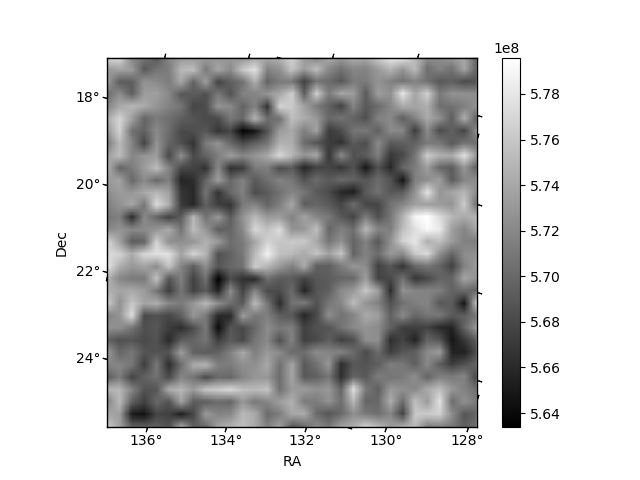
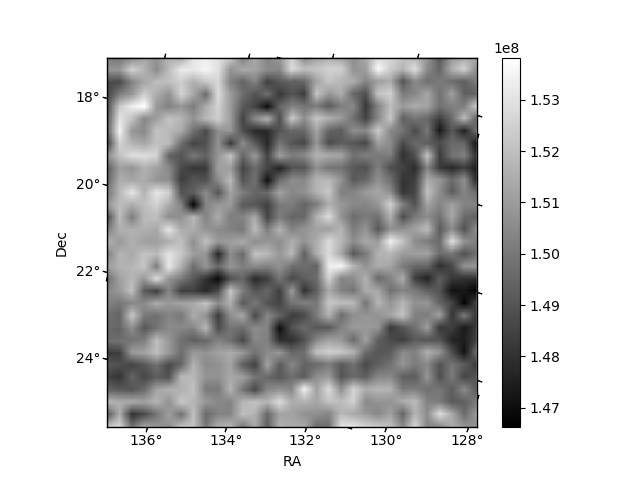
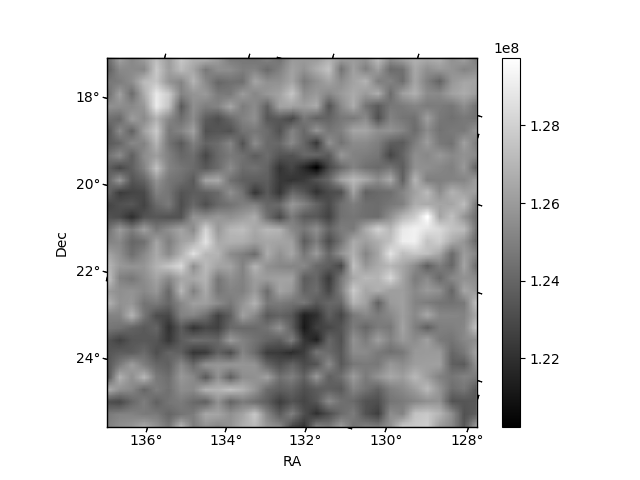
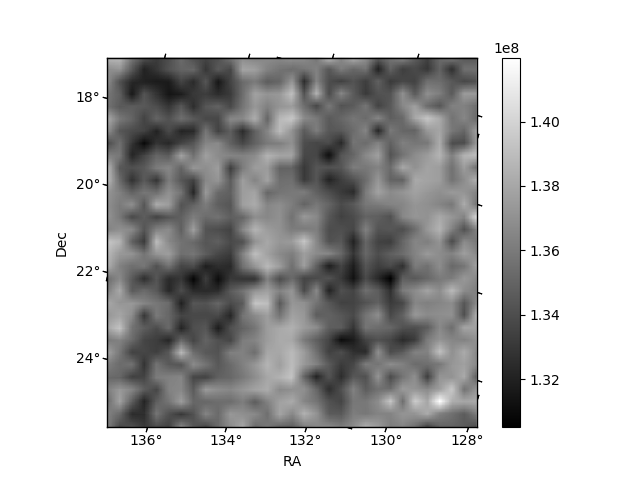
Histogram calculated using DETX and DETY for each event in the final _common_clean file
| Quadrant A | 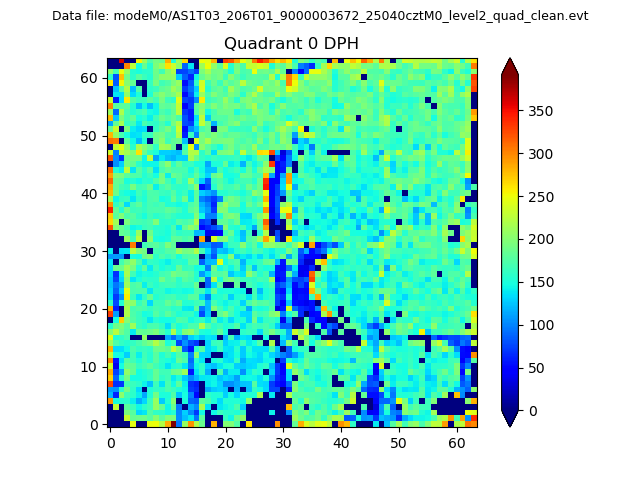 |
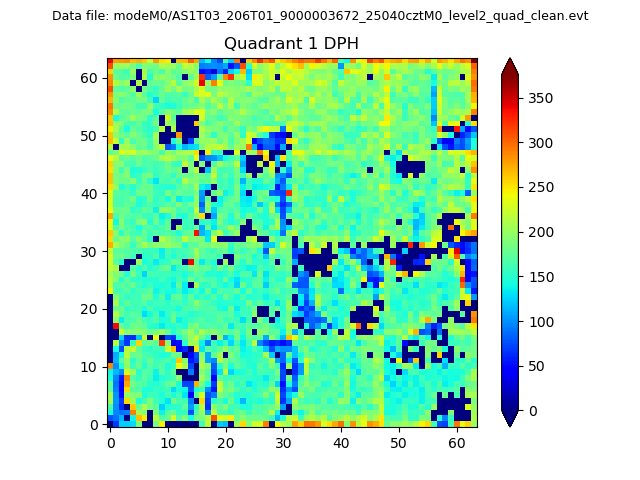 |
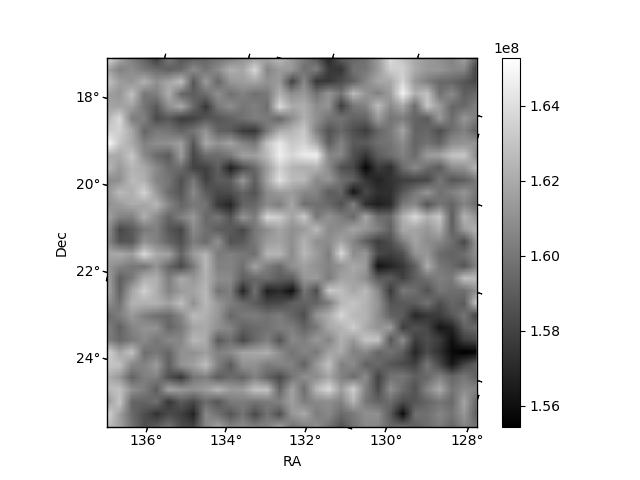
Quadrant B |
|---|---|---|---|
| Quadrant D | 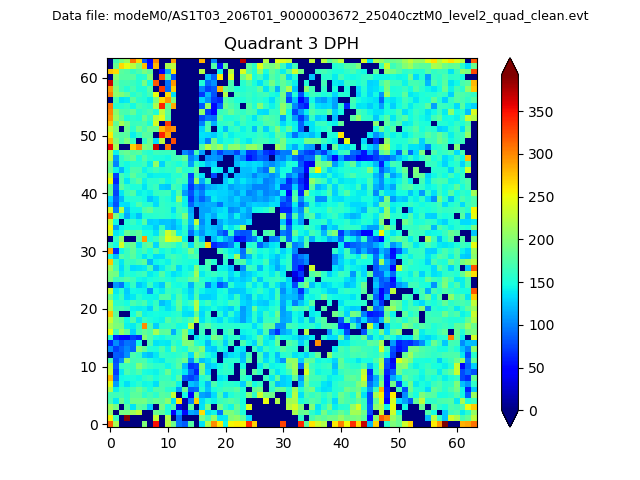 |
 |
Quadrant C |
| Plot type | Count rate plots | Images |
|---|---|---|
| Comparison with Poisson distribution Blue bars denote a histogram of data divided into 1 sec bins. Red curve is a Poisson curve with rate = median count rate of data. |
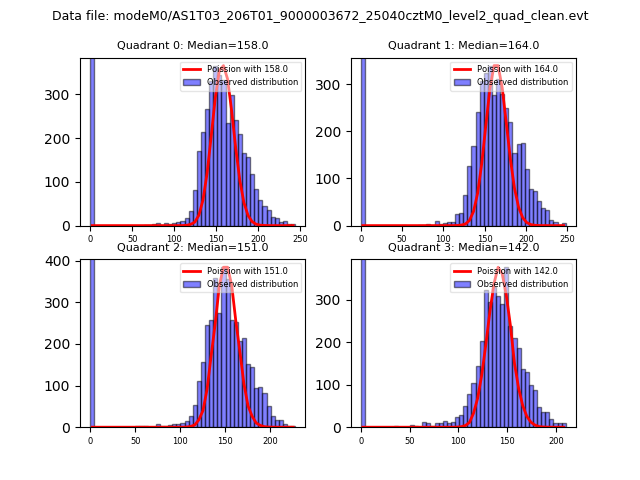 |
 |
| Quadrant-wise count rates Data is divided into 100 sec bins |
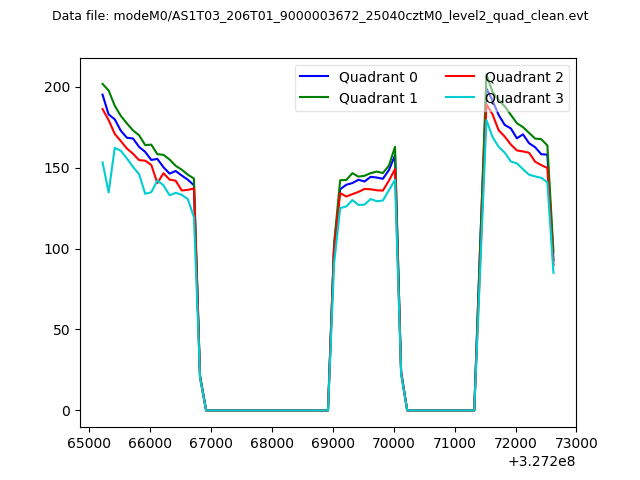 |
|
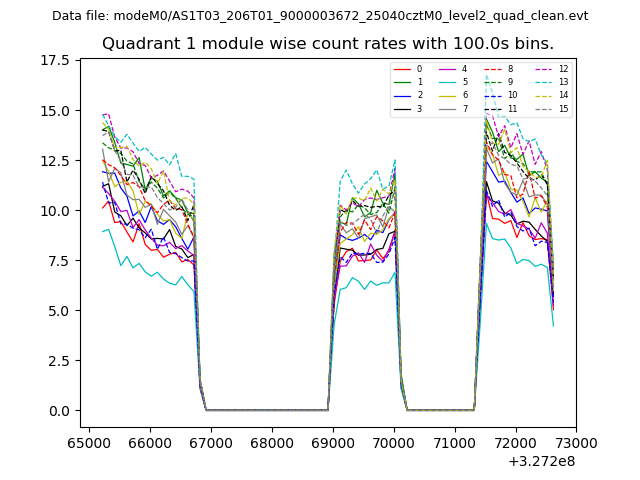
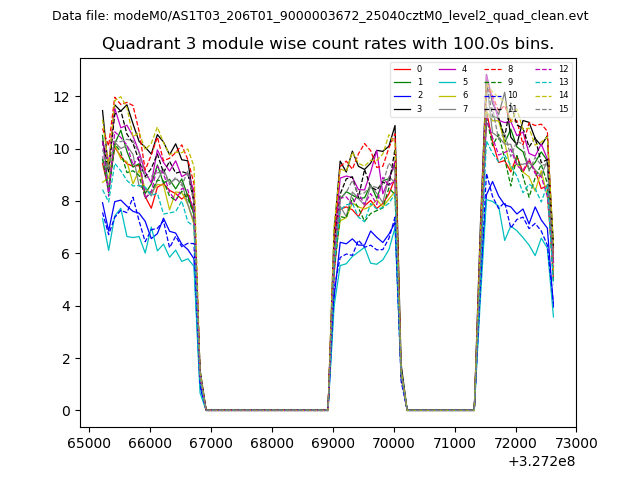
| Module-wise count rates for Quadrant A Data is divided into 100 sec bins |
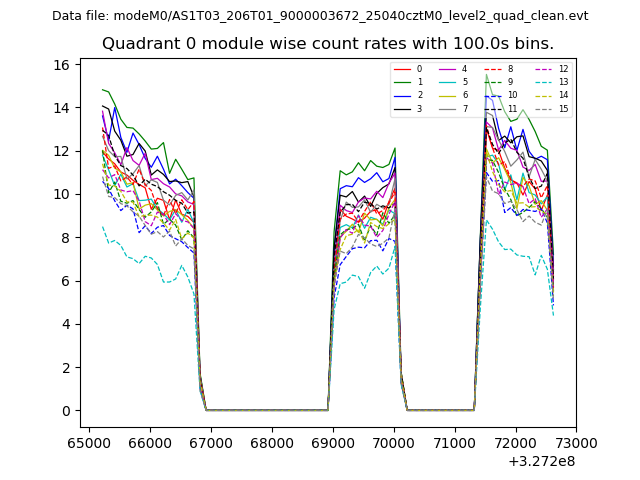 |
 |
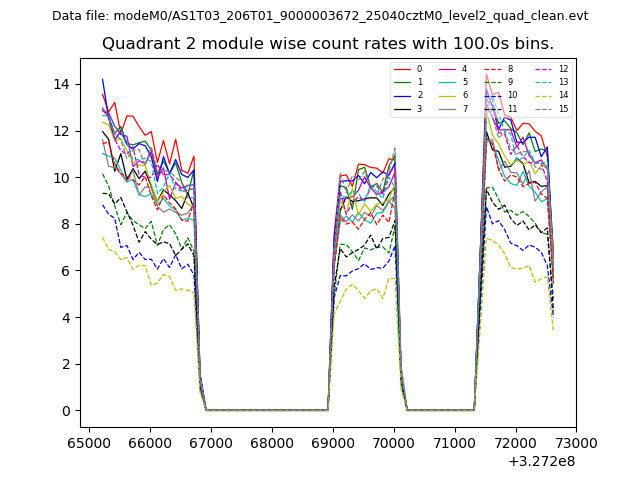
| Module-wise count rates for Quadrant B Data is divided into 100 sec bins |
 |
 |
| Module-wise count rates for Quadrant C Data is divided into 100 sec bins |
 |
 |
| Module-wise count rates for Quadrant D Data is divided into 100 sec bins |
 |
 |
| Parameter | Plot |
|---|---|
| CZT HV Monitor | 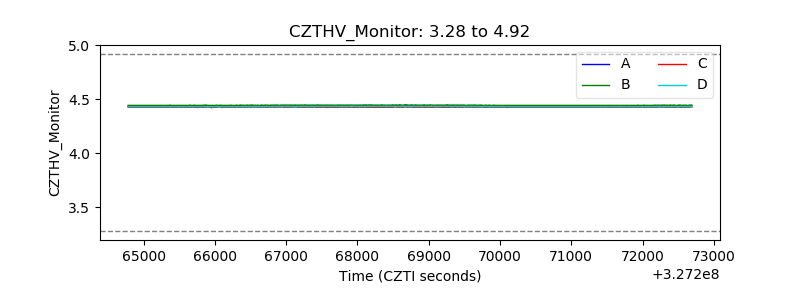 |
| D_VDD | 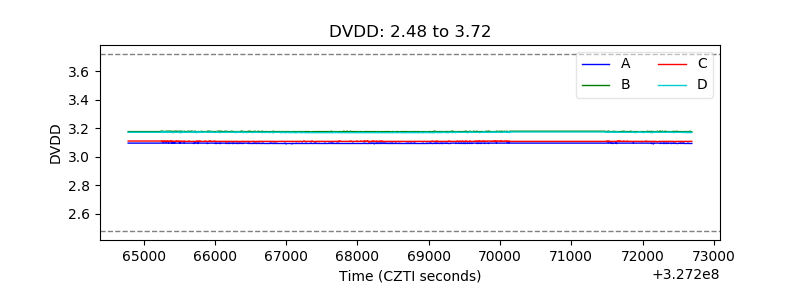 |
| Temperature 1 | 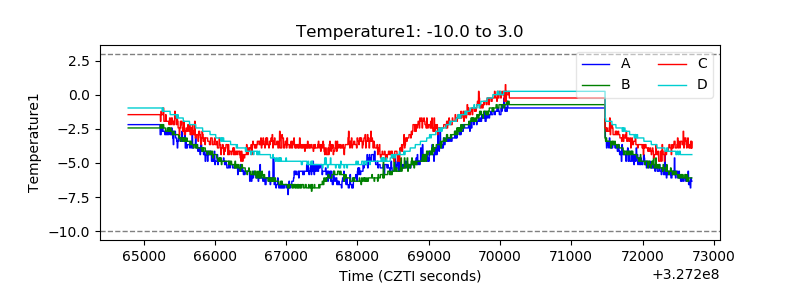 |
| Veto HV Monitor | 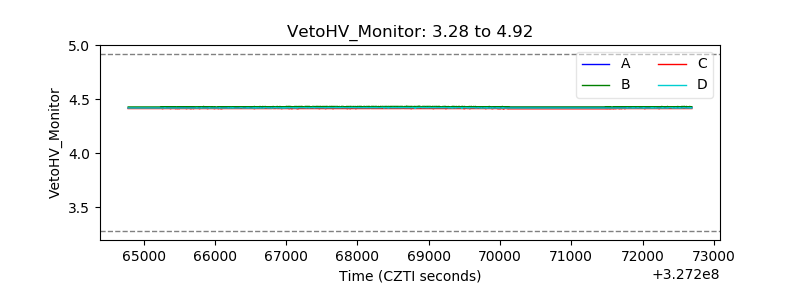 |
| Veto LLD | 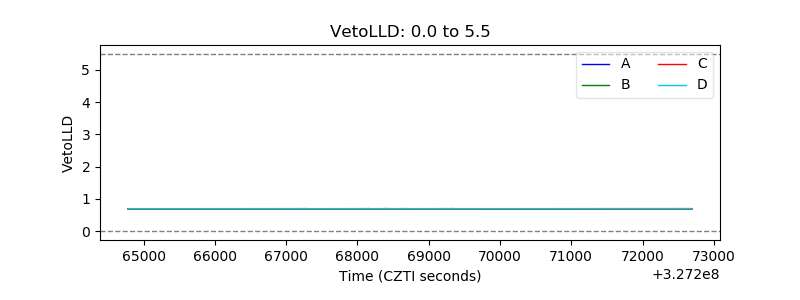 |
| Alpha Counter | 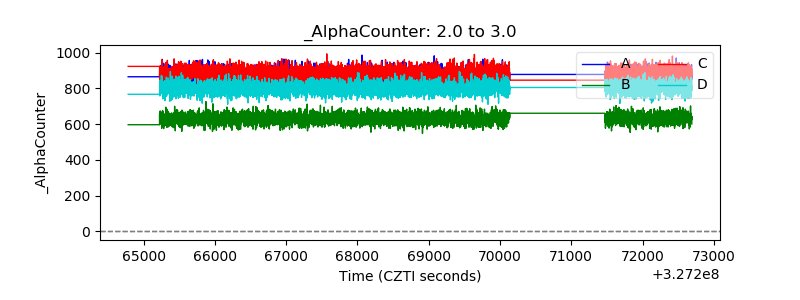 |
| _CPM_Rate | 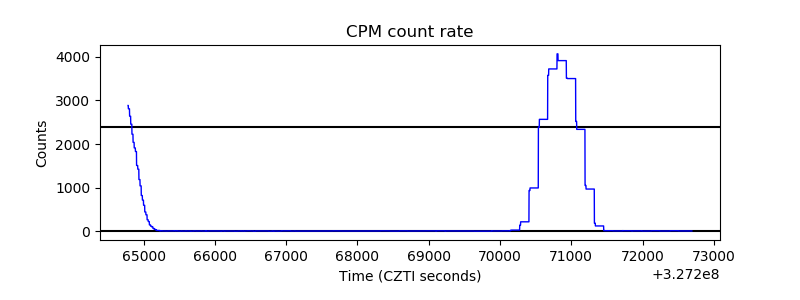 |
| CZT Counter | 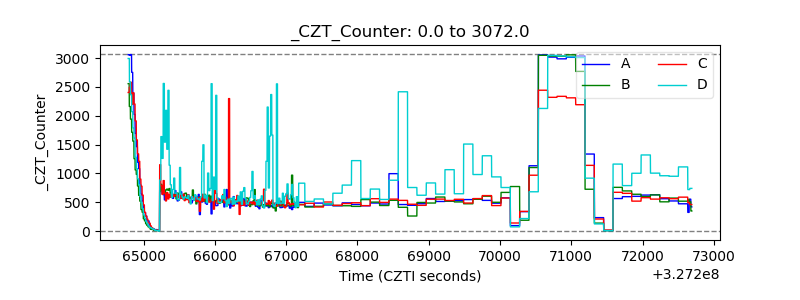 |
| +2.5 Volts monitor |  |
| +5 Volts monitor | 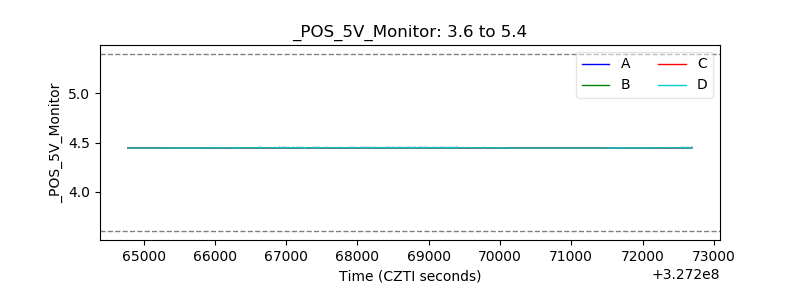 |
| _ROLL_ROT | 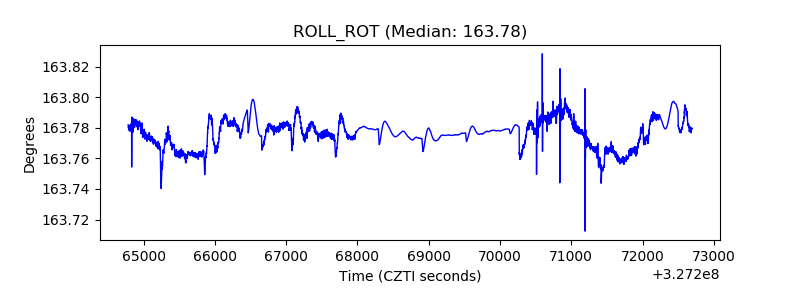 |
| _Roll_DEC | 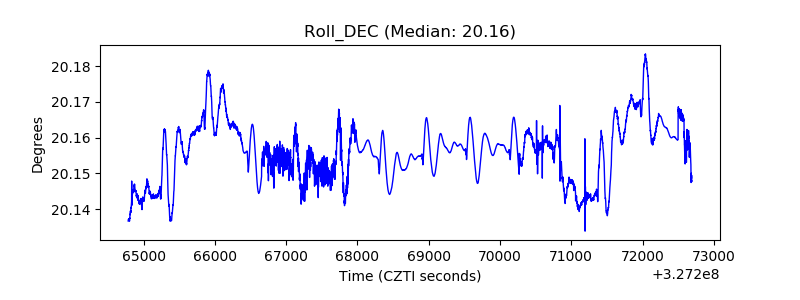 |
| _Roll_RA | 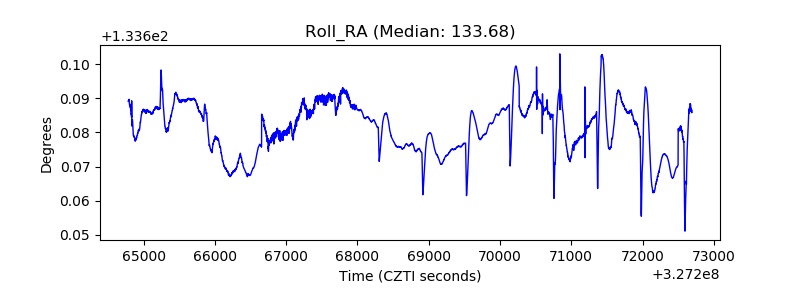 |
| Veto Counter | 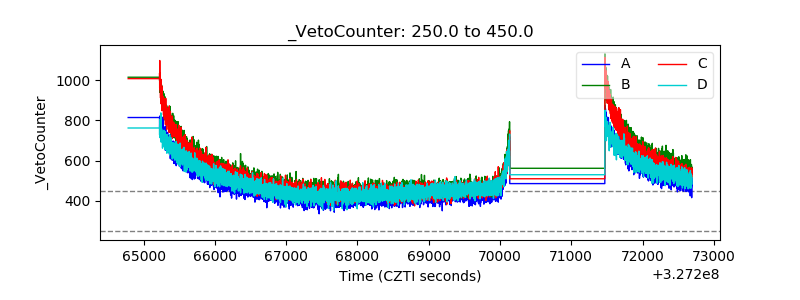 |