| Param | Original file | Final file |
|---|---|---|
| Filename | modeM0/AS1T03_206T01_9000003672_25042cztM0_level2.evt | modeM0/AS1T03_206T01_9000003672_25042cztM0_level2_quad_clean.evt |
| Size (bytes) | 511,571,520 | 76,919,040 |
| Size | 487.9 MB | 73.4 MB |
| Events in quadrant A | 3,458,299 | 491,041 |
| Events in quadrant B | 3,467,114 | 505,303 |
| Events in quadrant C | 3,459,386 | 465,101 |
| Events in quadrant D | 4,692,435 | 439,209 |
| Mode M9 | |||
|---|---|---|---|
| Quadrant | BADHDUFLAG | Total packets | Discarded packets |
| A | 0 | 25 | 0 |
| B | 0 | 26 | 0 |
| C | 0 | 26 | 0 |
| D | 0 | 26 | 0 |
| Mode SS | |||
|---|---|---|---|
| Quadrant | BADHDUFLAG | Total packets | Discarded packets |
| A | 0 | 124 | 0 |
| B | 0 | 124 | 0 |
| C | 0 | 124 | 0 |
| D | 0 | 124 | 0 |
| Mode M0 | |||
|---|---|---|---|
| Quadrant | BADHDUFLAG | Total packets | Discarded packets |
| A | 0 | 13832 | 2 |
| B | 0 | 13943 | 2 |
| C | 0 | 14206 | 2 |
| D | 0 | 18236 | 3 |
| Quadrant | Total seconds | Saturated seconds | Saturation percentage |
|---|---|---|---|
| A | 6141 | 52 | 0.846768% |
| B | 6141 | 51 | 0.830484% |
| C | 6141 | 64 | 1.042176% |
| D | 6140 | 92 | 1.498371% |
Noise dominated data is calculated using 1-second bins in cleaned event files. If a bin has >2000 counts, and if more than 50% of those come from <1% of pixels, then it is considered to be noise-dominated and hence unusable.
| Quadrant | # 1 sec bins | Bins with >0 counts | Bins with >2000 counts | High rate bins dominated by noise | Noise dominated (total time) | Noise dominated (detector-on time) | Marked lightcurve |
|---|---|---|---|---|---|---|---|
| A | 7536 | 6142 | 25 | 25 | 0.33% | 0.41% | 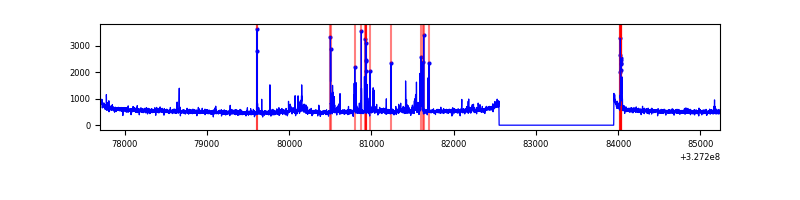 |
| B | 7536 | 6142 | 8 | 8 | 0.11% | 0.13% | 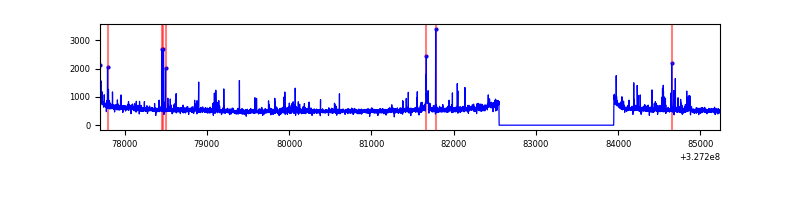 |
| C | 7536 | 6142 | 0 | 0 | 0.00% | 0.00% | 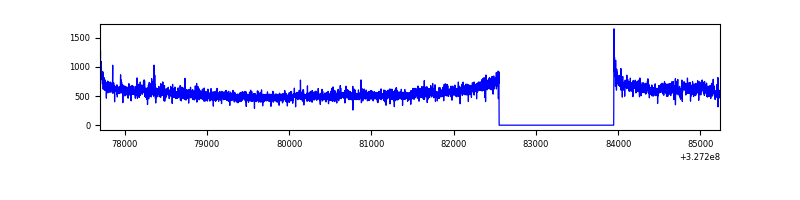 |
| D | 7535 | 6141 | 44 | 44 | 0.58% | 0.72% | 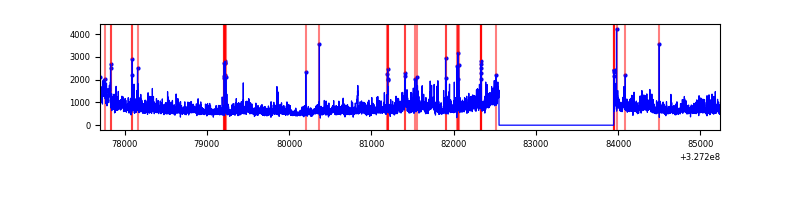 |
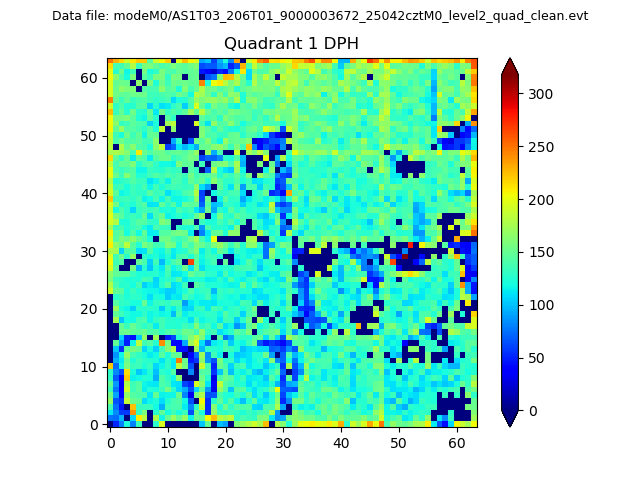
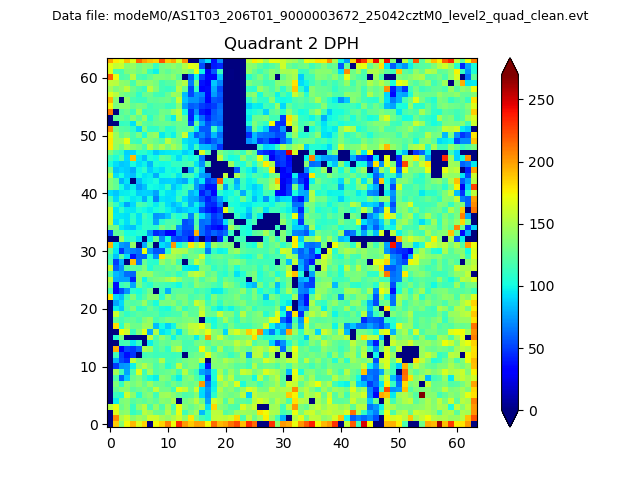
Top three noisy pixels from each quadrant. If the there are fewer than three noisy pixels in the level2.evt file, extra rows are filled as -1
| Pixel properties | Quadrant properties | ||||||
|---|---|---|---|---|---|---|---|
| Quadrant | DetID | PixID | Counts | Sigma | Mean | Median | Sigma |
| A | 4 | 2 | 261499 | 1578.96 | 829 | 815 | 165.1 |
| A | 13 | 254 | 9686 | 53.73 | 829 | 815 | 165.1 |
| A | 0 | 226 | 7120 | 38.19 | 829 | 815 | 165.1 |
| B | 4 | 80 | 55030 | 353.47 | 836 | 818 | 153.4 |
| B | 5 | 172 | 29719 | 188.44 | 836 | 818 | 153.4 |
| B | 0 | 190 | 26982 | 170.59 | 836 | 818 | 153.4 |
| C | 7 | 247 | 207748 | 1138.98 | 788 | 796 | 181.7 |
| C | 14 | 238 | 128128 | 700.78 | 788 | 796 | 181.7 |
| C | 3 | 233 | 47967 | 259.61 | 788 | 796 | 181.7 |
| D | 8 | 195 | 1273684 | 6656.96 | 785 | 764 | 191.2 |
| D | 1 | 52 | 190692 | 993.26 | 785 | 764 | 191.2 |
| D | 2 | 244 | 98949 | 513.48 | 785 | 764 | 191.2 |
Histogram calculated using DETX and DETY for each event in the final _common_clean file
| Quadrant A | 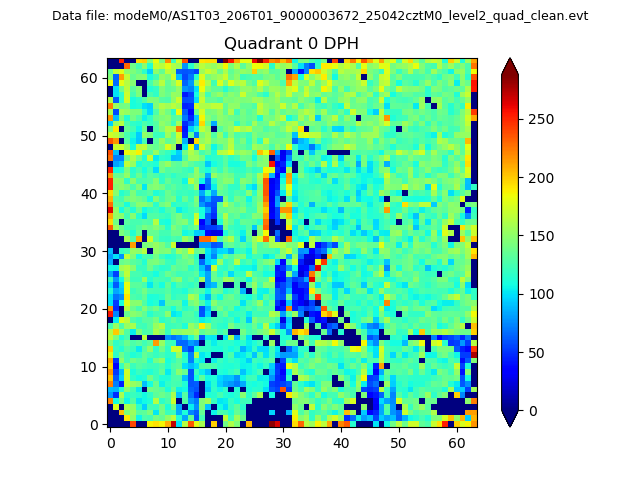 |
 |
Quadrant B |
|---|---|---|---|
| Quadrant D | 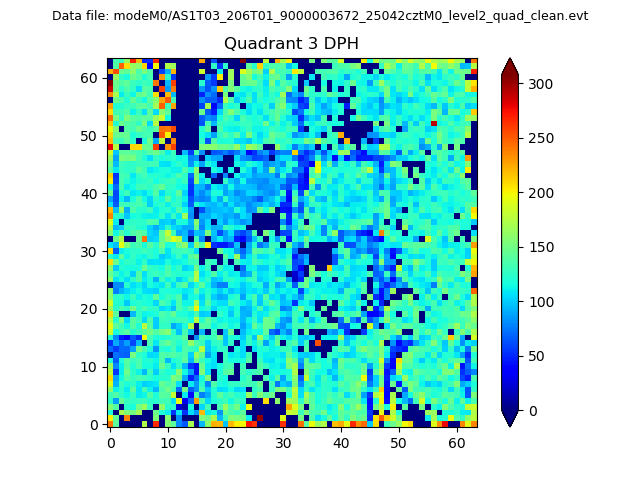 |
 |
Quadrant C |
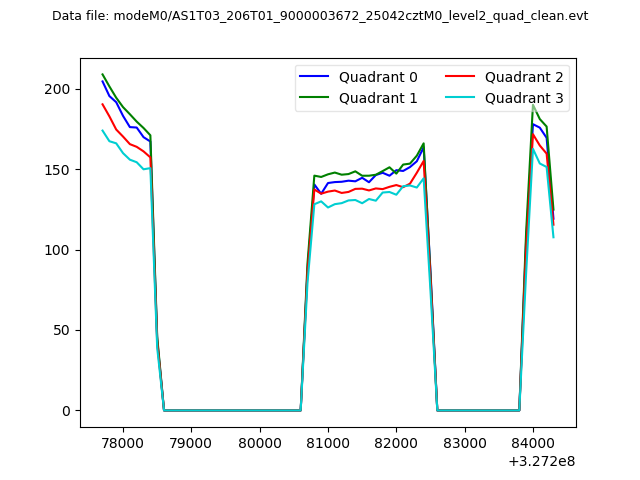
| Plot type | Count rate plots | Images |
|---|---|---|
| Comparison with Poisson distribution Blue bars denote a histogram of data divided into 1 sec bins. Red curve is a Poisson curve with rate = median count rate of data. |
 |
 |
| Quadrant-wise count rates Data is divided into 100 sec bins |
 |
|
| Module-wise count rates for Quadrant A Data is divided into 100 sec bins |
 |
 |
| Module-wise count rates for Quadrant B Data is divided into 100 sec bins |
 |
 |
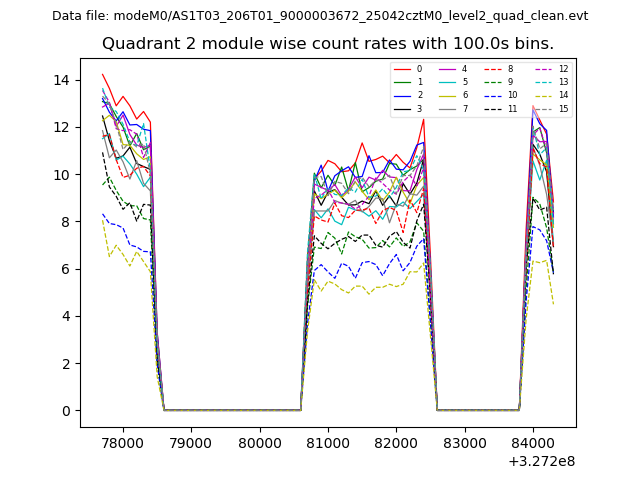
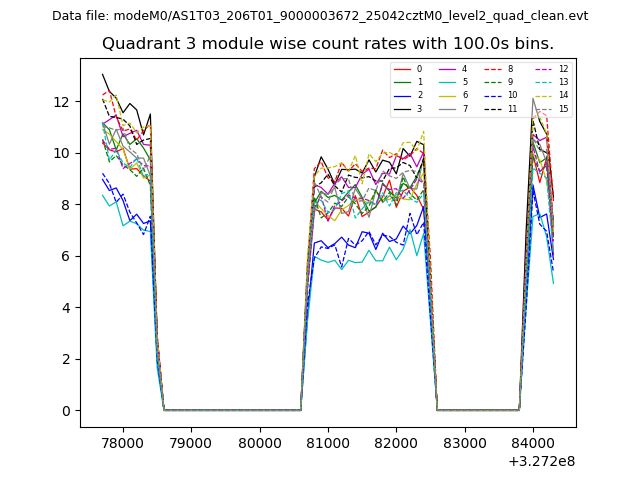
| Module-wise count rates for Quadrant C Data is divided into 100 sec bins |
 |
 |
| Module-wise count rates for Quadrant D Data is divided into 100 sec bins |
 |
 |
| Parameter | Plot |
|---|---|
| CZT HV Monitor |  |
| D_VDD | 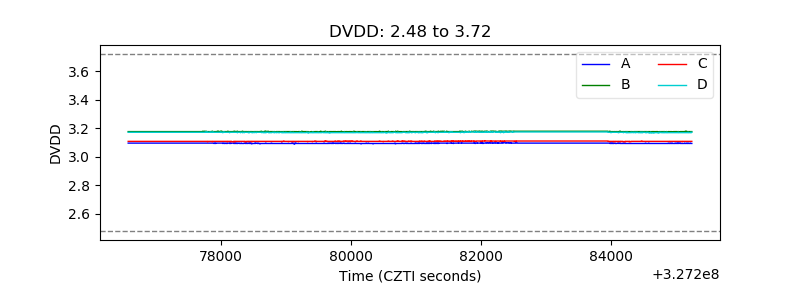 |
| Temperature 1 | 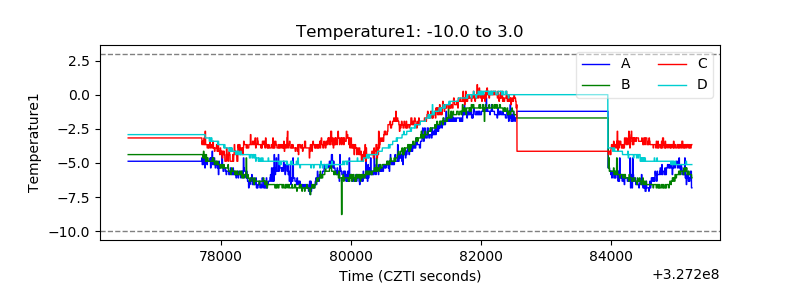 |
| Veto HV Monitor | 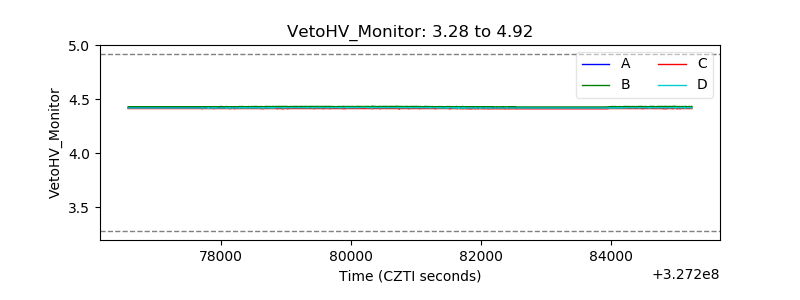 |
| Veto LLD | 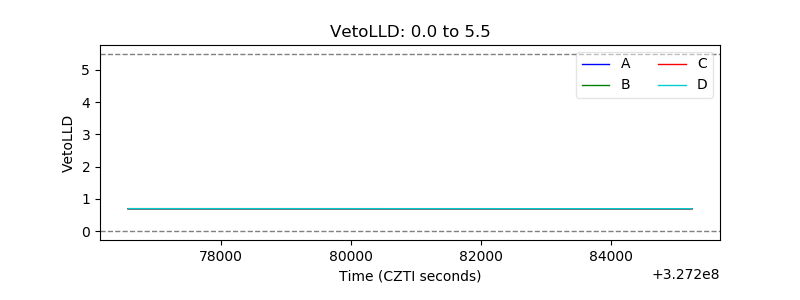 |
| Alpha Counter | 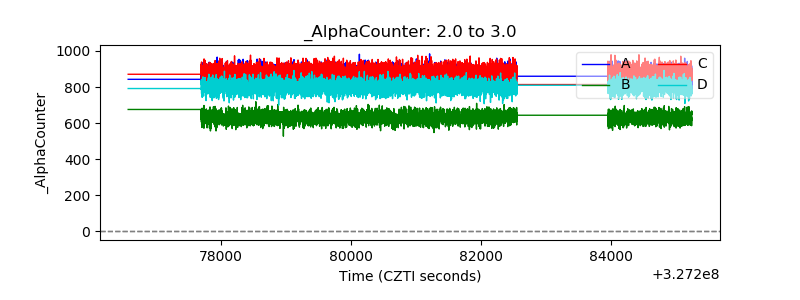 |
| _CPM_Rate | 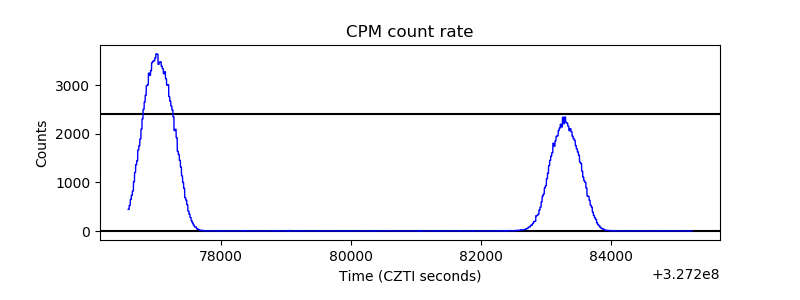 |
| CZT Counter | 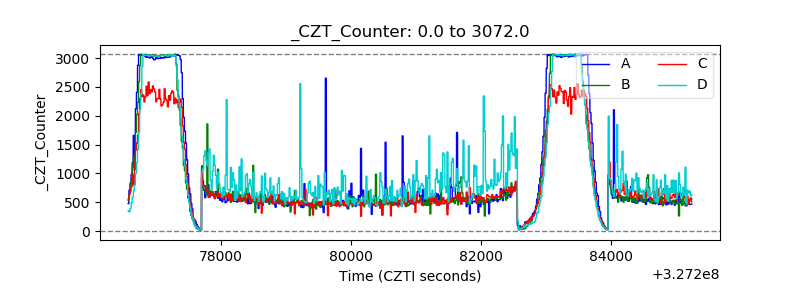 |
| +2.5 Volts monitor |  |
| +5 Volts monitor |  |
| _ROLL_ROT | 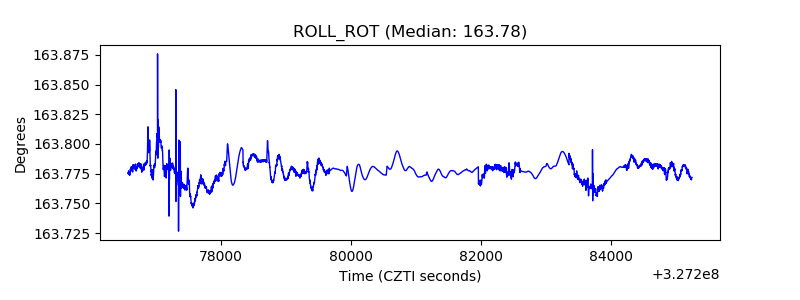 |
| _Roll_DEC | 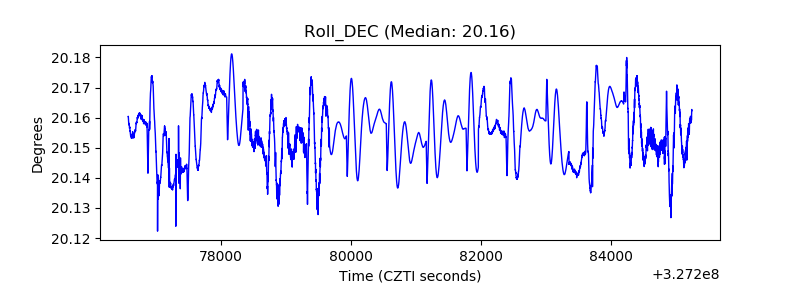 |
| _Roll_RA | 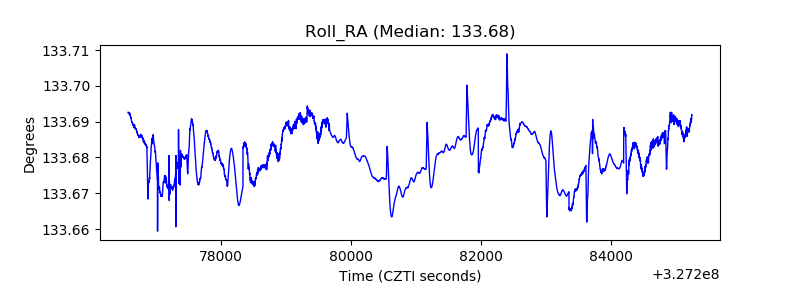 |
| Veto Counter | 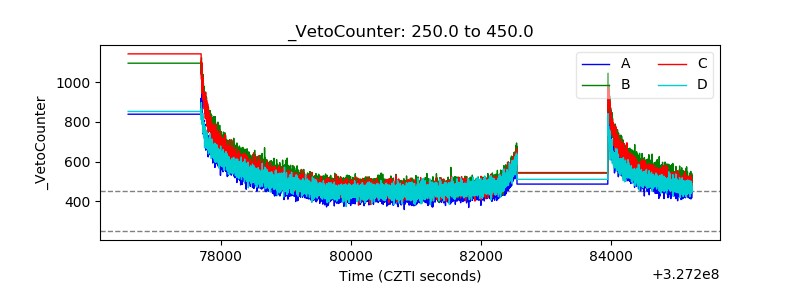 |