| Param | Original file | Final file |
|---|---|---|
| Filename | modeM0/AS1T03_206T01_9000003672_25043cztM0_level2.evt | modeM0/AS1T03_206T01_9000003672_25043cztM0_level2_quad_clean.evt |
| Size (bytes) | 540,198,720 | 69,145,920 |
| Size | 515.2 MB | 65.9 MB |
| Events in quadrant A | 3,449,337 | 421,868 |
| Events in quadrant B | 3,574,588 | 435,192 |
| Events in quadrant C | 3,696,456 | 400,209 |
| Events in quadrant D | 5,196,963 | 380,605 |
| Mode M9 | |||
|---|---|---|---|
| Quadrant | BADHDUFLAG | Total packets | Discarded packets |
| A | 0 | 23 | 0 |
| B | 0 | 24 | 0 |
| C | 0 | 24 | 0 |
| D | 0 | 24 | 0 |
| Mode SS | |||
|---|---|---|---|
| Quadrant | BADHDUFLAG | Total packets | Discarded packets |
| A | 0 | 132 | 0 |
| B | 0 | 132 | 0 |
| C | 0 | 132 | 0 |
| D | 0 | 132 | 0 |
| Mode M0 | |||
|---|---|---|---|
| Quadrant | BADHDUFLAG | Total packets | Discarded packets |
| A | 0 | 13944 | 2 |
| B | 0 | 14358 | 2 |
| C | 0 | 15112 | 2 |
| D | 0 | 20130 | 2 |
| Quadrant | Total seconds | Saturated seconds | Saturation percentage |
|---|---|---|---|
| A | 6537 | 58 | 0.887257% |
| B | 6537 | 106 | 1.621539% |
| C | 6536 | 104 | 1.591187% |
| D | 6536 | 149 | 2.279682% |
Noise dominated data is calculated using 1-second bins in cleaned event files. If a bin has >2000 counts, and if more than 50% of those come from <1% of pixels, then it is considered to be noise-dominated and hence unusable.
| Quadrant | # 1 sec bins | Bins with >0 counts | Bins with >2000 counts | High rate bins dominated by noise | Noise dominated (total time) | Noise dominated (detector-on time) | Marked lightcurve |
|---|---|---|---|---|---|---|---|
| A | 7757 | 6538 | 8 | 8 | 0.10% | 0.12% | 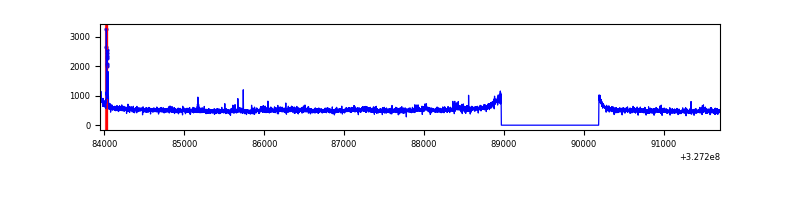 |
| B | 7757 | 6538 | 9 | 9 | 0.12% | 0.14% | 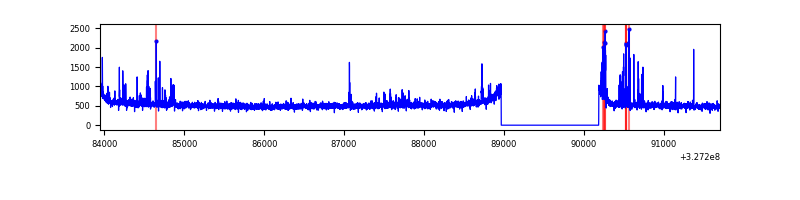 |
| C | 7756 | 6537 | 0 | 0 | 0.00% | 0.00% | 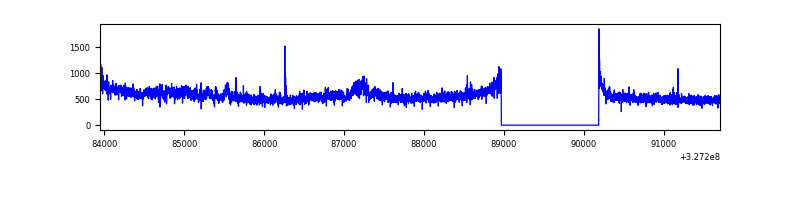 |
| D | 7756 | 6537 | 87 | 87 | 1.12% | 1.33% | 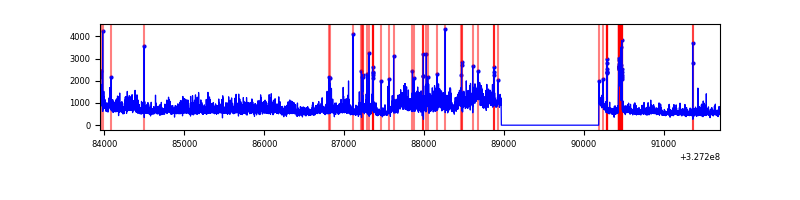 |
Top three noisy pixels from each quadrant. If the there are fewer than three noisy pixels in the level2.evt file, extra rows are filled as -1
| Pixel properties | Quadrant properties | ||||||
|---|---|---|---|---|---|---|---|
| Quadrant | DetID | PixID | Counts | Sigma | Mean | Median | Sigma |
| A | 11 | 208 | 69789 | 400.11 | 865 | 848 | 172.3 |
| A | 4 | 2 | 43266 | 246.18 | 865 | 848 | 172.3 |
| A | 13 | 254 | 10402 | 55.45 | 865 | 848 | 172.3 |
| B | 4 | 80 | 109790 | 676.73 | 867 | 849 | 161.0 |
| B | 0 | 190 | 29203 | 176.13 | 867 | 849 | 161.0 |
| B | 0 | 230 | 22860 | 136.73 | 867 | 849 | 161.0 |
| C | 7 | 247 | 322152 | 1685.11 | 819 | 824 | 190.7 |
| C | 14 | 238 | 134203 | 699.47 | 819 | 824 | 190.7 |
| C | 3 | 233 | 33485 | 171.28 | 819 | 824 | 190.7 |
| D | 8 | 195 | 1614369 | 8115.61 | 818 | 795 | 198.8 |
| D | 9 | 35 | 148843 | 744.62 | 818 | 795 | 198.8 |
| D | 2 | 244 | 104915 | 523.68 | 818 | 795 | 198.8 |
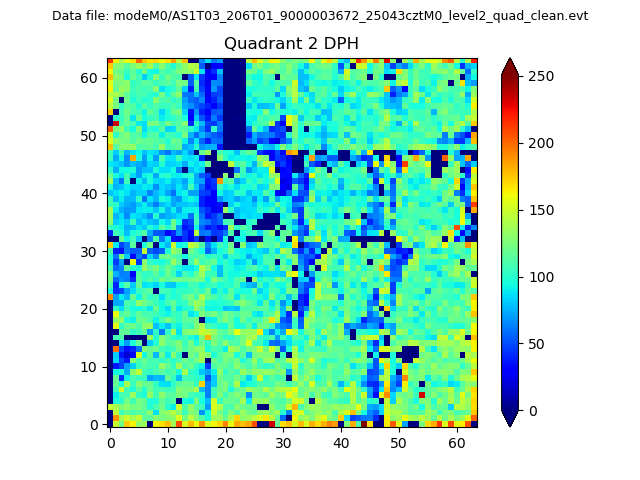
Histogram calculated using DETX and DETY for each event in the final _common_clean file
| Quadrant A | 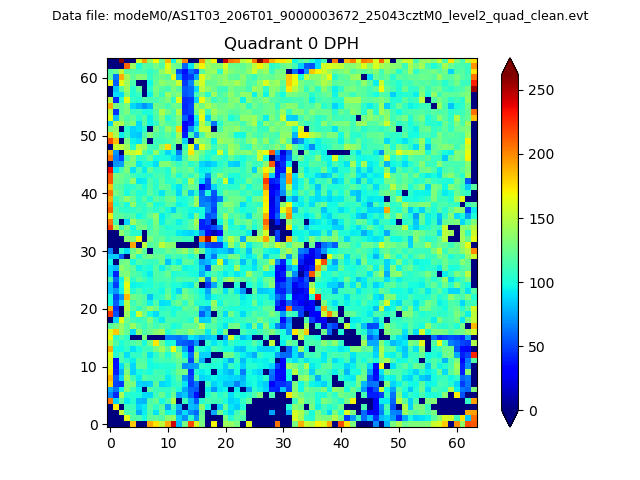 |
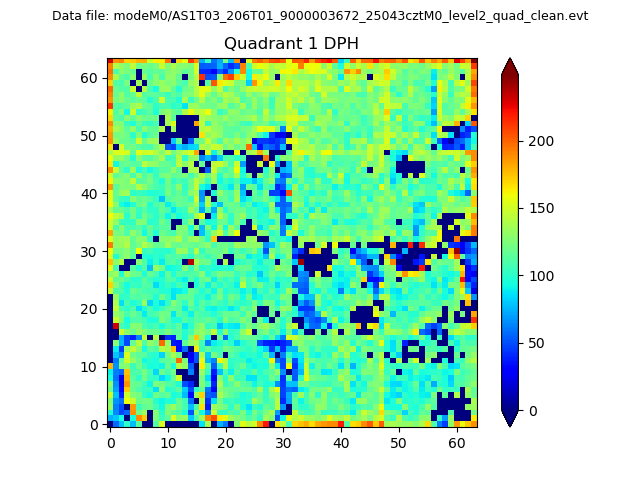 |
Quadrant B |
|---|---|---|---|
| Quadrant D | 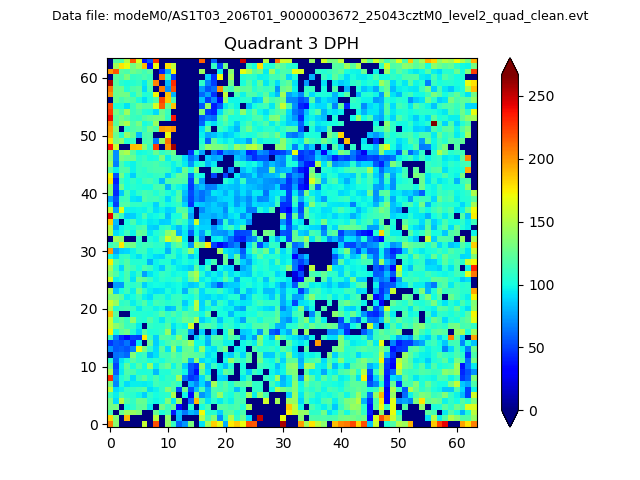 |
 |
Quadrant C |
| Plot type | Count rate plots | Images |
|---|---|---|
| Comparison with Poisson distribution Blue bars denote a histogram of data divided into 1 sec bins. Red curve is a Poisson curve with rate = median count rate of data. |
 |
 |
| Quadrant-wise count rates Data is divided into 100 sec bins |
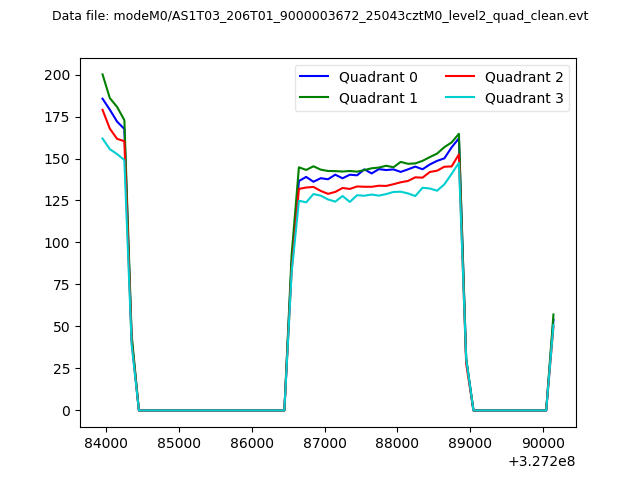 |
|
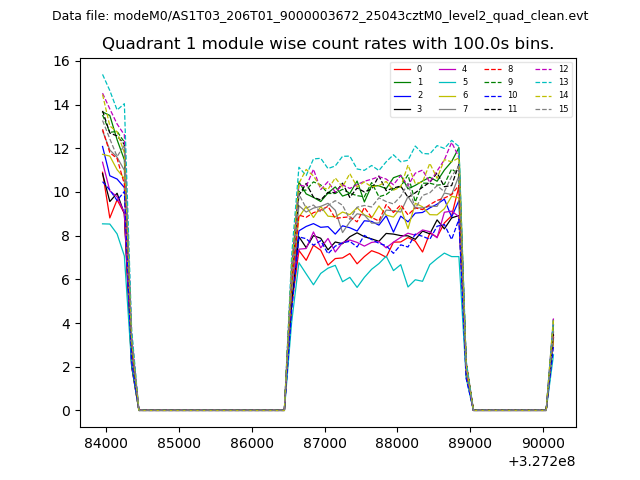
| Module-wise count rates for Quadrant A Data is divided into 100 sec bins |
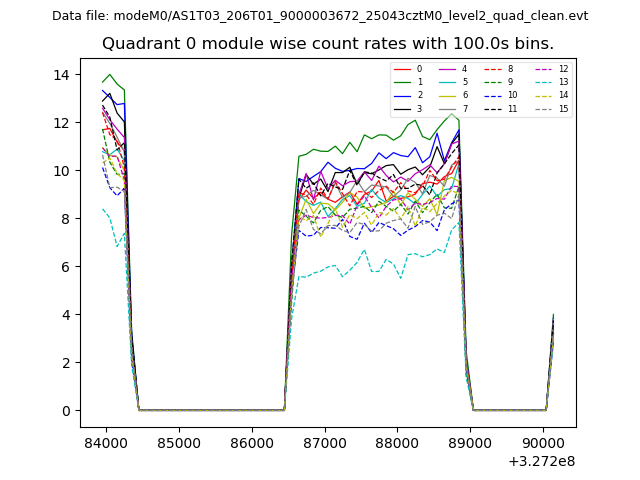 |
 |
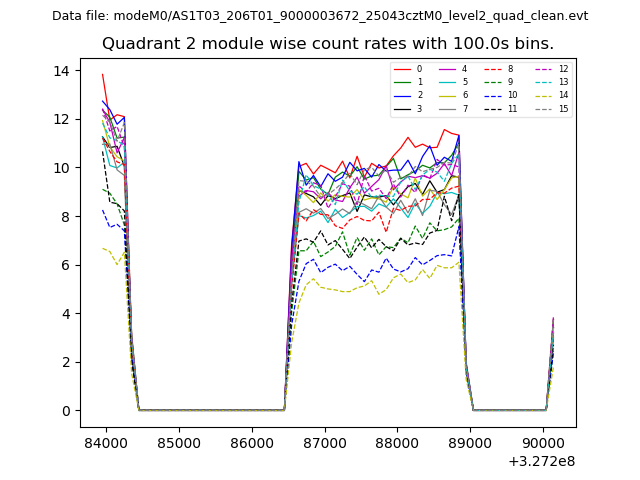
| Module-wise count rates for Quadrant B Data is divided into 100 sec bins |
 |
 |
| Module-wise count rates for Quadrant C Data is divided into 100 sec bins |
 |
 |
| Module-wise count rates for Quadrant D Data is divided into 100 sec bins |
 |
 |
| Parameter | Plot |
|---|---|
| CZT HV Monitor | 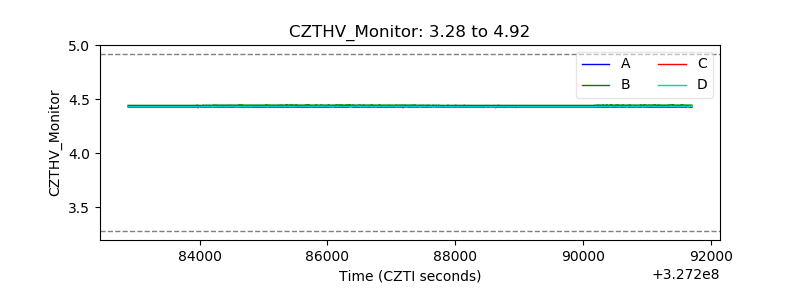 |
| D_VDD | 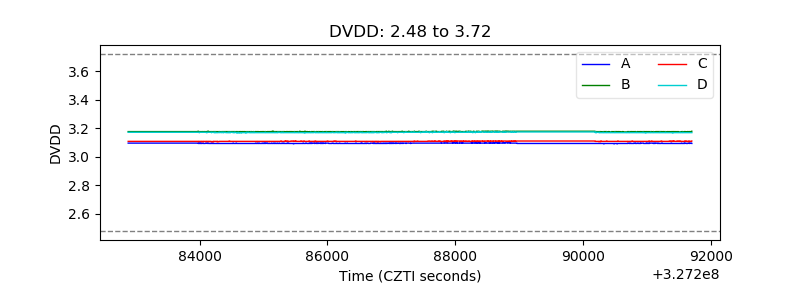 |
| Temperature 1 | 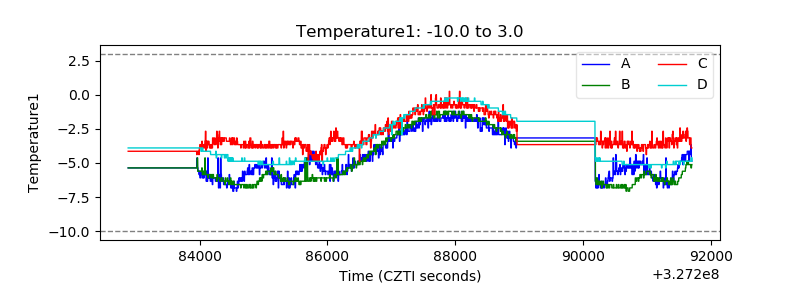 |
| Veto HV Monitor | 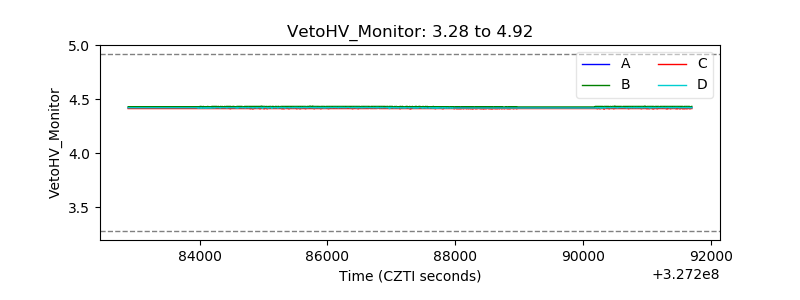 |
| Veto LLD | 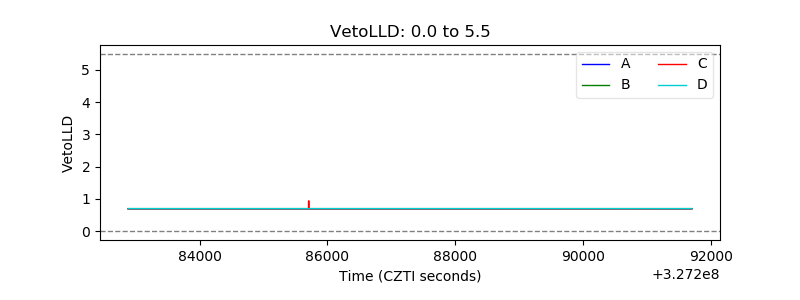 |
| Alpha Counter | 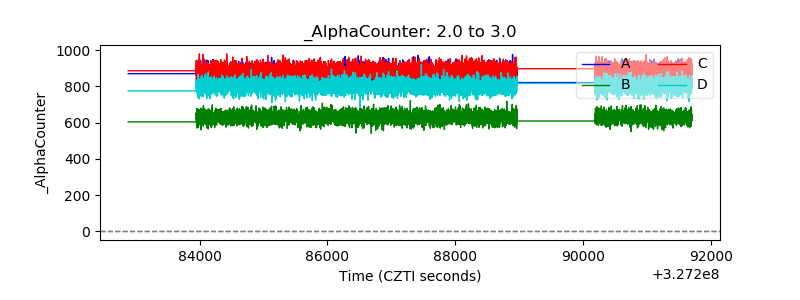 |
| _CPM_Rate | 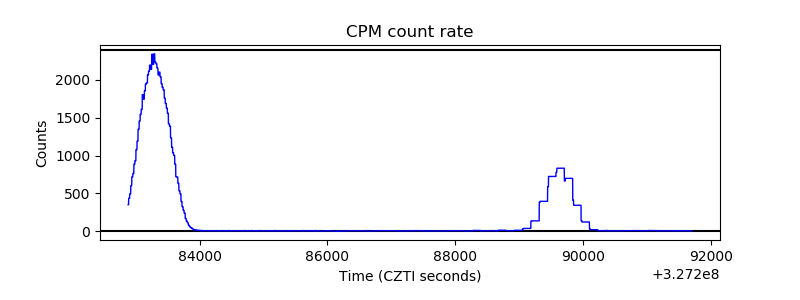 |
| CZT Counter | 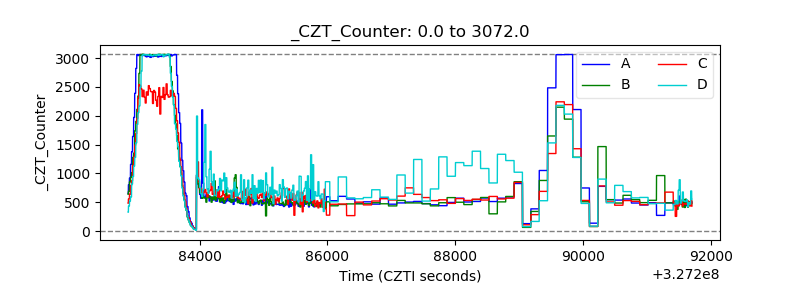 |
| +2.5 Volts monitor |  |
| +5 Volts monitor | 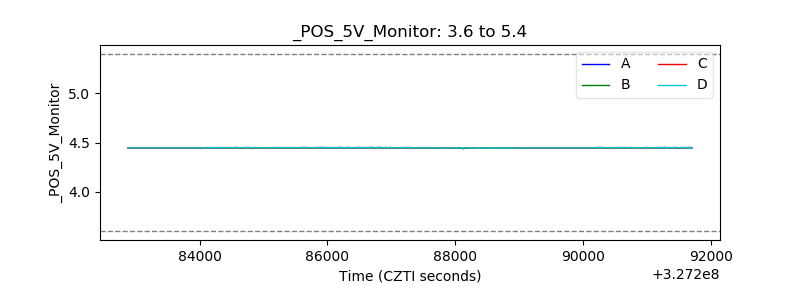 |
| _ROLL_ROT | 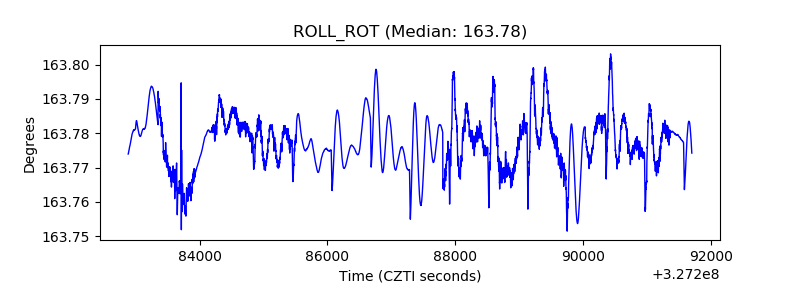 |
| _Roll_DEC | 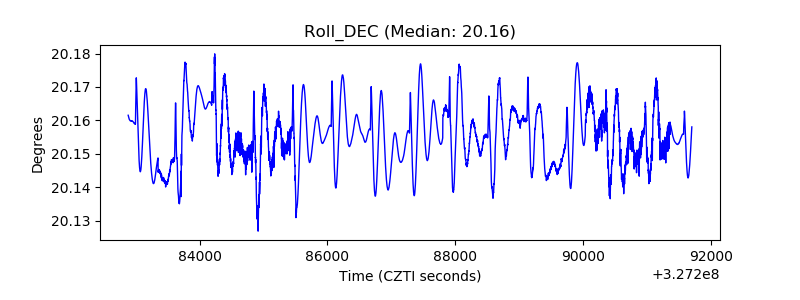 |
| _Roll_RA | 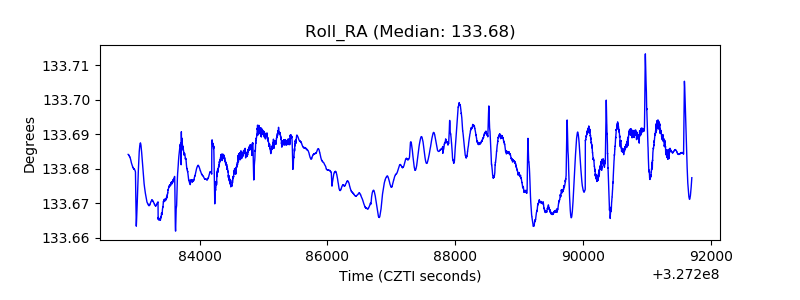 |
| Veto Counter |  |