| Param | Original file | Final file |
|---|---|---|
| Filename | modeM0/AS1T03_206T01_9000003672_25045cztM0_level2.evt | modeM0/AS1T03_206T01_9000003672_25045cztM0_level2_quad_clean.evt |
| Size (bytes) | 600,606,720 | 78,629,760 |
| Size | 572.8 MB | 75.0 MB |
| Events in quadrant A | 3,811,233 | 480,700 |
| Events in quadrant B | 3,776,898 | 492,601 |
| Events in quadrant C | 3,860,336 | 467,316 |
| Events in quadrant D | 6,238,202 | 423,816 |
| Mode M9 | |||
|---|---|---|---|
| Quadrant | BADHDUFLAG | Total packets | Discarded packets |
| A | 0 | 13 | 0 |
| B | 0 | 13 | 0 |
| C | 0 | 13 | 0 |
| D | 0 | 13 | 0 |
| Mode SS | |||
|---|---|---|---|
| Quadrant | BADHDUFLAG | Total packets | Discarded packets |
| A | 0 | 150 | 0 |
| B | 0 | 150 | 0 |
| C | 0 | 150 | 0 |
| D | 0 | 150 | 0 |
| Mode M0 | |||
|---|---|---|---|
| Quadrant | BADHDUFLAG | Total packets | Discarded packets |
| A | 0 | 15954 | 2 |
| B | 0 | 15752 | 2 |
| C | 0 | 15819 | 2 |
| D | 0 | 23713 | 2 |
| Quadrant | Total seconds | Saturated seconds | Saturation percentage |
|---|---|---|---|
| A | 7425 | 240 | 3.232323% |
| B | 7426 | 262 | 3.528144% |
| C | 7426 | 257 | 3.460813% |
| D | 7426 | 576 | 7.756531% |
Noise dominated data is calculated using 1-second bins in cleaned event files. If a bin has >2000 counts, and if more than 50% of those come from <1% of pixels, then it is considered to be noise-dominated and hence unusable.
| Quadrant | # 1 sec bins | Bins with >0 counts | Bins with >2000 counts | High rate bins dominated by noise | Noise dominated (total time) | Noise dominated (detector-on time) | Marked lightcurve |
|---|---|---|---|---|---|---|---|
| A | 8650 | 7426 | 23 | 23 | 0.27% | 0.31% | 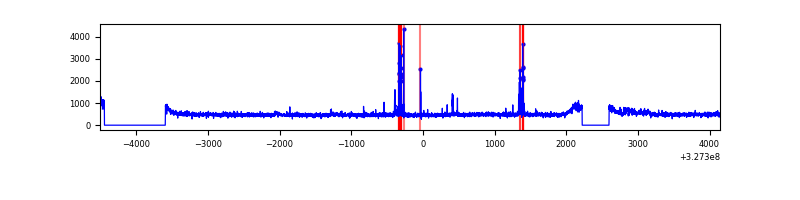 |
| B | 8651 | 7426 | 6 | 6 | 0.07% | 0.08% | 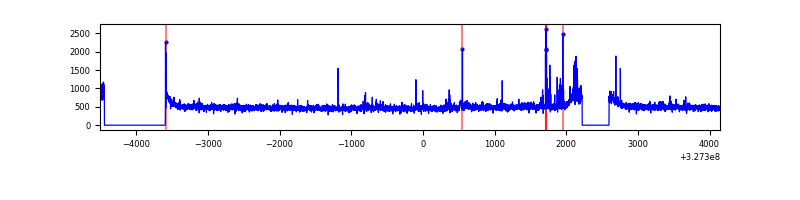 |
| C | 8651 | 7427 | 0 | 0 | 0.00% | 0.00% | 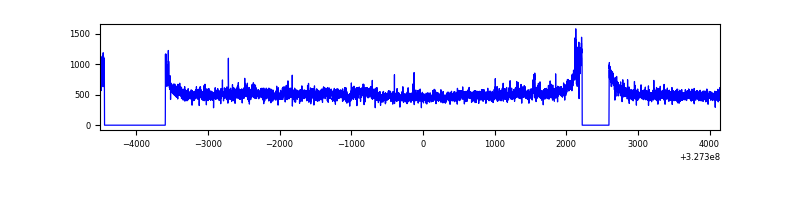 |
| D | 8651 | 7428 | 346 | 346 | 4.00% | 4.66% | 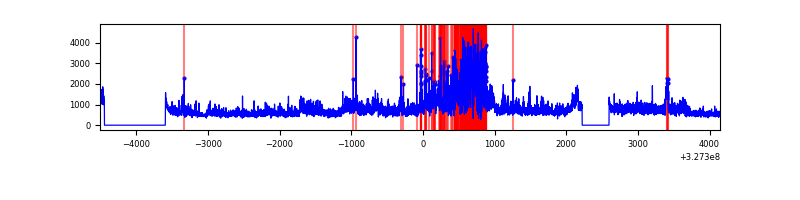 |
Top three noisy pixels from each quadrant. If the there are fewer than three noisy pixels in the level2.evt file, extra rows are filled as -1
| Pixel properties | Quadrant properties | ||||||
|---|---|---|---|---|---|---|---|
| Quadrant | DetID | PixID | Counts | Sigma | Mean | Median | Sigma |
| A | 15 | 174 | 125509 | 660.12 | 936 | 916 | 188.7 |
| A | 11 | 208 | 76239 | 399.08 | 936 | 916 | 188.7 |
| A | 13 | 254 | 11523 | 56.2 | 936 | 916 | 188.7 |
| B | 4 | 80 | 72966 | 399.61 | 931 | 907 | 180.3 |
| B | 3 | 64 | 24839 | 132.72 | 931 | 907 | 180.3 |
| B | 12 | 111 | 22307 | 118.67 | 931 | 907 | 180.3 |
| C | 14 | 238 | 141157 | 666.55 | 895 | 901 | 210.4 |
| C | 7 | 247 | 139918 | 660.67 | 895 | 901 | 210.4 |
| C | 2 | 16 | 51651 | 241.19 | 895 | 901 | 210.4 |
| D | 8 | 195 | 1487825 | 6887.19 | 880 | 853 | 215.9 |
| D | 9 | 35 | 1033189 | 4781.46 | 880 | 853 | 215.9 |
| D | 7 | 238 | 125048 | 575.23 | 880 | 853 | 215.9 |
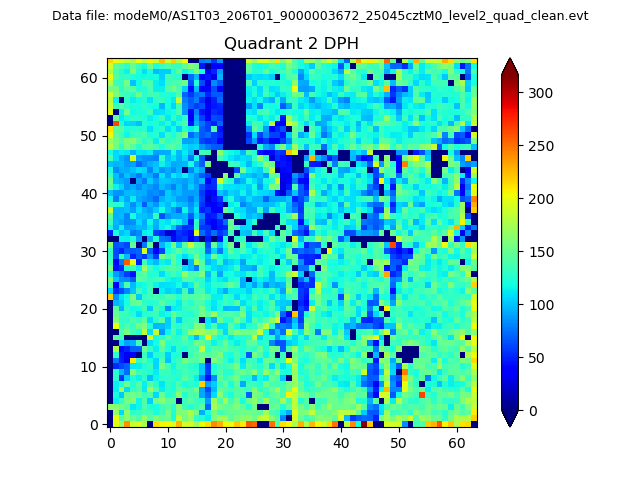
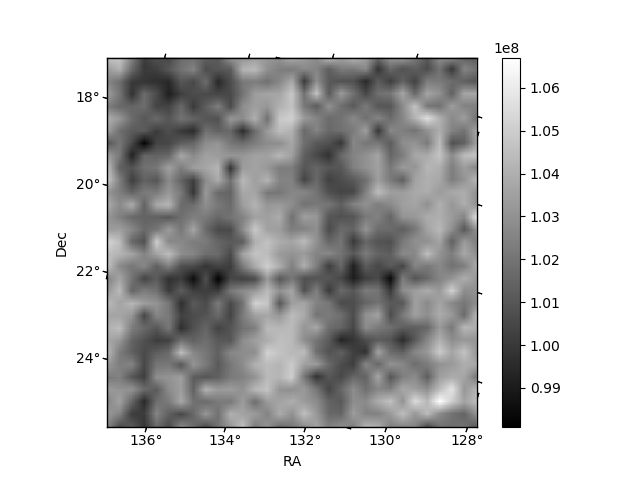
Histogram calculated using DETX and DETY for each event in the final _common_clean file
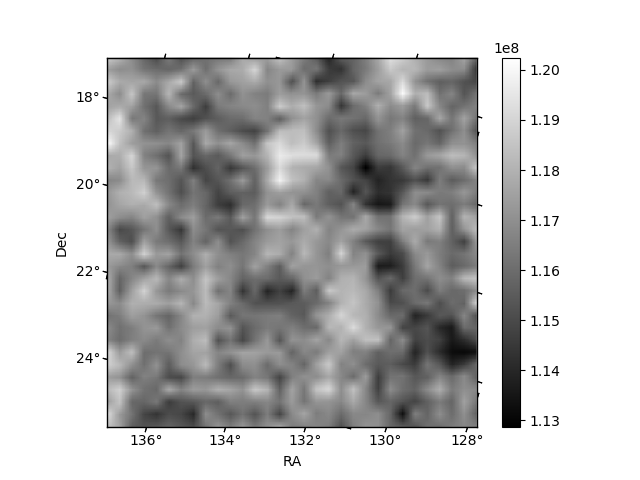
| Quadrant A | 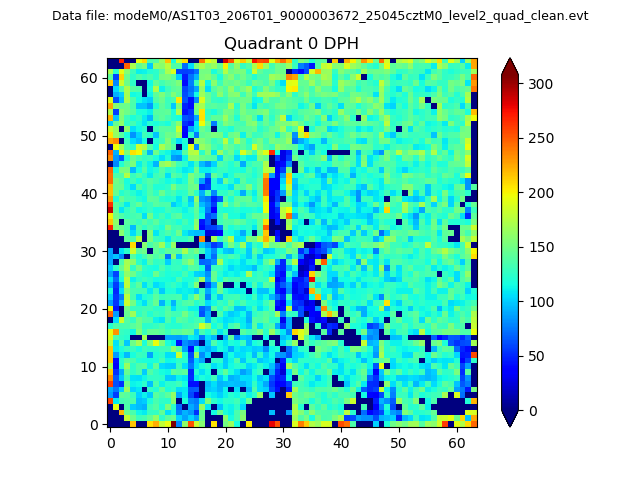 |
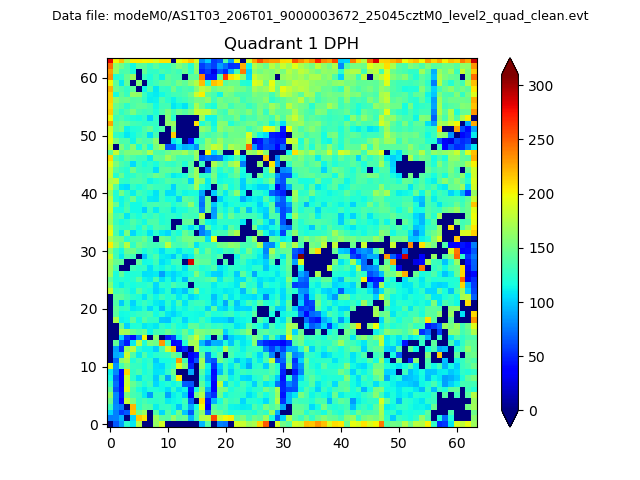 |
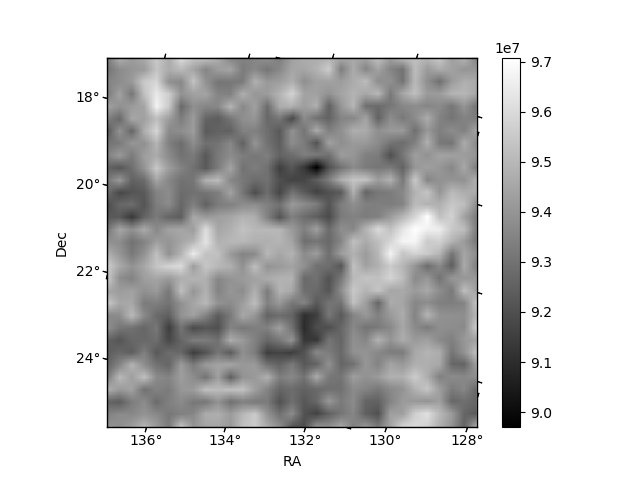
Quadrant B |
|---|---|---|---|
| Quadrant D | 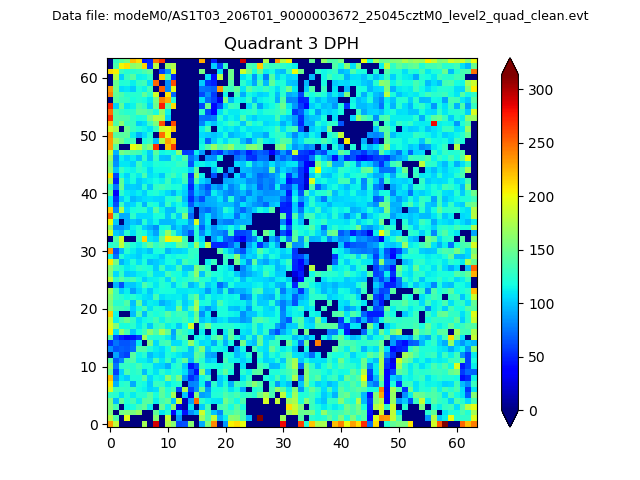 |
 |
Quadrant C |
| Plot type | Count rate plots | Images |
|---|---|---|
| Comparison with Poisson distribution Blue bars denote a histogram of data divided into 1 sec bins. Red curve is a Poisson curve with rate = median count rate of data. |
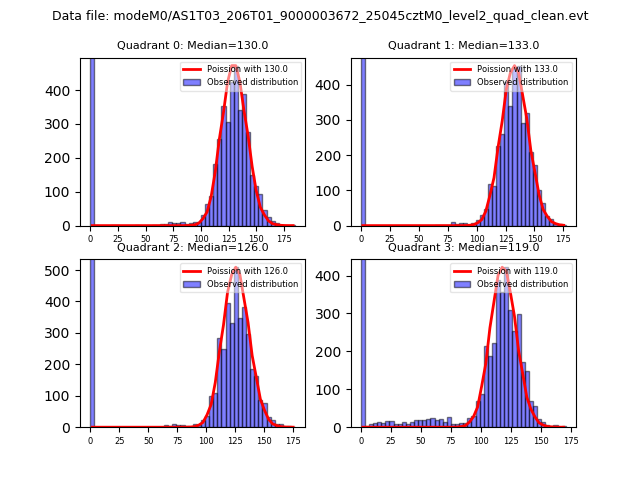 |
 |
| Quadrant-wise count rates Data is divided into 100 sec bins |
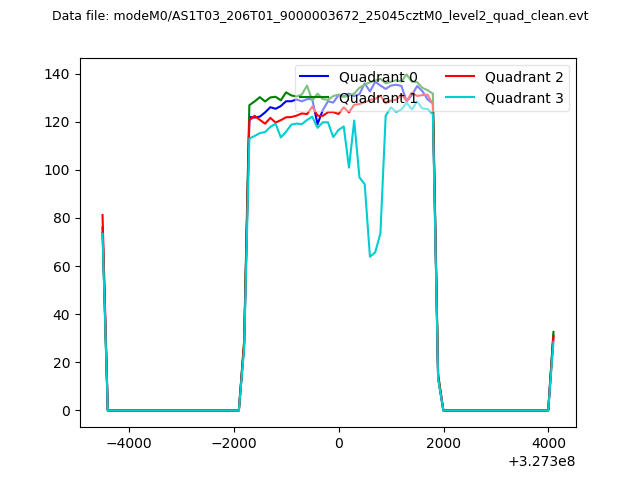 |
|
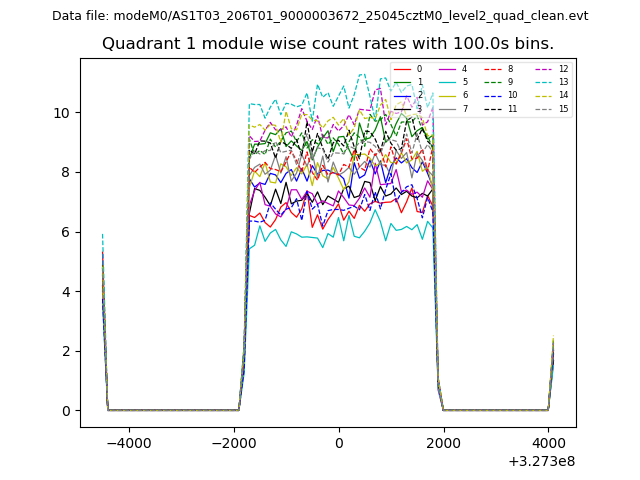
| Module-wise count rates for Quadrant A Data is divided into 100 sec bins |
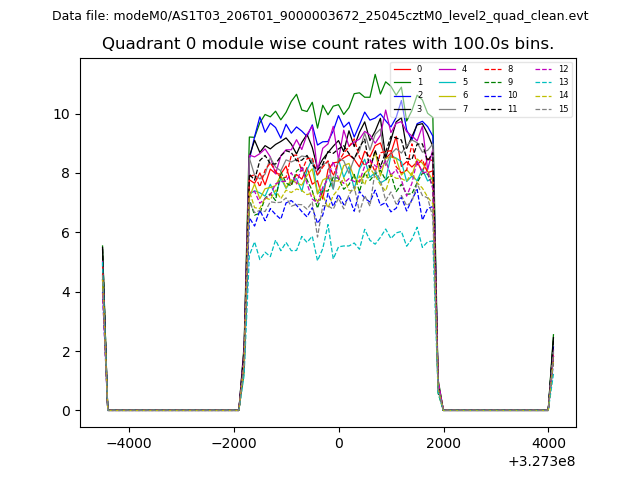 |
 |
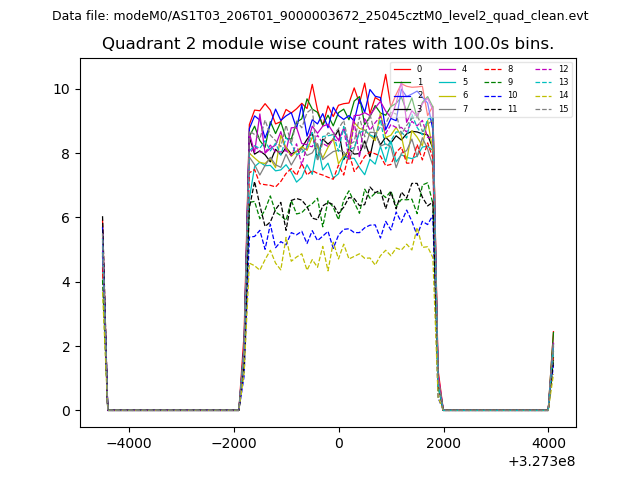
| Module-wise count rates for Quadrant B Data is divided into 100 sec bins |
 |
 |
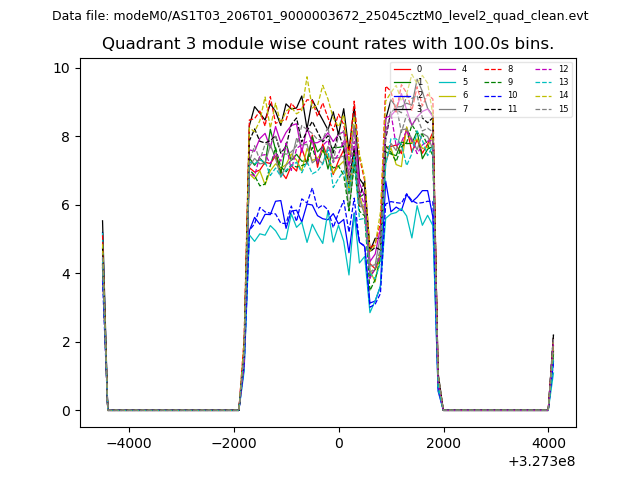
| Module-wise count rates for Quadrant C Data is divided into 100 sec bins |
 |
 |
| Module-wise count rates for Quadrant D Data is divided into 100 sec bins |
 |
 |
| Parameter | Plot |
|---|---|
| CZT HV Monitor | 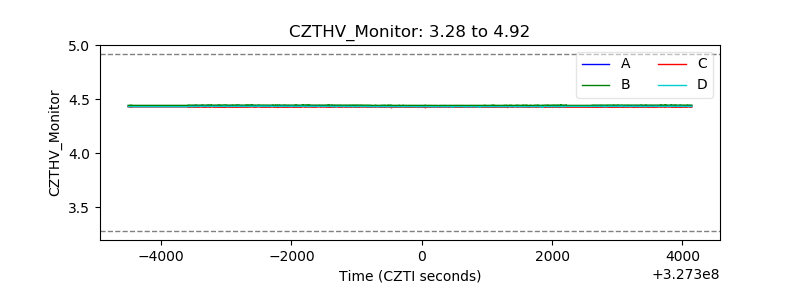 |
| D_VDD | 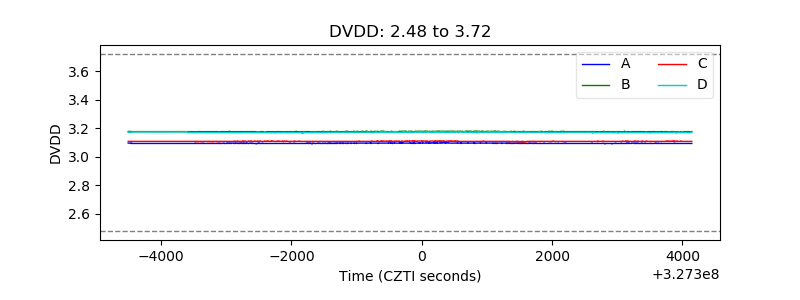 |
| Temperature 1 | 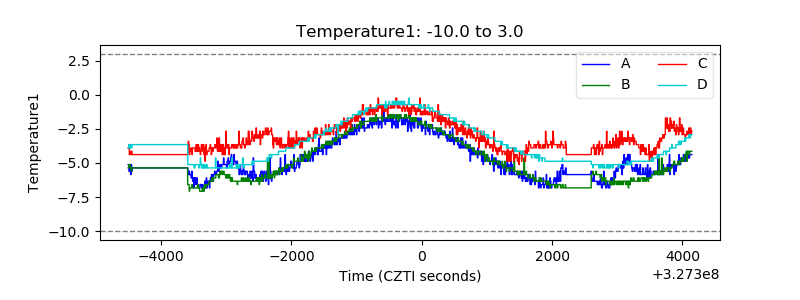 |
| Veto HV Monitor | 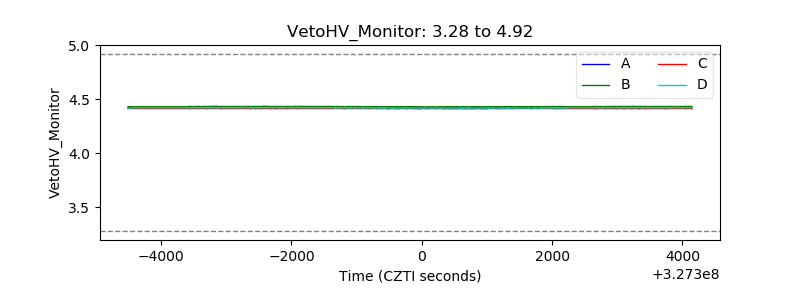 |
| Veto LLD | 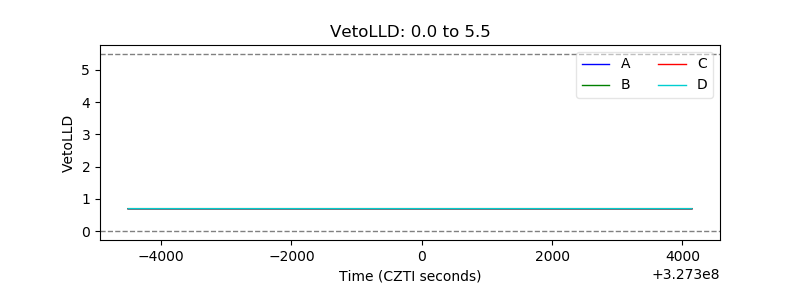 |
| Alpha Counter | 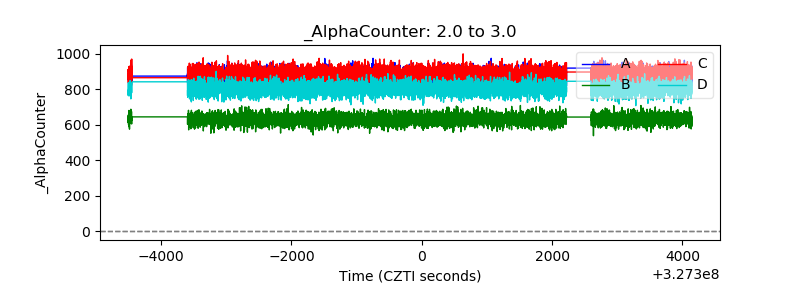 |
| _CPM_Rate | 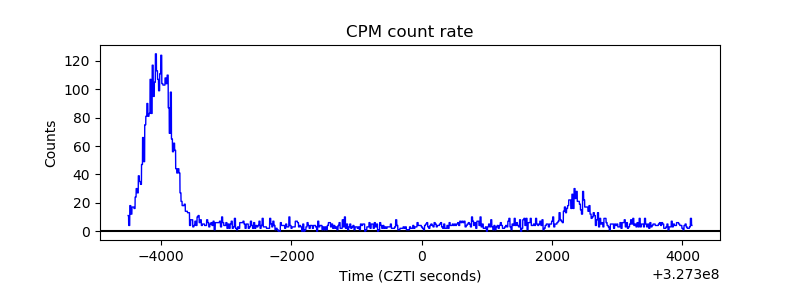 |
| CZT Counter | 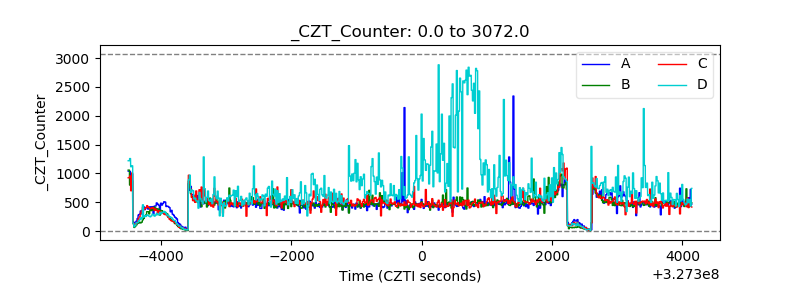 |
| +2.5 Volts monitor |  |
| +5 Volts monitor | 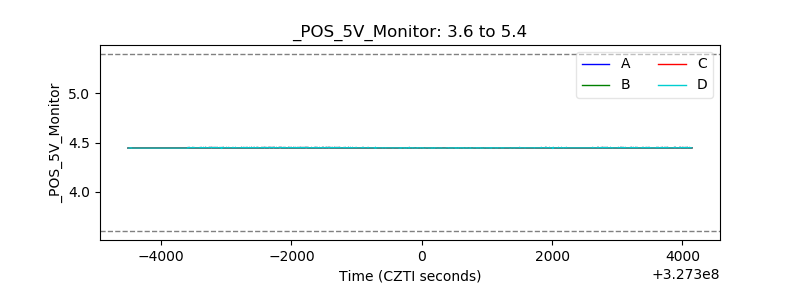 |
| _ROLL_ROT | 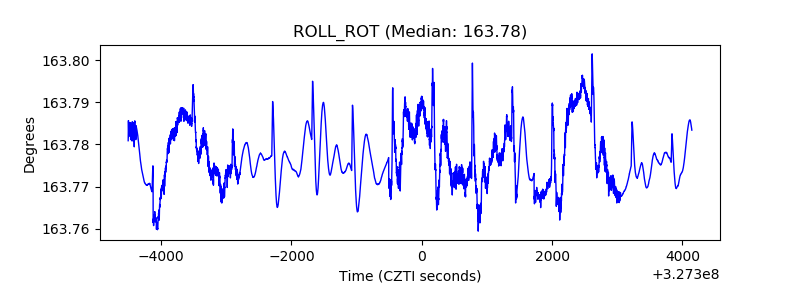 |
| _Roll_DEC |  |
| _Roll_RA |  |
| Veto Counter | 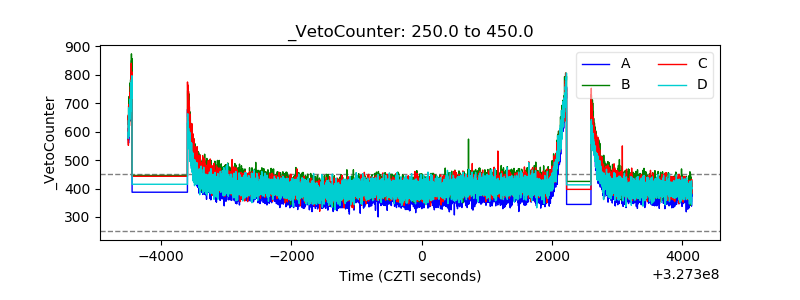 |