| Param | Original file | Final file |
|---|---|---|
| Filename | modeM0/AS1T03_206T01_9000003672_25046cztM0_level2.evt | modeM0/AS1T03_206T01_9000003672_25046cztM0_level2_quad_clean.evt |
| Size (bytes) | 1,357,747,200 | 222,773,760 |
| Size | 1.3 GB | 212.5 MB |
| Events in quadrant A | 8,842,388 | 1,423,951 |
| Events in quadrant B | 8,812,392 | 1,447,855 |
| Events in quadrant C | 8,834,648 | 1,374,988 |
| Events in quadrant D | 13,449,327 | 1,294,803 |
| Mode M9 | |||
|---|---|---|---|
| Quadrant | BADHDUFLAG | Total packets | Discarded packets |
| A | 0 | 14 | 0 |
| B | 0 | 14 | 0 |
| C | 0 | 14 | 0 |
| D | 0 | 14 | 0 |
| Mode SS | |||
|---|---|---|---|
| Quadrant | BADHDUFLAG | Total packets | Discarded packets |
| A | 0 | 354 | 0 |
| B | 0 | 354 | 0 |
| C | 0 | 354 | 0 |
| D | 0 | 354 | 0 |
| Mode M0 | |||
|---|---|---|---|
| Quadrant | BADHDUFLAG | Total packets | Discarded packets |
| A | 0 | 37178 | 3 |
| B | 0 | 36917 | 3 |
| C | 0 | 36739 | 3 |
| D | 0 | 51962 | 3 |
| Quadrant | Total seconds | Saturated seconds | Saturation percentage |
|---|---|---|---|
| A | 17490 | 529 | 3.024585% |
| B | 17490 | 571 | 3.264723% |
| C | 17490 | 568 | 3.247570% |
| D | 17490 | 849 | 4.854202% |
Noise dominated data is calculated using 1-second bins in cleaned event files. If a bin has >2000 counts, and if more than 50% of those come from <1% of pixels, then it is considered to be noise-dominated and hence unusable.
| Quadrant | # 1 sec bins | Bins with >0 counts | Bins with >2000 counts | High rate bins dominated by noise | Noise dominated (total time) | Noise dominated (detector-on time) | Marked lightcurve |
|---|---|---|---|---|---|---|---|
| A | 18785 | 17493 | 34 | 34 | 0.18% | 0.19% | 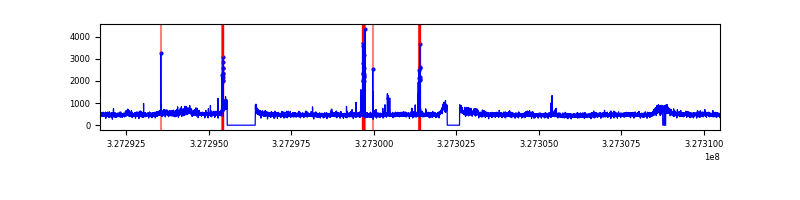 |
| B | 18785 | 17492 | 10 | 10 | 0.05% | 0.06% | 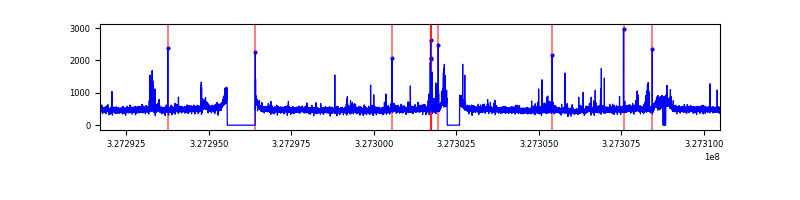 |
| C | 18785 | 17493 | 0 | 0 | 0.00% | 0.00% | 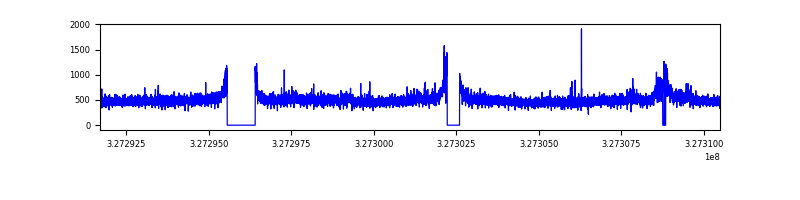 |
| D | 18785 | 17494 | 379 | 379 | 2.02% | 2.17% | 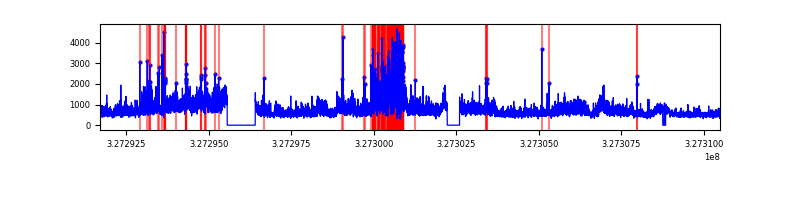 |
Top three noisy pixels from each quadrant. If the there are fewer than three noisy pixels in the level2.evt file, extra rows are filled as -1
| Pixel properties | Quadrant properties | ||||||
|---|---|---|---|---|---|---|---|
| Quadrant | DetID | PixID | Counts | Sigma | Mean | Median | Sigma |
| A | 11 | 208 | 218921 | 493.18 | 2189 | 2137 | 439.6 |
| A | 15 | 174 | 182529 | 410.39 | 2189 | 2137 | 439.6 |
| A | 13 | 254 | 28361 | 59.66 | 2189 | 2137 | 439.6 |
| B | 4 | 80 | 98343 | 231.66 | 2176 | 2123 | 415.4 |
| B | 12 | 111 | 51083 | 117.87 | 2176 | 2123 | 415.4 |
| B | 11 | 111 | 46030 | 105.71 | 2176 | 2123 | 415.4 |
| C | 14 | 238 | 328700 | 668.48 | 2090 | 2106 | 488.6 |
| C | 7 | 247 | 234704 | 476.08 | 2090 | 2106 | 488.6 |
| C | 2 | 16 | 61553 | 121.68 | 2090 | 2106 | 488.6 |
| D | 8 | 195 | 3240852 | 6328.74 | 2096 | 2033 | 511.8 |
| D | 9 | 35 | 1492999 | 2913.39 | 2096 | 2033 | 511.8 |
| D | 12 | 233 | 228253 | 442.04 | 2096 | 2033 | 511.8 |
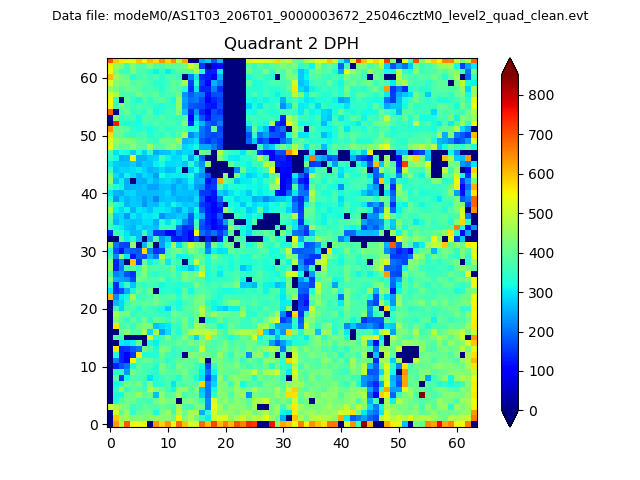
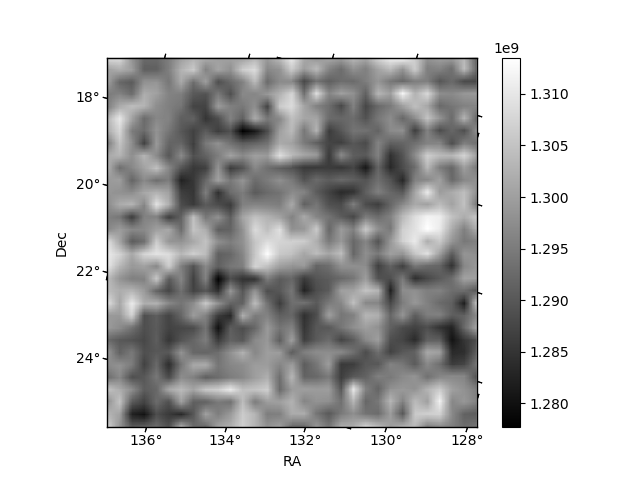
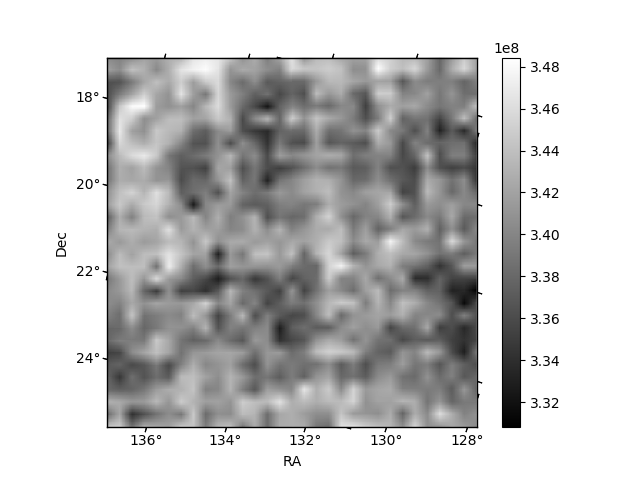
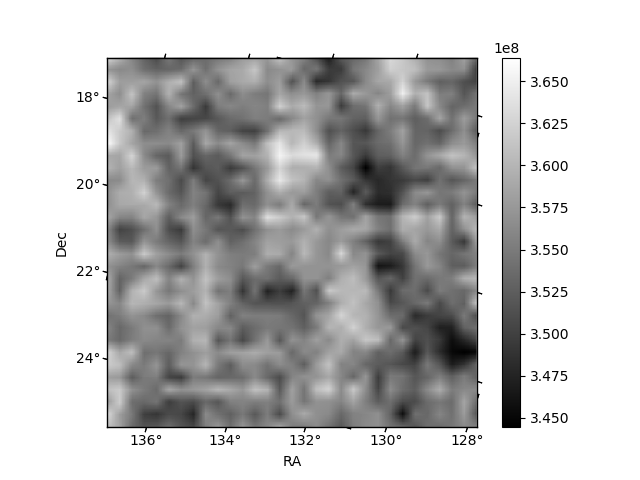
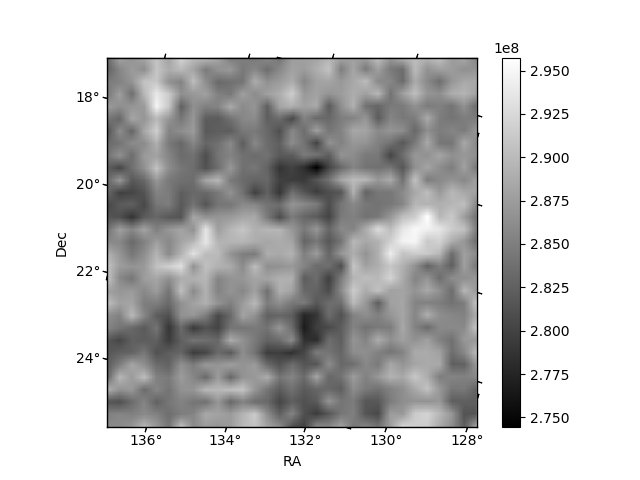
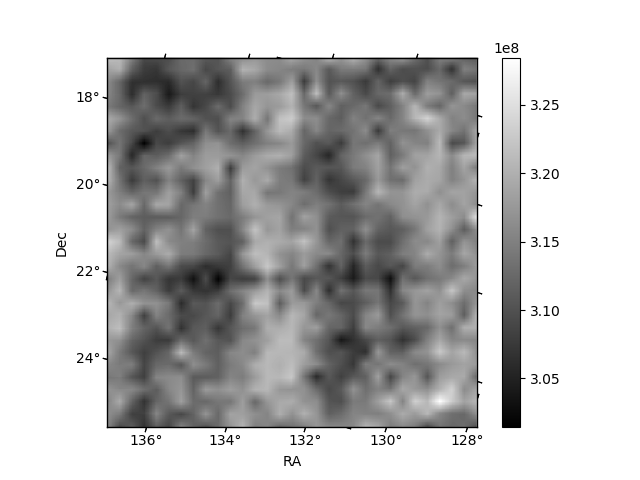
Histogram calculated using DETX and DETY for each event in the final _common_clean file
| Quadrant A | 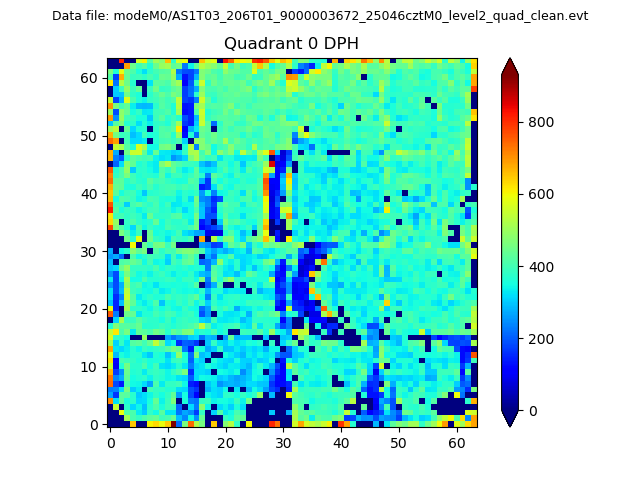 |
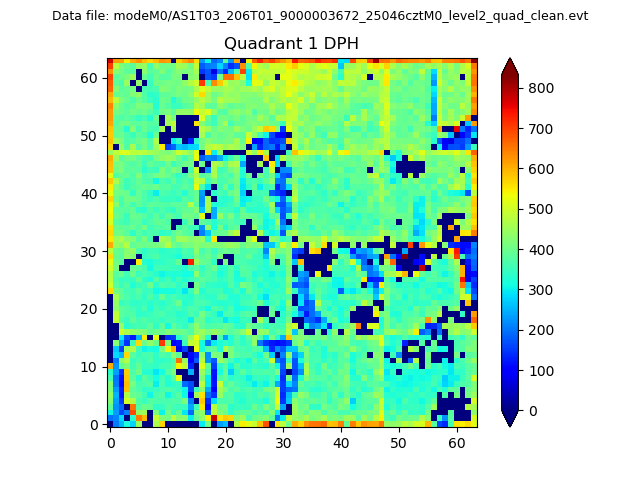 |
Quadrant B |
|---|---|---|---|
| Quadrant D | 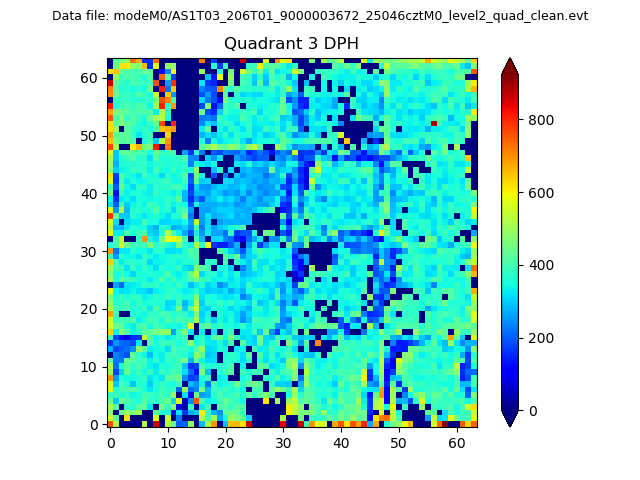 |
 |
Quadrant C |
| Plot type | Count rate plots | Images |
|---|---|---|
| Comparison with Poisson distribution Blue bars denote a histogram of data divided into 1 sec bins. Red curve is a Poisson curve with rate = median count rate of data. |
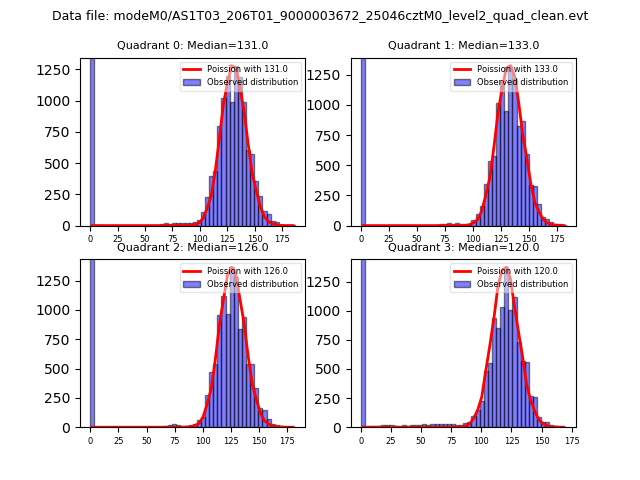 |
 |
| Quadrant-wise count rates Data is divided into 100 sec bins |
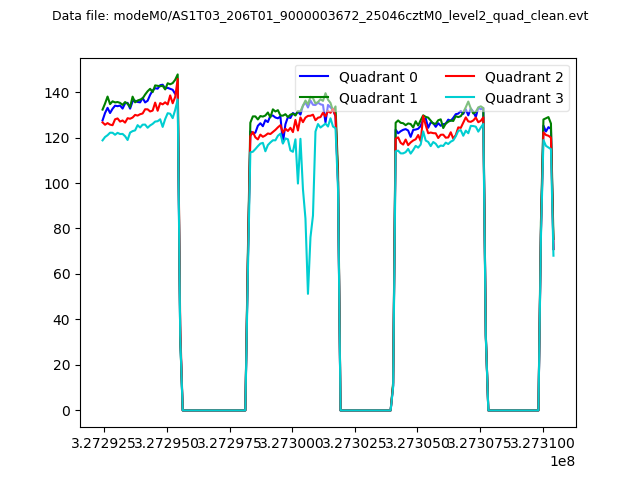 |
|
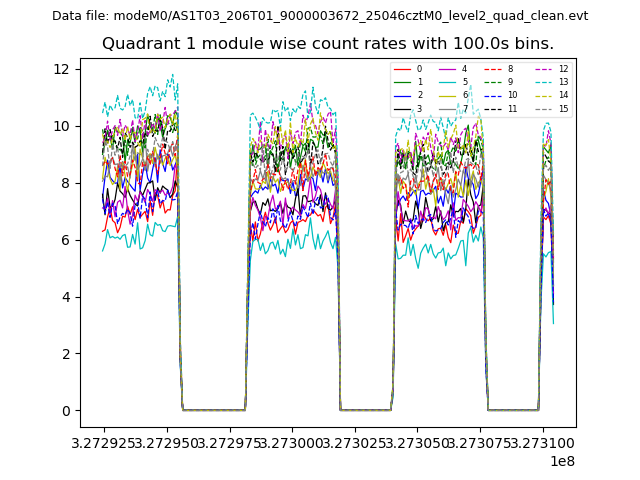
| Module-wise count rates for Quadrant A Data is divided into 100 sec bins |
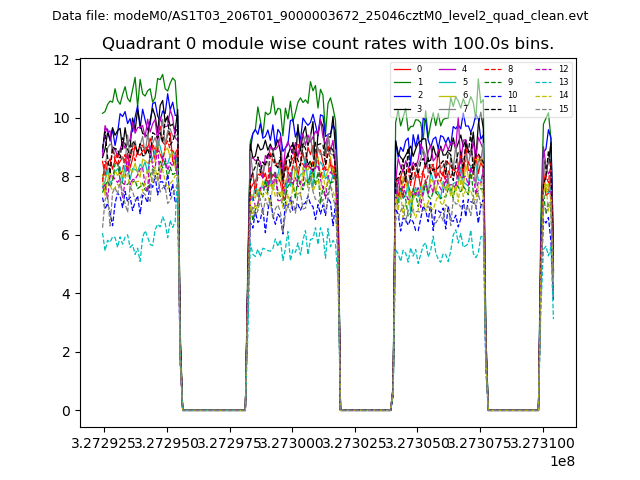 |
 |
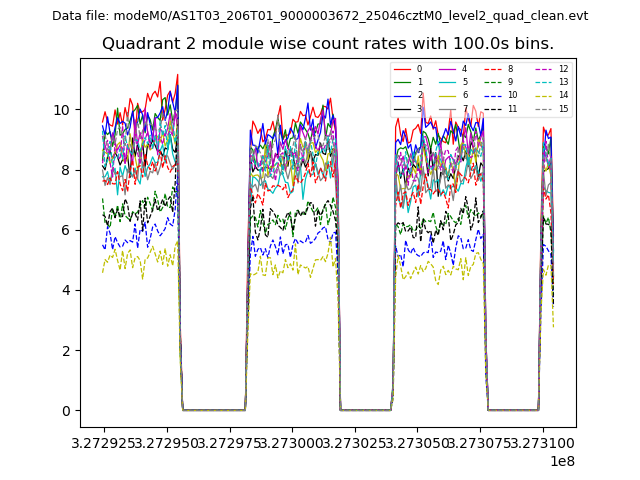
| Module-wise count rates for Quadrant B Data is divided into 100 sec bins |
 |
 |
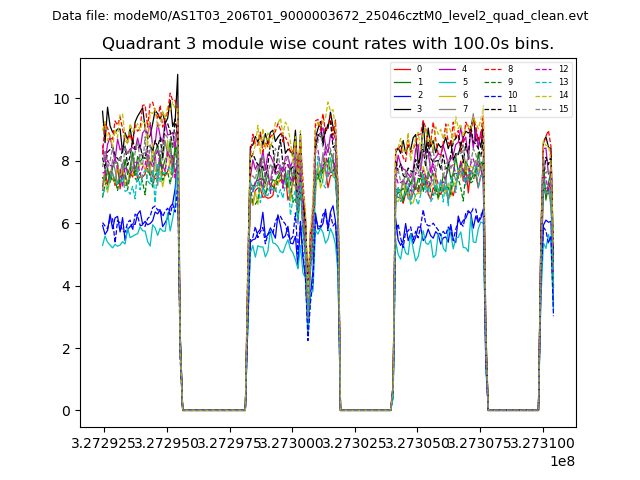
| Module-wise count rates for Quadrant C Data is divided into 100 sec bins |
 |
 |
| Module-wise count rates for Quadrant D Data is divided into 100 sec bins |
 |
 |
| Parameter | Plot |
|---|---|
| CZT HV Monitor | 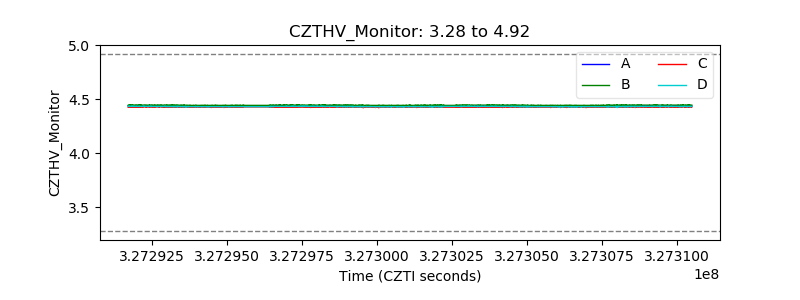 |
| D_VDD | 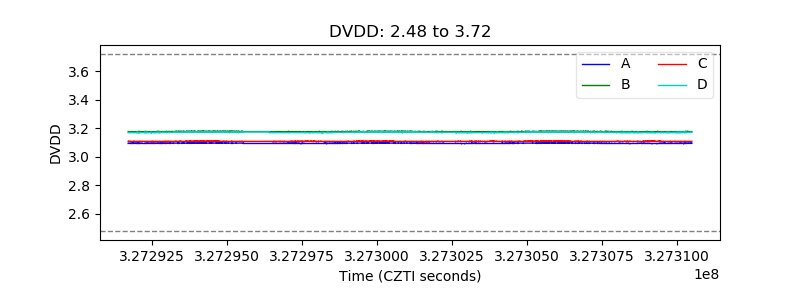 |
| Temperature 1 | 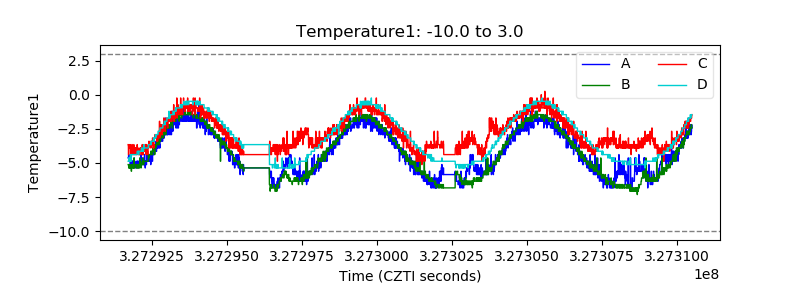 |
| Veto HV Monitor | 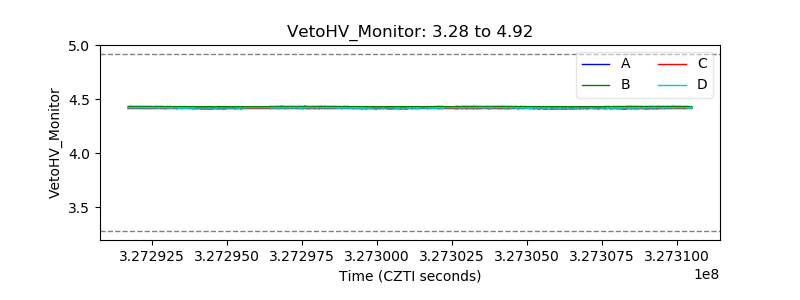 |
| Veto LLD | 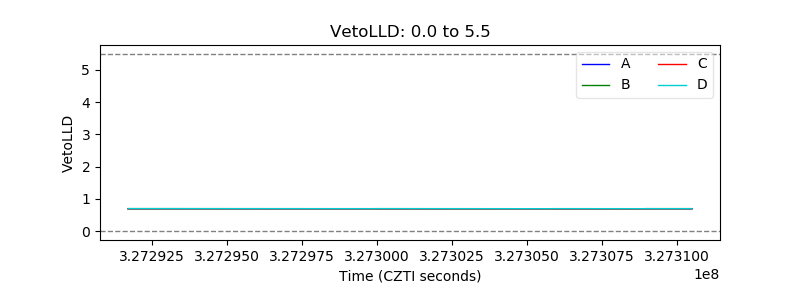 |
| Alpha Counter | 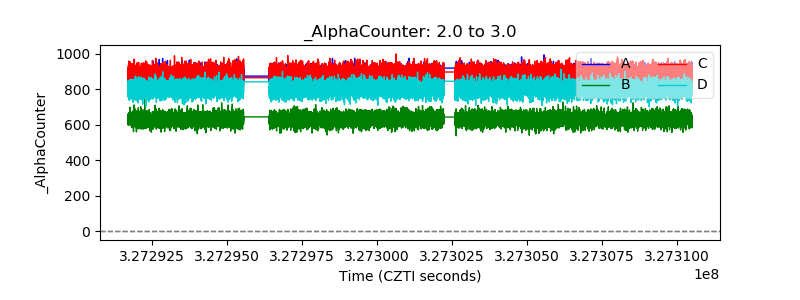 |
| _CPM_Rate | 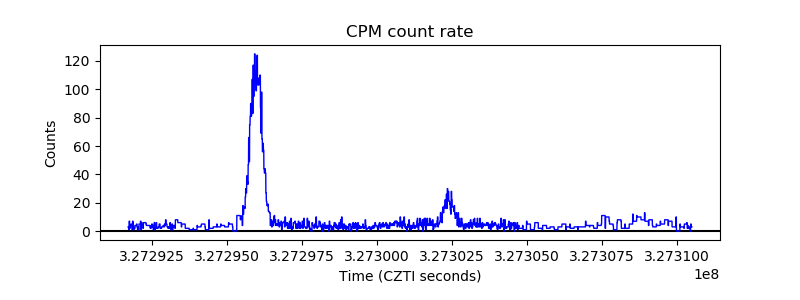 |
| CZT Counter |  |
| +2.5 Volts monitor |  |
| +5 Volts monitor |  |
| _ROLL_ROT |  |
| _Roll_DEC |  |
| _Roll_RA | 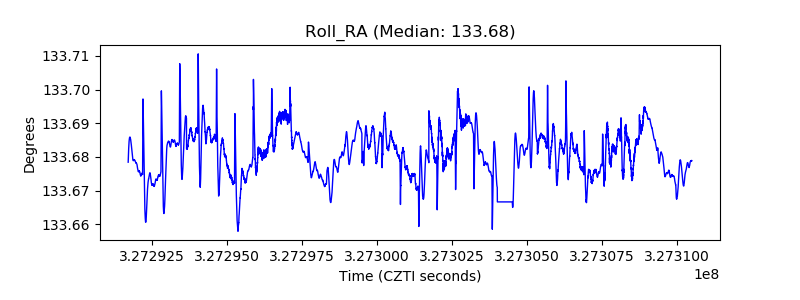 |
| Veto Counter |  |