| Param | Original file | Final file |
|---|---|---|
| Filename | modeM0/AS1T03_206T01_9000003672_25047cztM0_level2.evt | modeM0/AS1T03_206T01_9000003672_25047cztM0_level2_quad_clean.evt |
| Size (bytes) | 617,762,880 | 94,901,760 |
| Size | 589.1 MB | 90.5 MB |
| Events in quadrant A | 3,871,175 | 595,256 |
| Events in quadrant B | 4,097,287 | 603,871 |
| Events in quadrant C | 4,111,520 | 568,421 |
| Events in quadrant D | 6,089,826 | 553,748 |
| Mode M9 | |||
|---|---|---|---|
| Quadrant | BADHDUFLAG | Total packets | Discarded packets |
| A | 0 | 5 | 0 |
| B | 0 | 5 | 0 |
| C | 0 | 5 | 0 |
| D | 0 | 5 | 0 |
| Mode SS | |||
|---|---|---|---|
| Quadrant | BADHDUFLAG | Total packets | Discarded packets |
| A | 0 | 162 | 0 |
| B | 0 | 162 | 0 |
| C | 0 | 162 | 0 |
| D | 0 | 162 | 0 |
| Mode M0 | |||
|---|---|---|---|
| Quadrant | BADHDUFLAG | Total packets | Discarded packets |
| A | 0 | 16570 | 2 |
| B | 0 | 17186 | 2 |
| C | 0 | 17194 | 2 |
| D | 0 | 23399 | 2 |
| Quadrant | Total seconds | Saturated seconds | Saturation percentage |
|---|---|---|---|
| A | 7951 | 332 | 4.175575% |
| B | 7951 | 402 | 5.055968% |
| C | 7952 | 416 | 5.231388% |
| D | 7952 | 520 | 6.539235% |
Noise dominated data is calculated using 1-second bins in cleaned event files. If a bin has >2000 counts, and if more than 50% of those come from <1% of pixels, then it is considered to be noise-dominated and hence unusable.
| Quadrant | # 1 sec bins | Bins with >0 counts | Bins with >2000 counts | High rate bins dominated by noise | Noise dominated (total time) | Noise dominated (detector-on time) | Marked lightcurve |
|---|---|---|---|---|---|---|---|
| A | 8351 | 7954 | 0 | 0 | 0.00% | 0.00% | 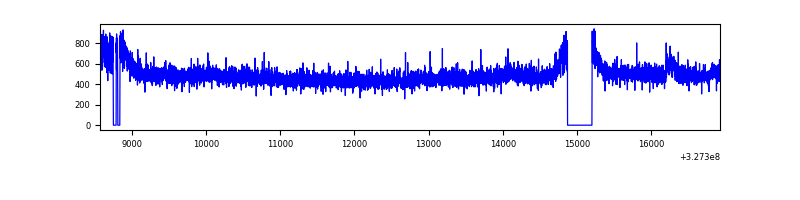 |
| B | 8351 | 7954 | 32 | 32 | 0.38% | 0.40% | 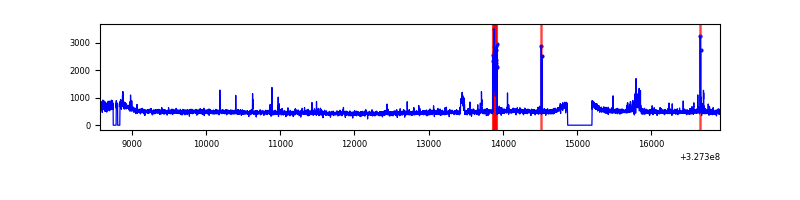 |
| C | 8352 | 7955 | 30 | 30 | 0.36% | 0.38% | 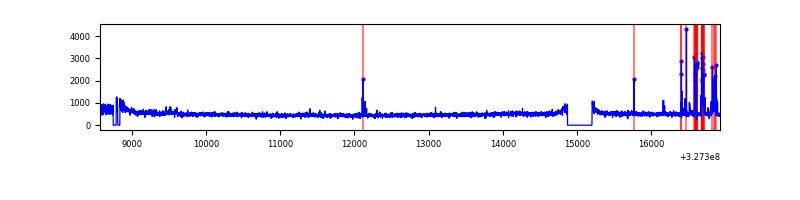 |
| D | 8352 | 7955 | 175 | 175 | 2.10% | 2.20% | 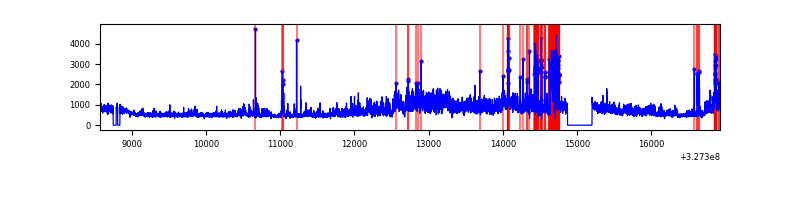 |
Top three noisy pixels from each quadrant. If the there are fewer than three noisy pixels in the level2.evt file, extra rows are filled as -1
| Pixel properties | Quadrant properties | ||||||
|---|---|---|---|---|---|---|---|
| Quadrant | DetID | PixID | Counts | Sigma | Mean | Median | Sigma |
| A | 11 | 208 | 32665 | 156.1 | 995 | 968 | 203.1 |
| A | 13 | 254 | 12390 | 56.25 | 995 | 968 | 203.1 |
| A | 3 | 137 | 9239 | 40.73 | 995 | 968 | 203.1 |
| B | 3 | 64 | 123338 | 637.23 | 984 | 957 | 192.1 |
| B | 10 | 249 | 50937 | 260.24 | 984 | 957 | 192.1 |
| B | 0 | 245 | 24782 | 124.06 | 984 | 957 | 192.1 |
| C | 2 | 16 | 182896 | 813.3 | 947 | 951 | 223.7 |
| C | 14 | 238 | 149208 | 662.71 | 947 | 951 | 223.7 |
| C | 7 | 247 | 71780 | 316.61 | 947 | 951 | 223.7 |
| D | 8 | 195 | 1699406 | 7315.97 | 953 | 925 | 232.2 |
| D | 1 | 52 | 526134 | 2262.27 | 953 | 925 | 232.2 |
| D | 12 | 233 | 140160 | 599.74 | 953 | 925 | 232.2 |
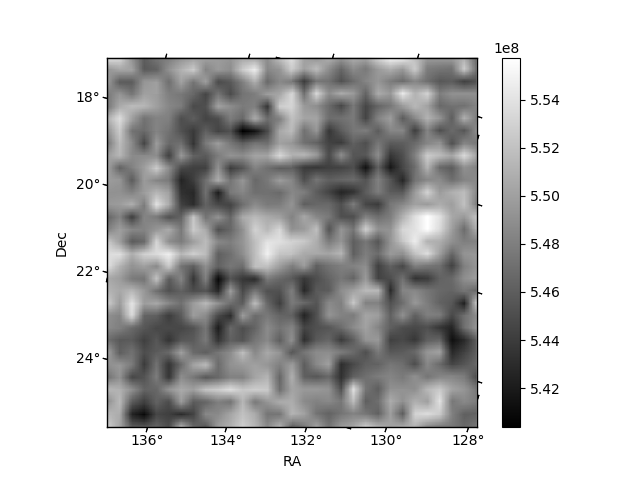
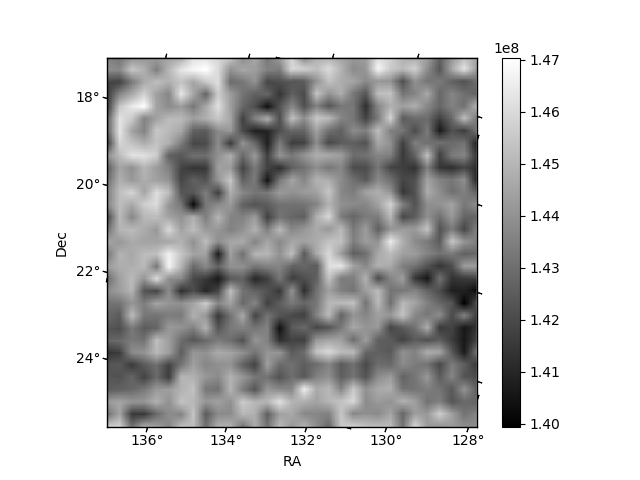
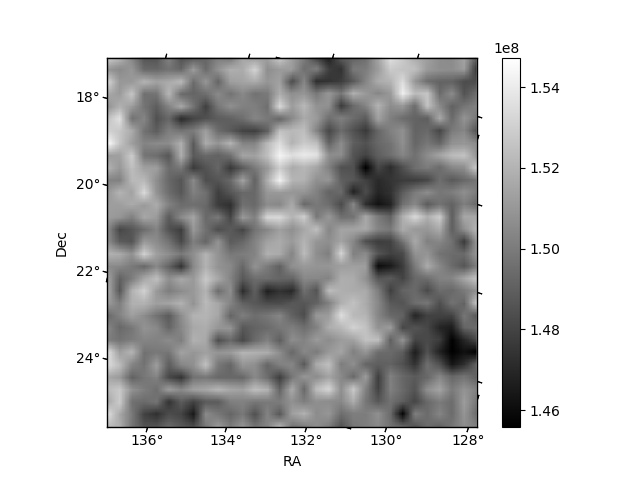
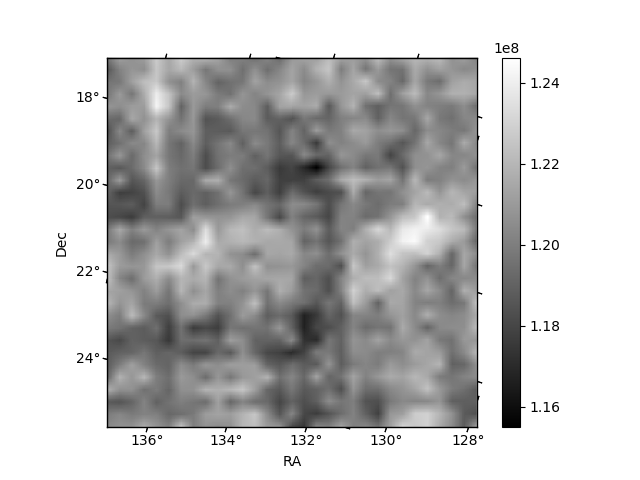
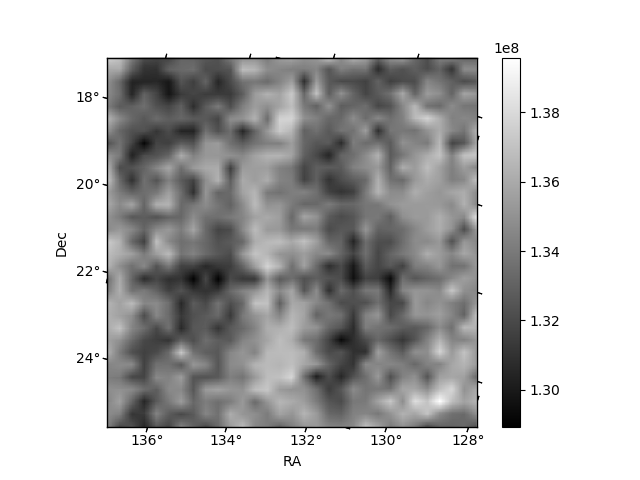
Histogram calculated using DETX and DETY for each event in the final _common_clean file
| Quadrant A | 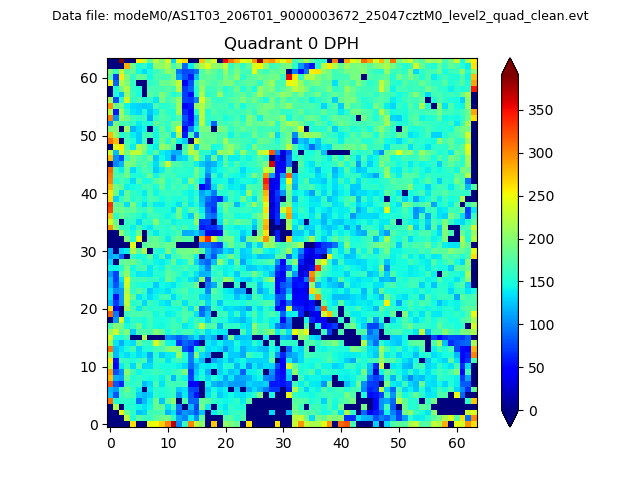 |
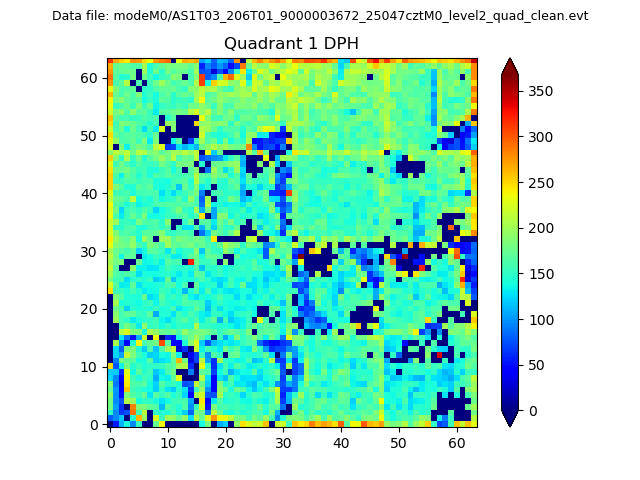 |
Quadrant B |
|---|---|---|---|
| Quadrant D | 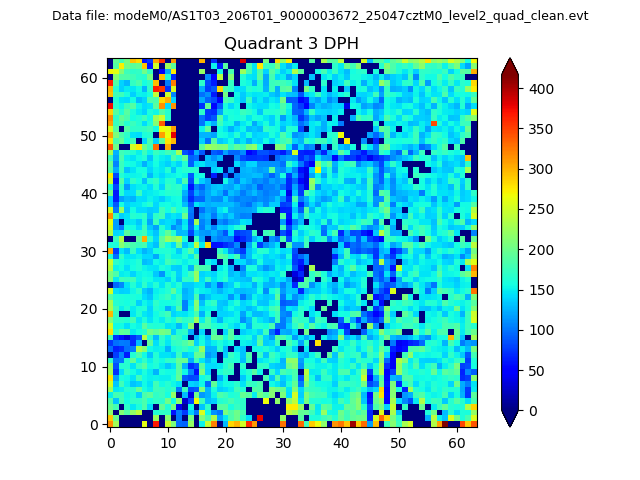 |
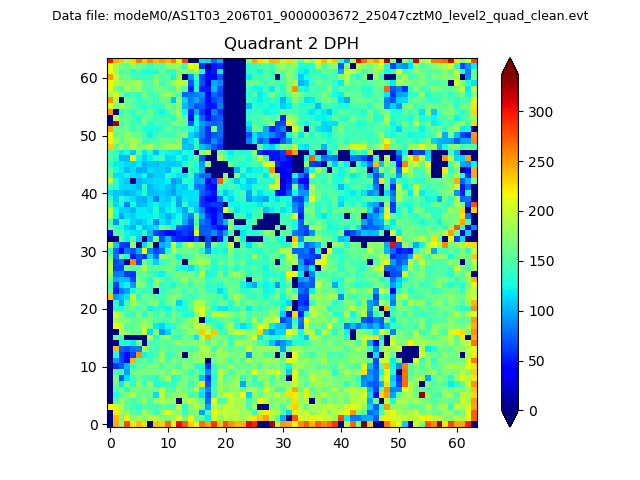 |
Quadrant C |
| Plot type | Count rate plots | Images |
|---|---|---|
| Comparison with Poisson distribution Blue bars denote a histogram of data divided into 1 sec bins. Red curve is a Poisson curve with rate = median count rate of data. |
 |
 |
| Quadrant-wise count rates Data is divided into 100 sec bins |
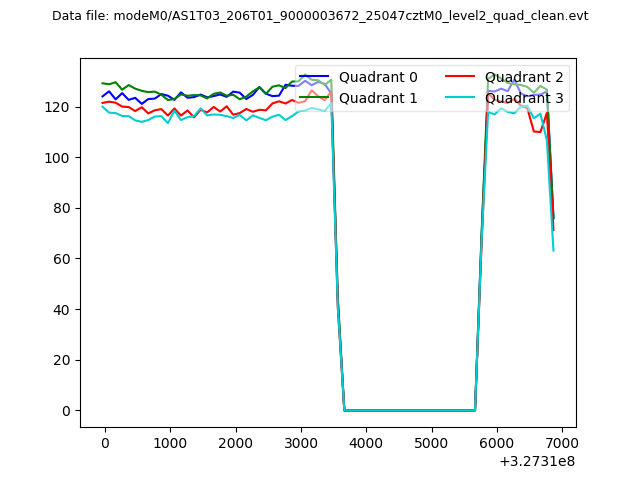 |
|
| Module-wise count rates for Quadrant A Data is divided into 100 sec bins |
 |
 |
| Module-wise count rates for Quadrant B Data is divided into 100 sec bins |
 |
 |
| Module-wise count rates for Quadrant C Data is divided into 100 sec bins |
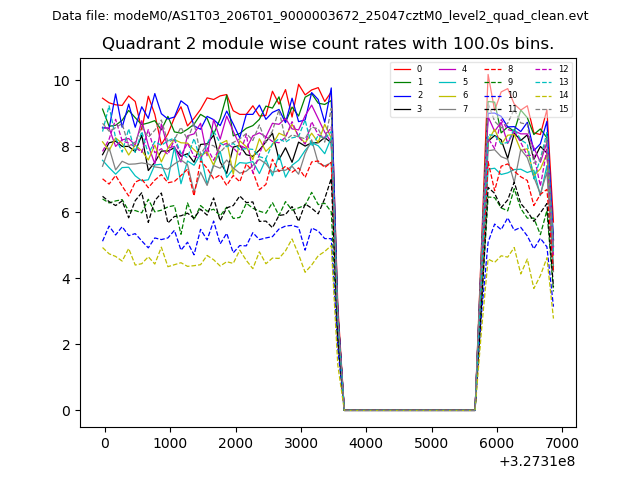 |
 |
| Module-wise count rates for Quadrant D Data is divided into 100 sec bins |
 |
 |
| Parameter | Plot |
|---|---|
| CZT HV Monitor | 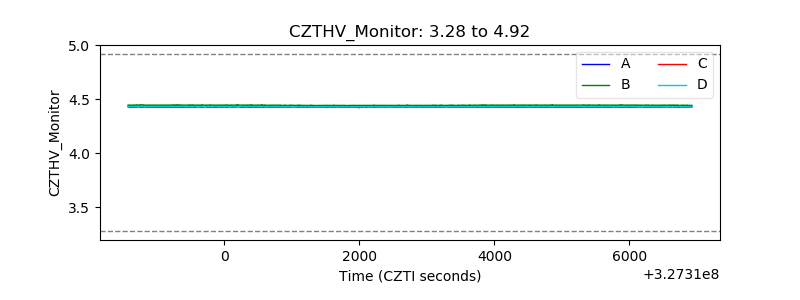 |
| D_VDD | 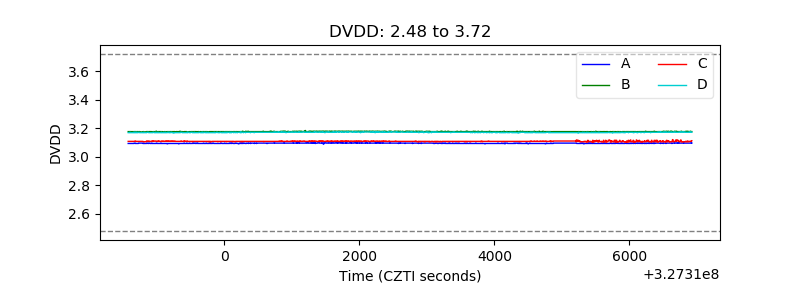 |
| Temperature 1 | 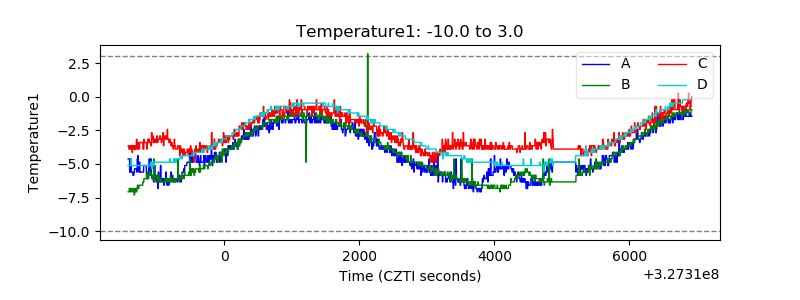 |
| Veto HV Monitor | 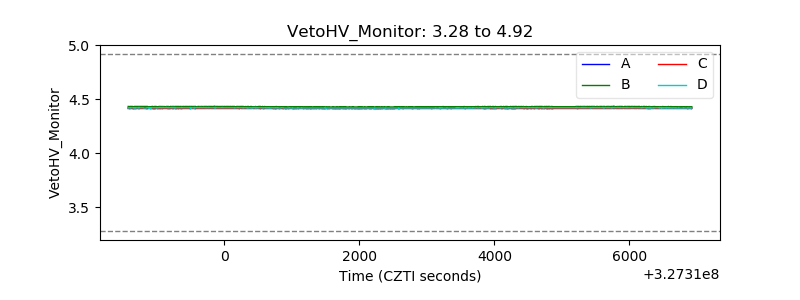 |
| Veto LLD | 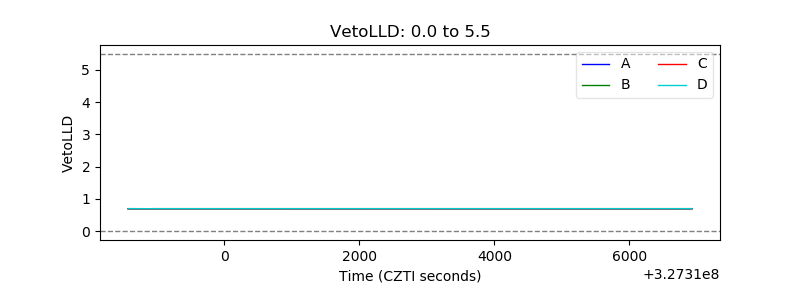 |
| Alpha Counter | 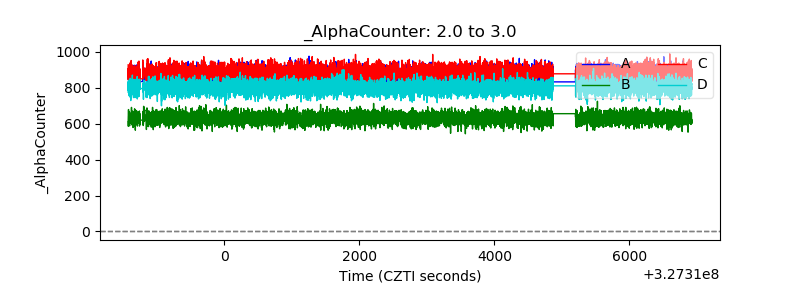 |
| _CPM_Rate | 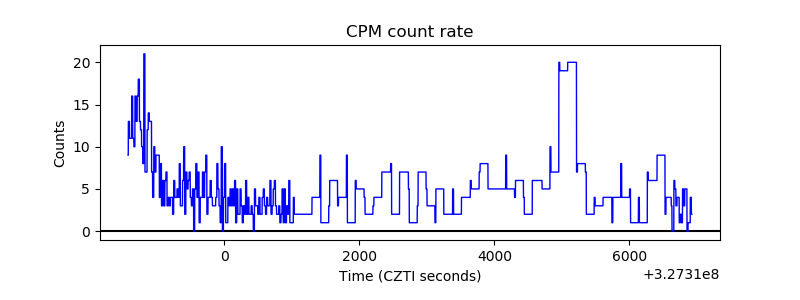 |
| CZT Counter | 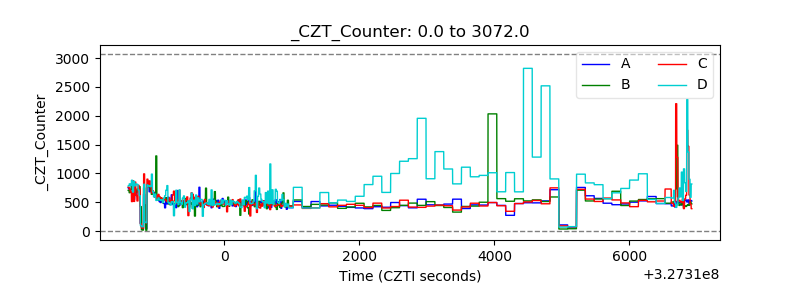 |
| +2.5 Volts monitor |  |
| +5 Volts monitor | 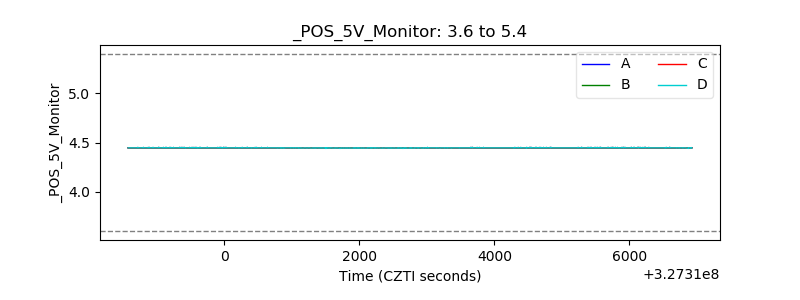 |
| _ROLL_ROT | 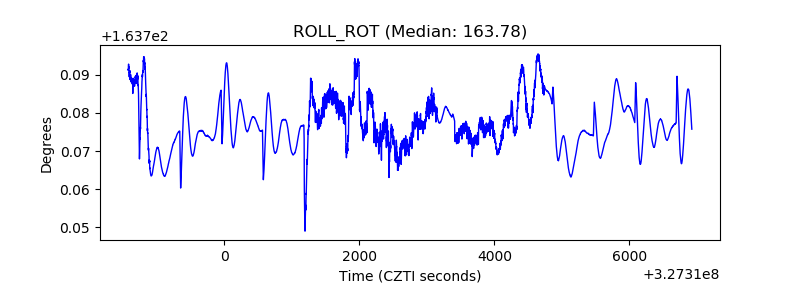 |
| _Roll_DEC | 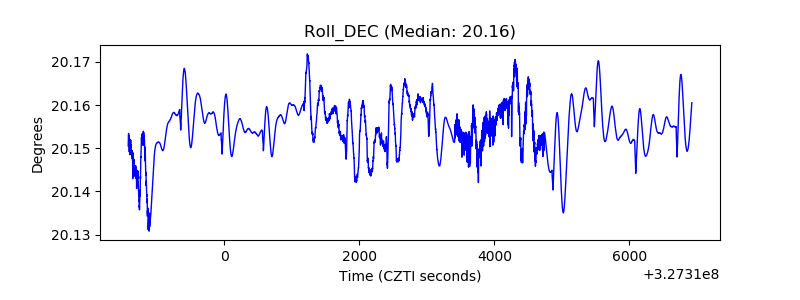 |
| _Roll_RA | 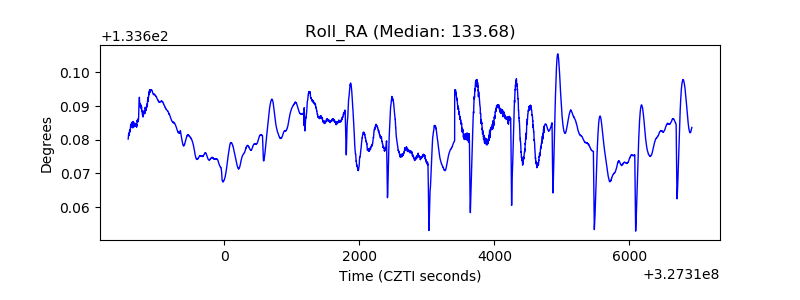 |
| Veto Counter | 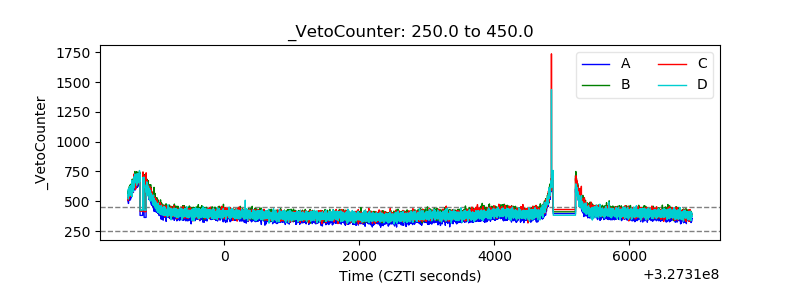 |