| Param | Original file | Final file |
|---|---|---|
| Filename | modeM0/AS1T03_206T01_9000003672_25049cztM0_level2.evt | modeM0/AS1T03_206T01_9000003672_25049cztM0_level2_quad_clean.evt |
| Size (bytes) | 1,019,603,520 | 164,652,480 |
| Size | 972.4 MB | 157.0 MB |
| Events in quadrant A | 5,834,630 | 1,078,059 |
| Events in quadrant B | 6,058,470 | 1,087,654 |
| Events in quadrant C | 6,058,016 | 1,032,376 |
| Events in quadrant D | 12,109,064 | 949,975 |
| Mode M9 | |||
|---|---|---|---|
| Quadrant | BADHDUFLAG | Total packets | Discarded packets |
| A | 0 | 12 | 0 |
| B | 0 | 12 | 0 |
| C | 0 | 12 | 0 |
| D | 0 | 12 | 0 |
| Mode SS | |||
|---|---|---|---|
| Quadrant | BADHDUFLAG | Total packets | Discarded packets |
| A | 0 | 246 | 0 |
| B | 0 | 246 | 0 |
| C | 0 | 246 | 0 |
| D | 0 | 246 | 0 |
| Mode M0 | |||
|---|---|---|---|
| Quadrant | BADHDUFLAG | Total packets | Discarded packets |
| A | 0 | 24925 | 2 |
| B | 0 | 25607 | 2 |
| C | 0 | 25563 | 2 |
| D | 0 | 44613 | 2 |
| Quadrant | Total seconds | Saturated seconds | Saturation percentage |
|---|---|---|---|
| A | 12128 | 89 | 0.733839% |
| B | 12128 | 125 | 1.030673% |
| C | 12128 | 178 | 1.467678% |
| D | 12128 | 994 | 8.195910% |
Noise dominated data is calculated using 1-second bins in cleaned event files. If a bin has >2000 counts, and if more than 50% of those come from <1% of pixels, then it is considered to be noise-dominated and hence unusable.
| Quadrant | # 1 sec bins | Bins with >0 counts | Bins with >2000 counts | High rate bins dominated by noise | Noise dominated (total time) | Noise dominated (detector-on time) | Marked lightcurve |
|---|---|---|---|---|---|---|---|
| A | 13338 | 12130 | 3 | 3 | 0.02% | 0.02% | 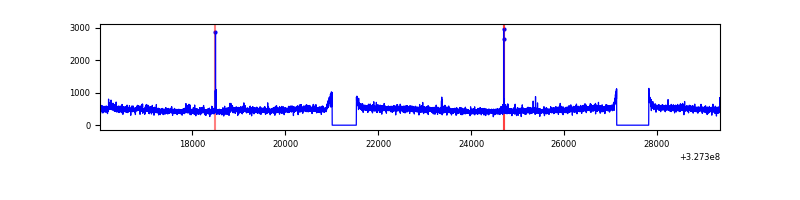 |
| B | 13338 | 12129 | 15 | 15 | 0.11% | 0.12% | 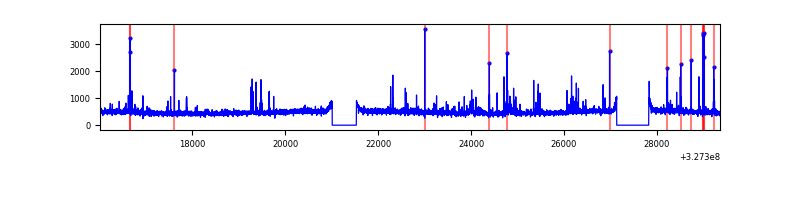 |
| C | 13338 | 12129 | 33 | 33 | 0.25% | 0.27% | 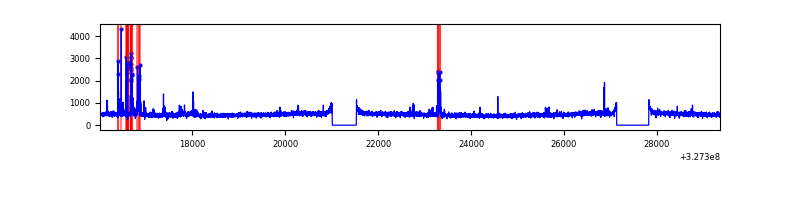 |
| D | 13338 | 12130 | 813 | 813 | 6.10% | 6.70% | 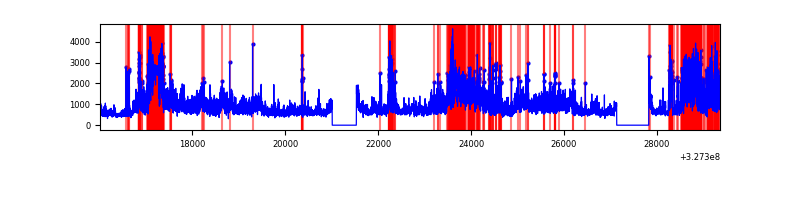 |
Top three noisy pixels from each quadrant. If the there are fewer than three noisy pixels in the level2.evt file, extra rows are filled as -1
| Pixel properties | Quadrant properties | ||||||
|---|---|---|---|---|---|---|---|
| Quadrant | DetID | PixID | Counts | Sigma | Mean | Median | Sigma |
| A | 10 | 17 | 82044 | 269.76 | 1465 | 1431 | 298.8 |
| A | 11 | 208 | 74012 | 242.88 | 1465 | 1431 | 298.8 |
| A | 13 | 254 | 21437 | 66.95 | 1465 | 1431 | 298.8 |
| B | 10 | 251 | 111108 | 394.78 | 1455 | 1417 | 277.9 |
| B | 5 | 172 | 78235 | 276.47 | 1455 | 1417 | 277.9 |
| B | 0 | 190 | 71547 | 252.4 | 1455 | 1417 | 277.9 |
| C | 2 | 16 | 311022 | 939.11 | 1398 | 1406 | 329.7 |
| C | 14 | 238 | 220229 | 663.72 | 1398 | 1406 | 329.7 |
| C | 7 | 247 | 31259 | 90.55 | 1398 | 1406 | 329.7 |
| D | 8 | 195 | 3430074 | 10192.67 | 1378 | 1338 | 336.4 |
| D | 12 | 233 | 1892503 | 5621.9 | 1378 | 1338 | 336.4 |
| D | 7 | 238 | 1010807 | 3000.87 | 1378 | 1338 | 336.4 |
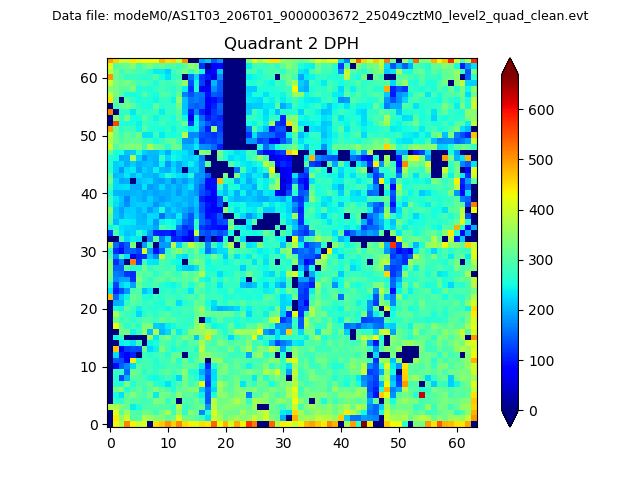
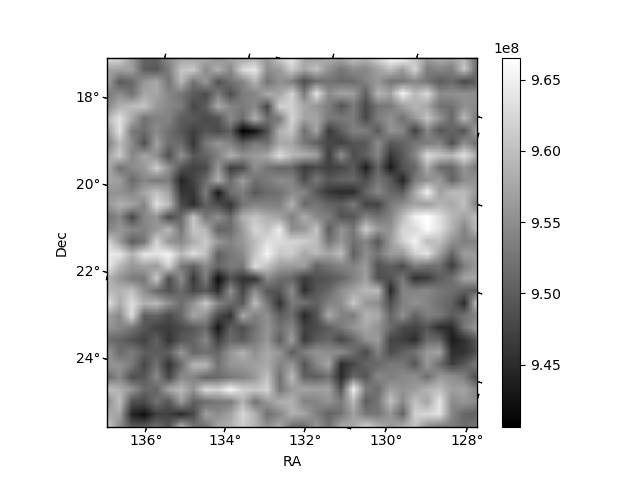
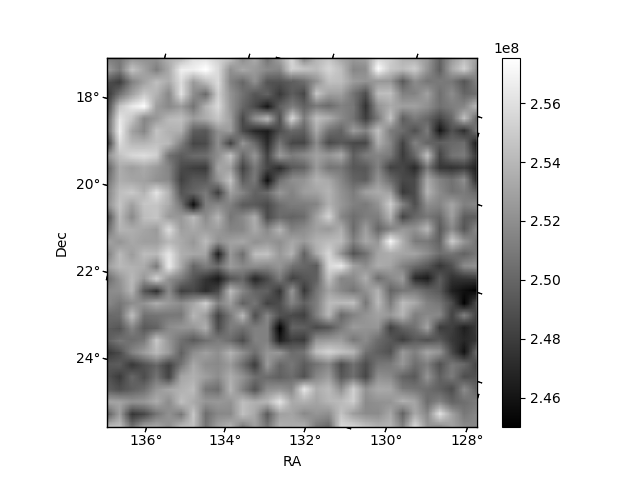
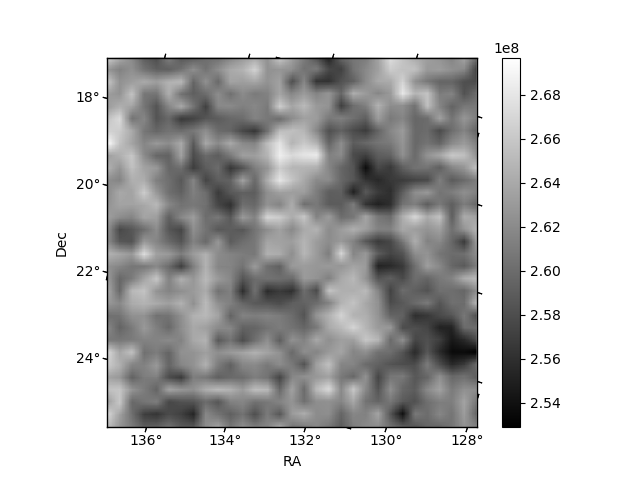
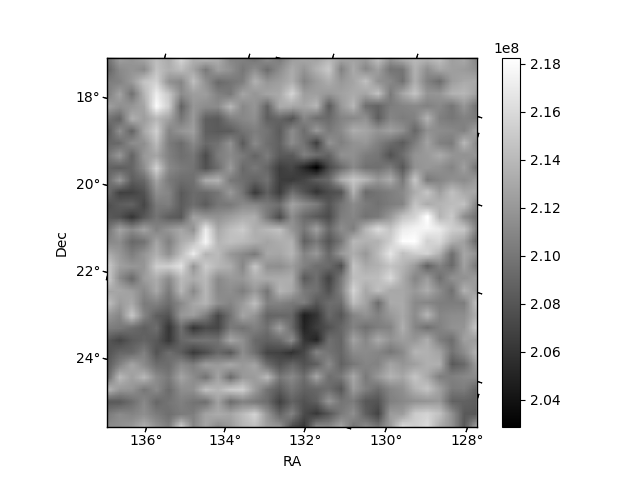
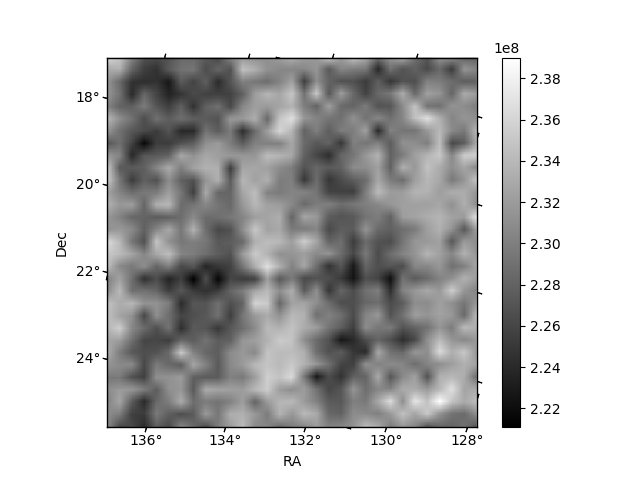
Histogram calculated using DETX and DETY for each event in the final _common_clean file
| Quadrant A | 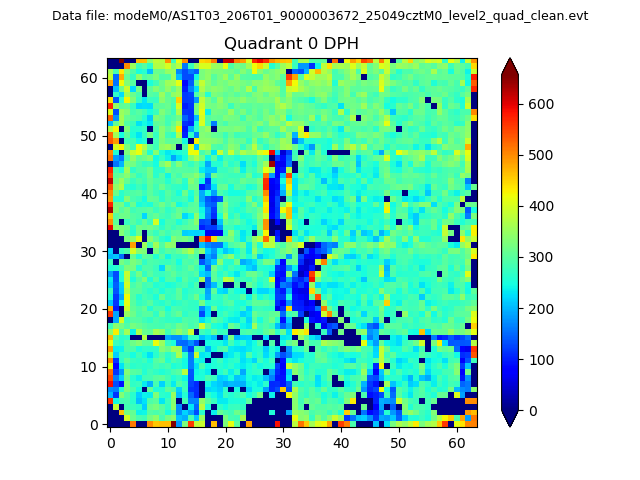 |
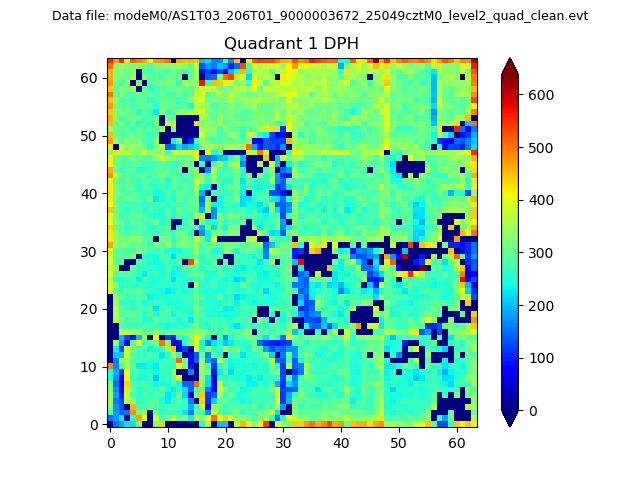 |
Quadrant B |
|---|---|---|---|
| Quadrant D | 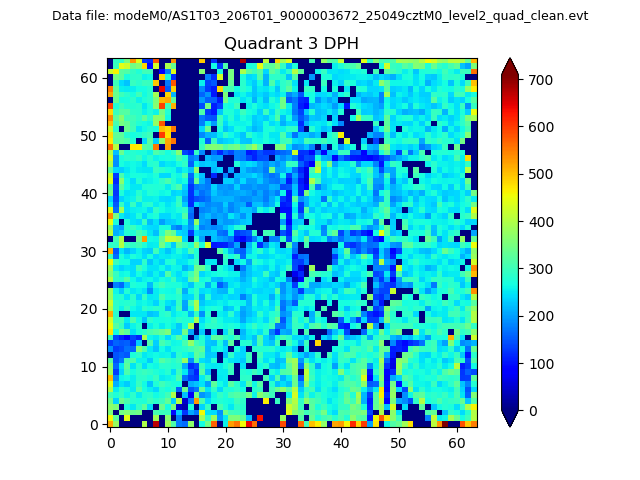 |
 |
Quadrant C |
| Plot type | Count rate plots | Images |
|---|---|---|
| Comparison with Poisson distribution Blue bars denote a histogram of data divided into 1 sec bins. Red curve is a Poisson curve with rate = median count rate of data. |
 |
 |
| Quadrant-wise count rates Data is divided into 100 sec bins |
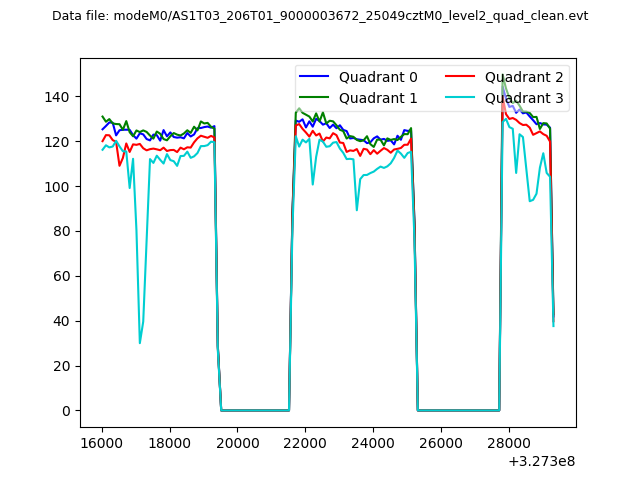 |
|
| Module-wise count rates for Quadrant A Data is divided into 100 sec bins |
 |
 |
| Module-wise count rates for Quadrant B Data is divided into 100 sec bins |
 |
 |
| Module-wise count rates for Quadrant C Data is divided into 100 sec bins |
 |
 |
| Module-wise count rates for Quadrant D Data is divided into 100 sec bins |
 |
 |
| Parameter | Plot |
|---|---|
| CZT HV Monitor |  |
| D_VDD | 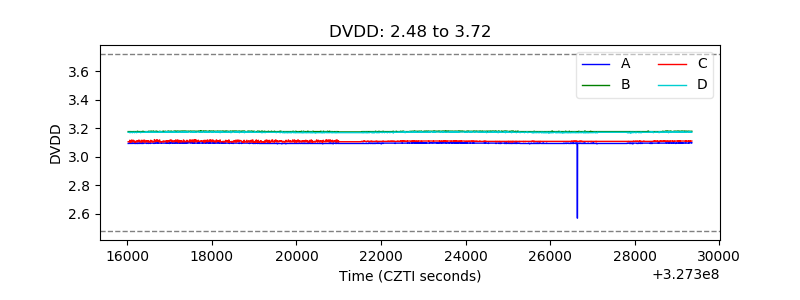 |
| Temperature 1 | 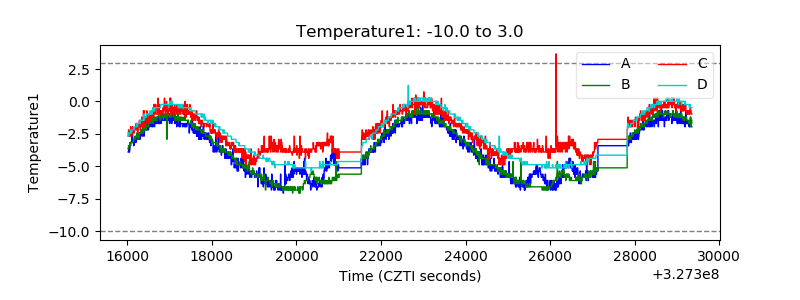 |
| Veto HV Monitor | 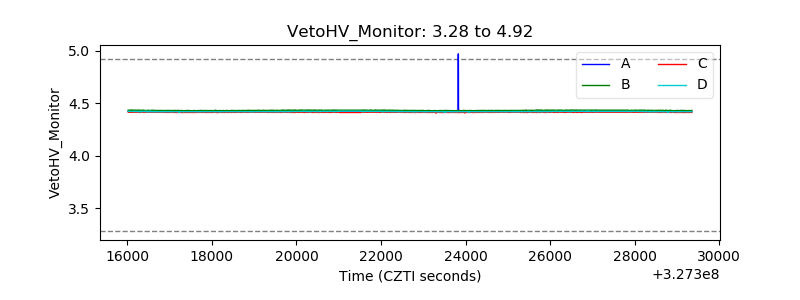 |
| Veto LLD | 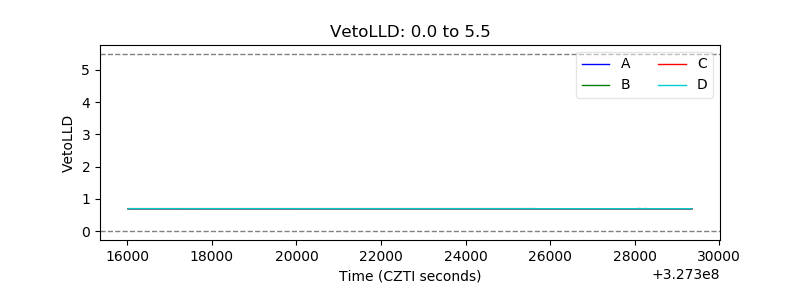 |
| Alpha Counter | 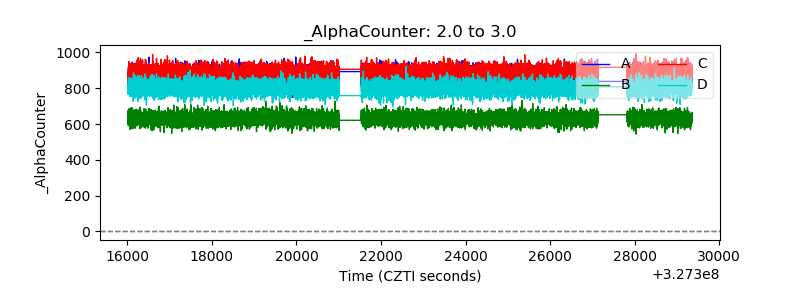 |
| _CPM_Rate | 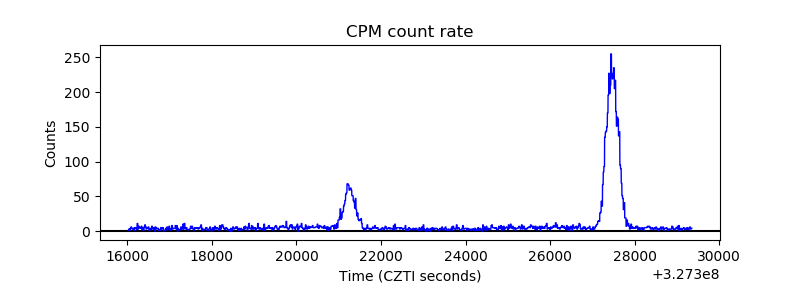 |
| CZT Counter | 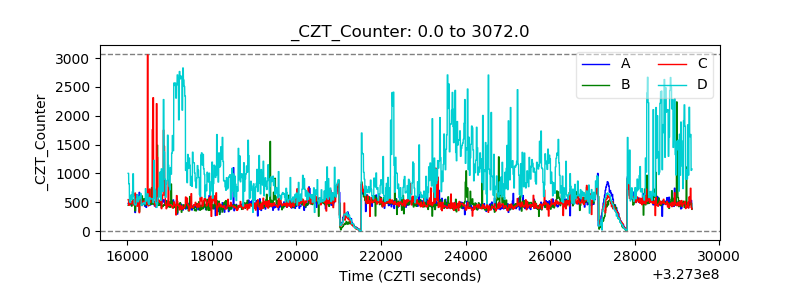 |
| +2.5 Volts monitor |  |
| +5 Volts monitor |  |
| _ROLL_ROT | 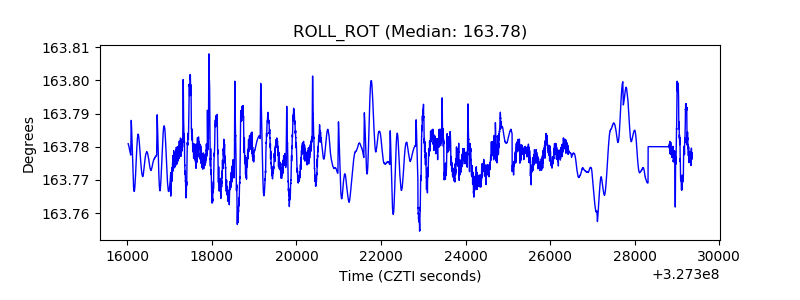 |
| _Roll_DEC |  |
| _Roll_RA | 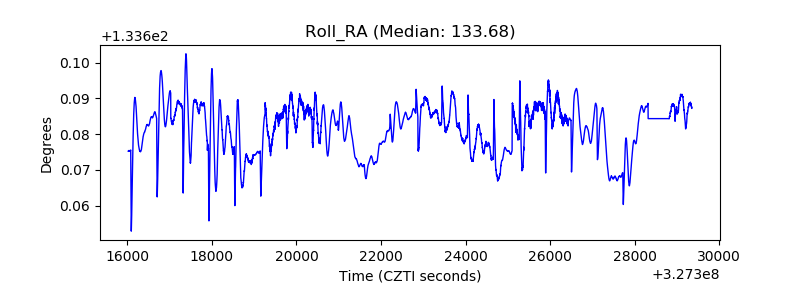 |
| Veto Counter |  |