| Param | Original file | Final file |
|---|---|---|
| Filename | modeM0/AS1T03_206T01_9000003672_25050cztM0_level2.evt | modeM0/AS1T03_206T01_9000003672_25050cztM0_level2_quad_clean.evt |
| Size (bytes) | 521,291,520 | 80,749,440 |
| Size | 497.1 MB | 77.0 MB |
| Events in quadrant A | 3,024,447 | 522,038 |
| Events in quadrant B | 3,122,138 | 528,149 |
| Events in quadrant C | 3,176,217 | 495,667 |
| Events in quadrant D | 6,041,987 | 464,430 |
| Mode M9 | |||
|---|---|---|---|
| Quadrant | BADHDUFLAG | Total packets | Discarded packets |
| A | 0 | 8 | 0 |
| B | 0 | 8 | 0 |
| C | 0 | 8 | 0 |
| D | 0 | 8 | 0 |
| Mode SS | |||
|---|---|---|---|
| Quadrant | BADHDUFLAG | Total packets | Discarded packets |
| A | 0 | 128 | 0 |
| B | 0 | 128 | 0 |
| C | 0 | 128 | 0 |
| D | 0 | 128 | 0 |
| Mode M0 | |||
|---|---|---|---|
| Quadrant | BADHDUFLAG | Total packets | Discarded packets |
| A | 0 | 12905 | 1 |
| B | 0 | 13243 | 1 |
| C | 0 | 13477 | 1 |
| D | 0 | 22326 | 1 |
| Quadrant | Total seconds | Saturated seconds | Saturation percentage |
|---|---|---|---|
| A | 6224 | 49 | 0.787275% |
| B | 6224 | 62 | 0.996144% |
| C | 6224 | 158 | 2.538560% |
| D | 6224 | 551 | 8.852828% |
Noise dominated data is calculated using 1-second bins in cleaned event files. If a bin has >2000 counts, and if more than 50% of those come from <1% of pixels, then it is considered to be noise-dominated and hence unusable.
| Quadrant | # 1 sec bins | Bins with >0 counts | Bins with >2000 counts | High rate bins dominated by noise | Noise dominated (total time) | Noise dominated (detector-on time) | Marked lightcurve |
|---|---|---|---|---|---|---|---|
| A | 7079 | 6225 | 0 | 0 | 0.00% | 0.00% | 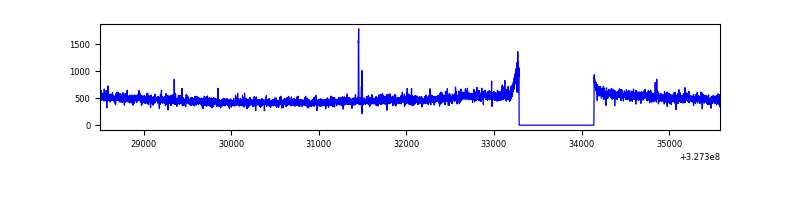 |
| B | 7079 | 6225 | 10 | 10 | 0.14% | 0.16% | 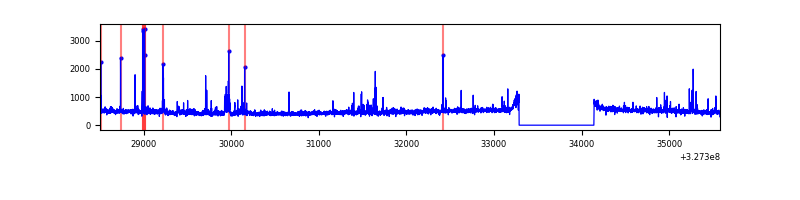 |
| C | 7079 | 6225 | 56 | 56 | 0.79% | 0.90% | 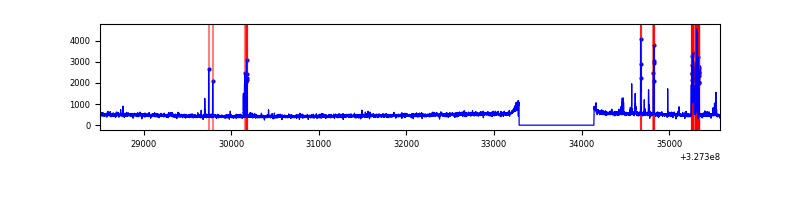 |
| D | 7079 | 6224 | 454 | 454 | 6.41% | 7.29% | 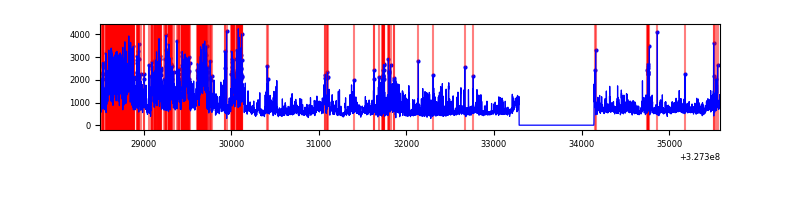 |
Top three noisy pixels from each quadrant. If the there are fewer than three noisy pixels in the level2.evt file, extra rows are filled as -1
| Pixel properties | Quadrant properties | ||||||
|---|---|---|---|---|---|---|---|
| Quadrant | DetID | PixID | Counts | Sigma | Mean | Median | Sigma |
| A | 10 | 17 | 110182 | 711.83 | 752 | 736 | 153.8 |
| A | 13 | 254 | 11063 | 67.17 | 752 | 736 | 153.8 |
| A | 15 | 174 | 8511 | 50.57 | 752 | 736 | 153.8 |
| B | 5 | 172 | 89599 | 614.33 | 748 | 729 | 144.7 |
| B | 0 | 190 | 38686 | 262.38 | 748 | 729 | 144.7 |
| B | 3 | 64 | 28153 | 189.57 | 748 | 729 | 144.7 |
| C | 0 | 239 | 179879 | 1058.01 | 717 | 721 | 169.3 |
| C | 14 | 238 | 114003 | 668.98 | 717 | 721 | 169.3 |
| C | 0 | 207 | 35669 | 206.38 | 717 | 721 | 169.3 |
| D | 12 | 233 | 1491136 | 8464.3 | 714 | 691 | 176.1 |
| D | 7 | 238 | 865079 | 4908.9 | 714 | 691 | 176.1 |
| D | 8 | 195 | 684287 | 3882.17 | 714 | 691 | 176.1 |
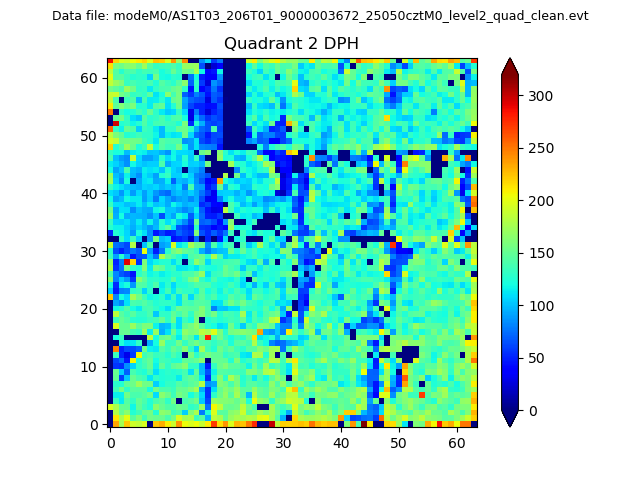
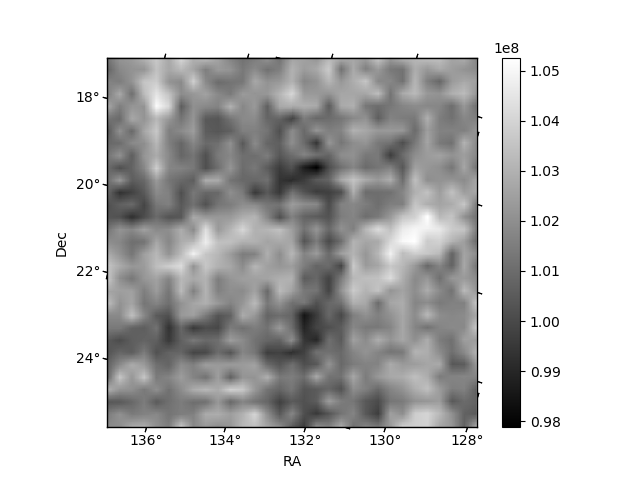
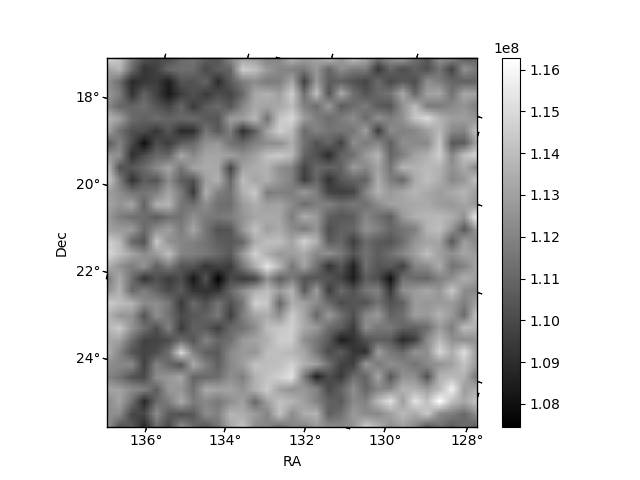
Histogram calculated using DETX and DETY for each event in the final _common_clean file
| Quadrant A | 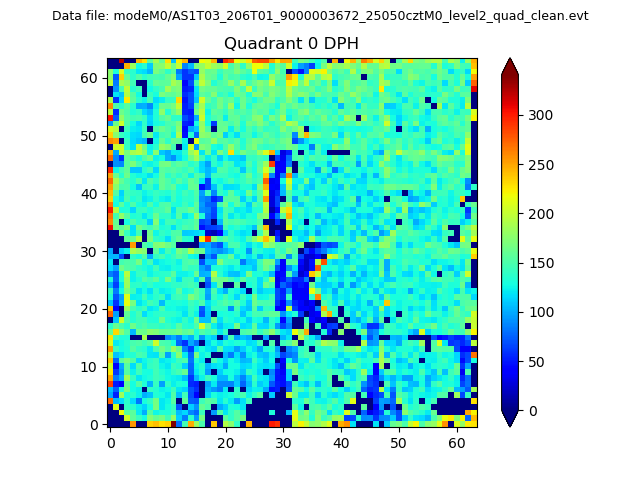 |
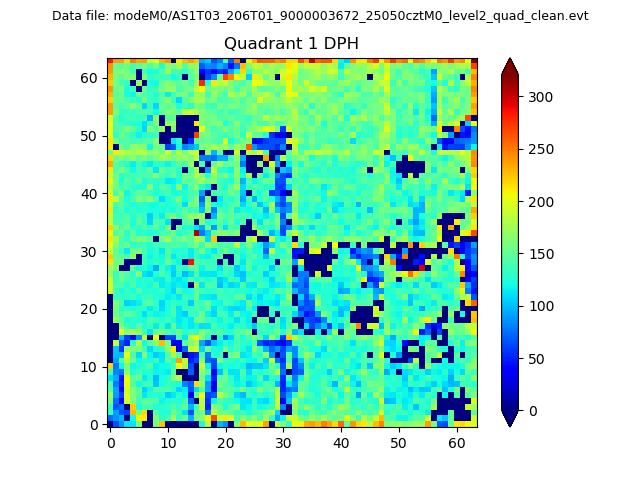 |
Quadrant B |
|---|---|---|---|
| Quadrant D | 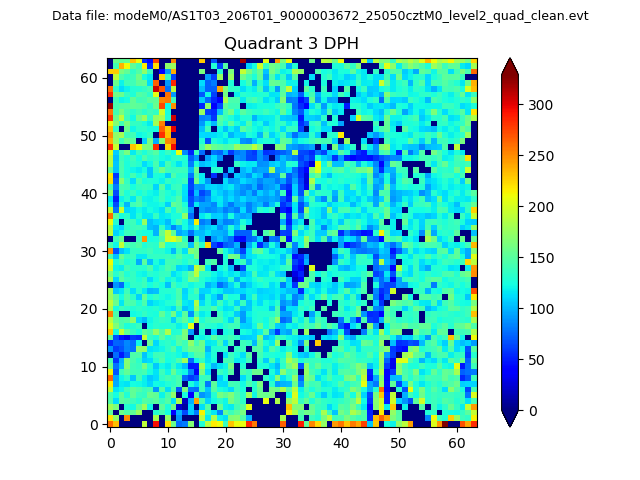 |
 |
Quadrant C |
| Plot type | Count rate plots | Images |
|---|---|---|
| Comparison with Poisson distribution Blue bars denote a histogram of data divided into 1 sec bins. Red curve is a Poisson curve with rate = median count rate of data. |
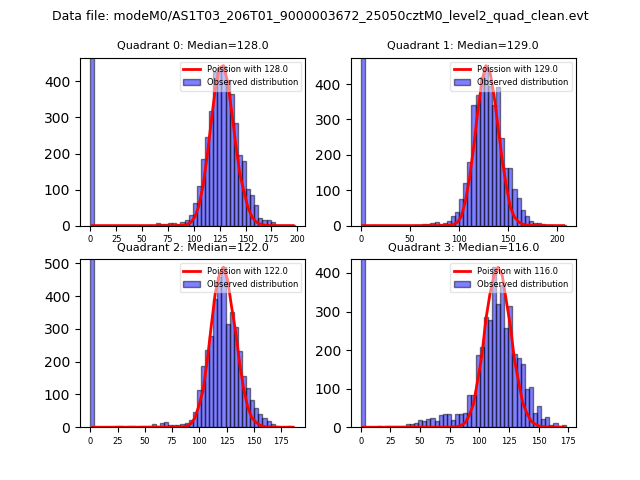 |
 |
| Quadrant-wise count rates Data is divided into 100 sec bins |
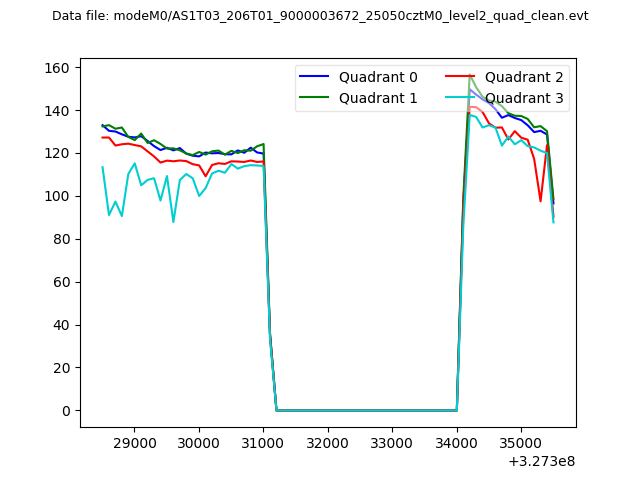 |
|
| Module-wise count rates for Quadrant A Data is divided into 100 sec bins |
 |
 |
| Module-wise count rates for Quadrant B Data is divided into 100 sec bins |
 |
 |
| Module-wise count rates for Quadrant C Data is divided into 100 sec bins |
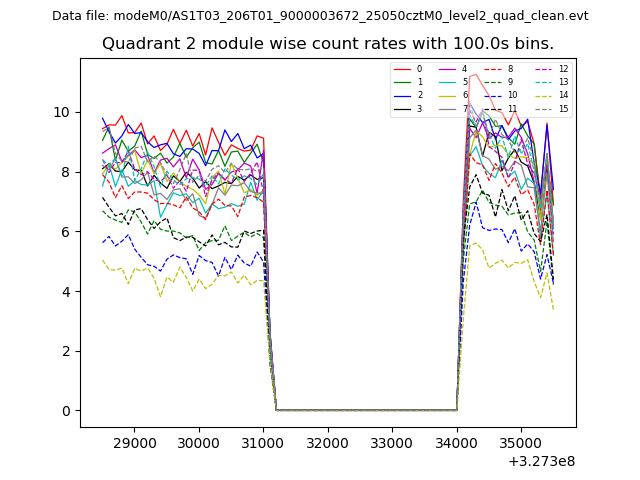 |
 |
| Module-wise count rates for Quadrant D Data is divided into 100 sec bins |
 |
 |
| Parameter | Plot |
|---|---|
| CZT HV Monitor | 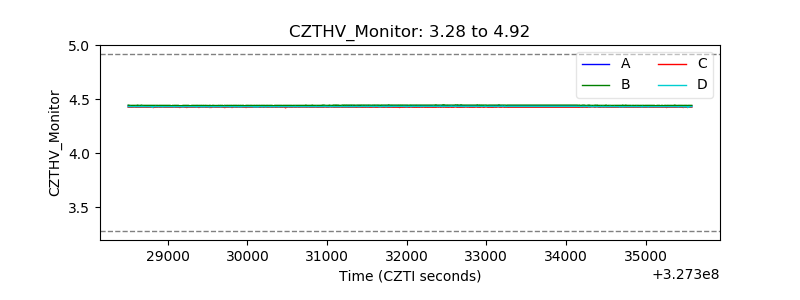 |
| D_VDD | 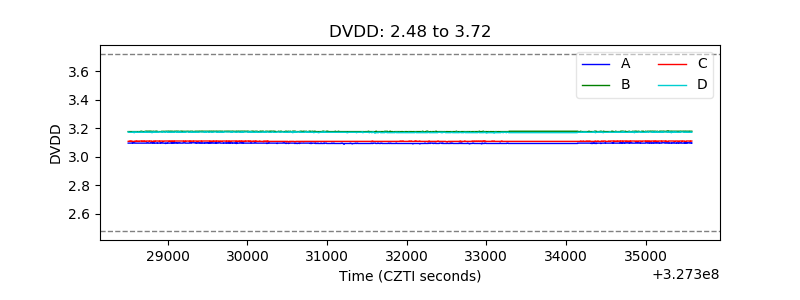 |
| Temperature 1 | 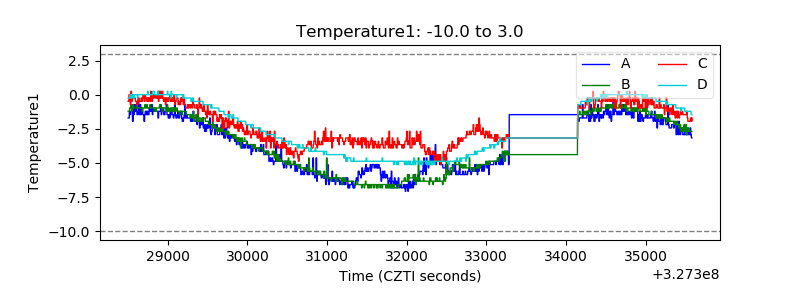 |
| Veto HV Monitor |  |
| Veto LLD | 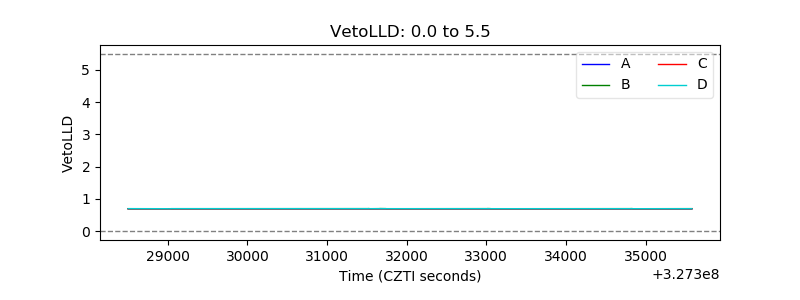 |
| Alpha Counter | 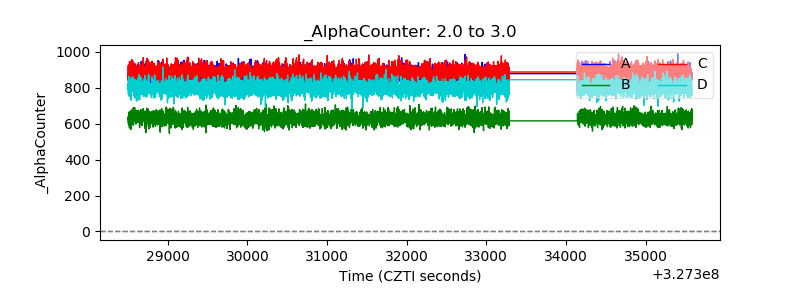 |
| _CPM_Rate | 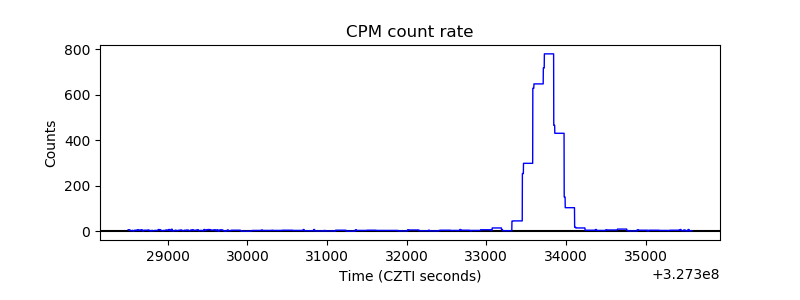 |
| CZT Counter | 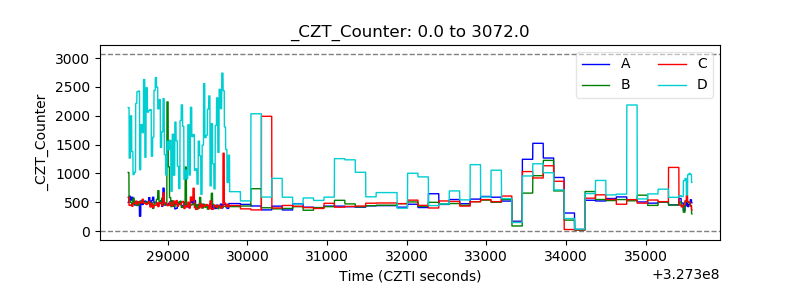 |
| +2.5 Volts monitor | 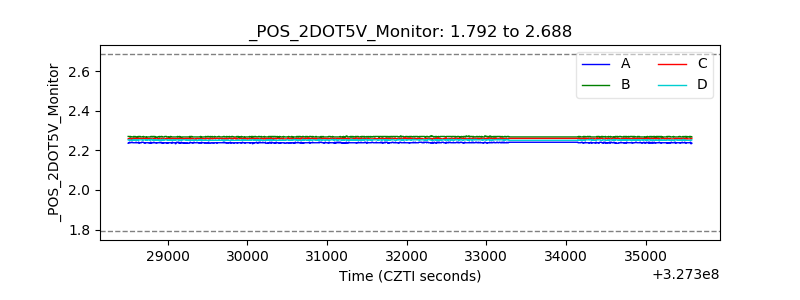 |
| +5 Volts monitor |  |
| _ROLL_ROT | 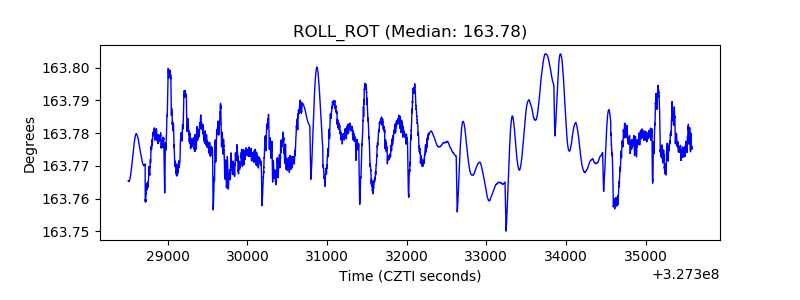 |
| _Roll_DEC | 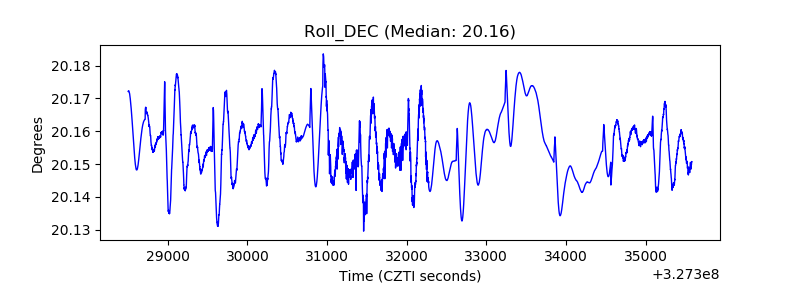 |
| _Roll_RA |  |
| Veto Counter | 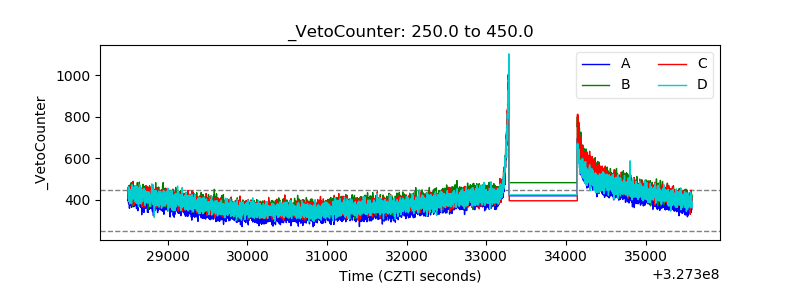 |