| Param | Original file | Final file |
|---|---|---|
| Filename | modeM0/AS1T03_206T01_9000003672_25051cztM0_level2.evt | modeM0/AS1T03_206T01_9000003672_25051cztM0_level2_quad_clean.evt |
| Size (bytes) | 474,272,640 | 80,043,840 |
| Size | 452.3 MB | 76.3 MB |
| Events in quadrant A | 2,929,511 | 516,310 |
| Events in quadrant B | 3,063,965 | 521,633 |
| Events in quadrant C | 3,066,600 | 489,898 |
| Events in quadrant D | 4,893,386 | 474,069 |
| Mode M9 | |||
|---|---|---|---|
| Quadrant | BADHDUFLAG | Total packets | Discarded packets |
| A | 0 | 10 | 0 |
| B | 0 | 10 | 0 |
| C | 0 | 10 | 0 |
| D | 0 | 10 | 0 |
| Mode SS | |||
|---|---|---|---|
| Quadrant | BADHDUFLAG | Total packets | Discarded packets |
| A | 0 | 122 | 0 |
| B | 0 | 122 | 0 |
| C | 0 | 122 | 0 |
| D | 0 | 122 | 0 |
| Mode M0 | |||
|---|---|---|---|
| Quadrant | BADHDUFLAG | Total packets | Discarded packets |
| A | 0 | 12587 | 1 |
| B | 0 | 13044 | 1 |
| C | 0 | 12998 | 1 |
| D | 0 | 18776 | 1 |
| Quadrant | Total seconds | Saturated seconds | Saturation percentage |
|---|---|---|---|
| A | 6042 | 33 | 0.546177% |
| B | 6043 | 47 | 0.777759% |
| C | 6043 | 122 | 2.018865% |
| D | 6043 | 166 | 2.746980% |
Noise dominated data is calculated using 1-second bins in cleaned event files. If a bin has >2000 counts, and if more than 50% of those come from <1% of pixels, then it is considered to be noise-dominated and hence unusable.
| Quadrant | # 1 sec bins | Bins with >0 counts | Bins with >2000 counts | High rate bins dominated by noise | Noise dominated (total time) | Noise dominated (detector-on time) | Marked lightcurve |
|---|---|---|---|---|---|---|---|
| A | 7072 | 6043 | 1 | 1 | 0.01% | 0.02% | 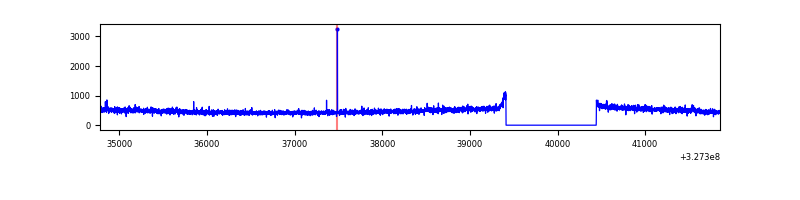 |
| B | 7073 | 6044 | 10 | 10 | 0.14% | 0.17% | 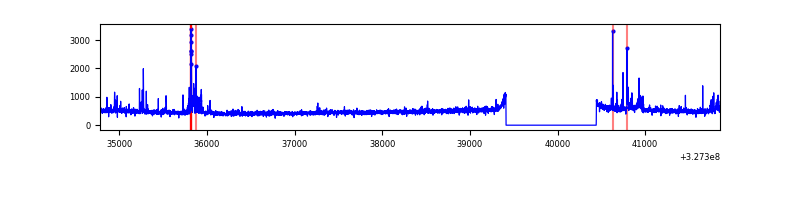 |
| C | 7073 | 6044 | 45 | 45 | 0.64% | 0.74% | 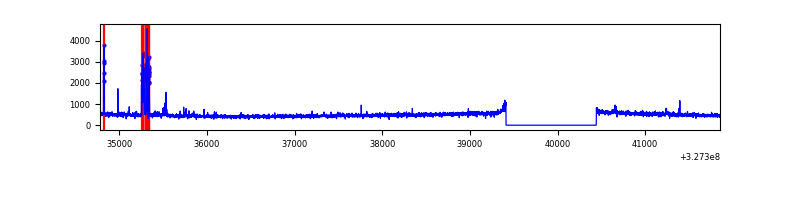 |
| D | 7073 | 6044 | 108 | 108 | 1.53% | 1.79% | 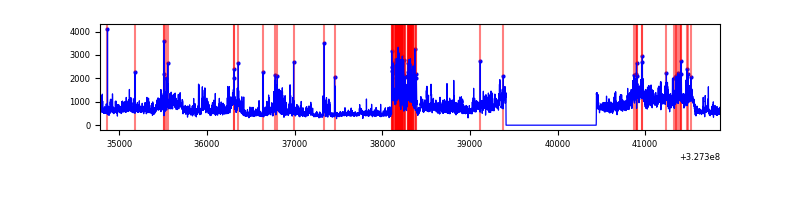 |
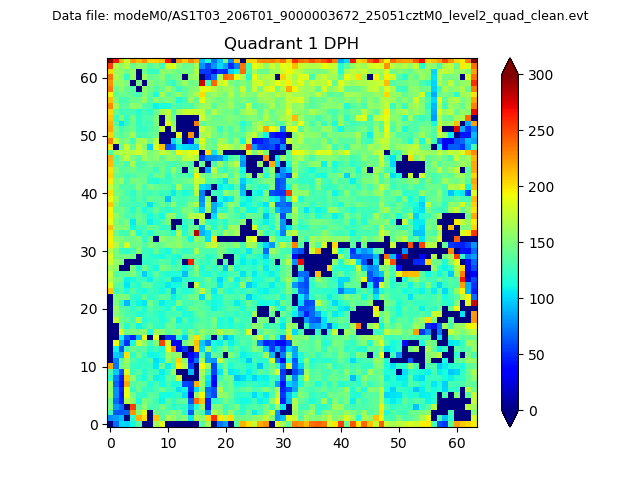
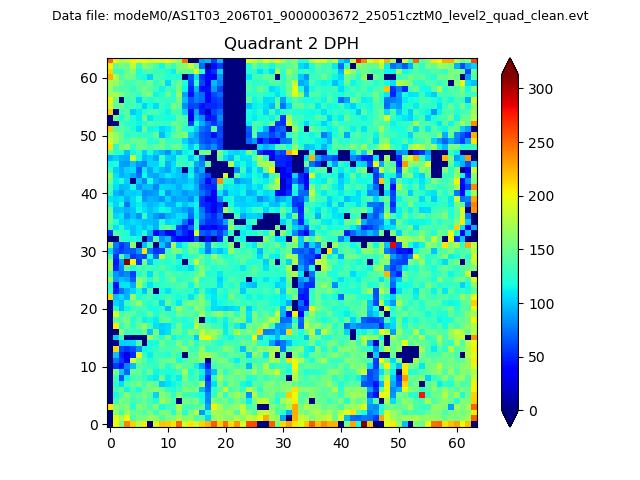
Top three noisy pixels from each quadrant. If the there are fewer than three noisy pixels in the level2.evt file, extra rows are filled as -1
| Pixel properties | Quadrant properties | ||||||
|---|---|---|---|---|---|---|---|
| Quadrant | DetID | PixID | Counts | Sigma | Mean | Median | Sigma |
| A | 10 | 17 | 96246 | 646.64 | 733 | 718 | 147.7 |
| A | 13 | 254 | 10528 | 66.4 | 733 | 718 | 147.7 |
| A | 3 | 137 | 6547 | 39.46 | 733 | 718 | 147.7 |
| B | 0 | 190 | 84121 | 600.26 | 731 | 713 | 139.0 |
| B | 5 | 172 | 78256 | 558.05 | 731 | 713 | 139.0 |
| B | 0 | 229 | 29443 | 206.76 | 731 | 713 | 139.0 |
| C | 0 | 239 | 146562 | 887.62 | 700 | 702 | 164.3 |
| C | 14 | 238 | 110206 | 666.38 | 700 | 702 | 164.3 |
| C | 7 | 247 | 38291 | 228.75 | 700 | 702 | 164.3 |
| D | 7 | 238 | 898010 | 5174.42 | 706 | 684 | 173.4 |
| D | 8 | 195 | 866719 | 4993.98 | 706 | 684 | 173.4 |
| D | 1 | 3 | 132944 | 762.68 | 706 | 684 | 173.4 |
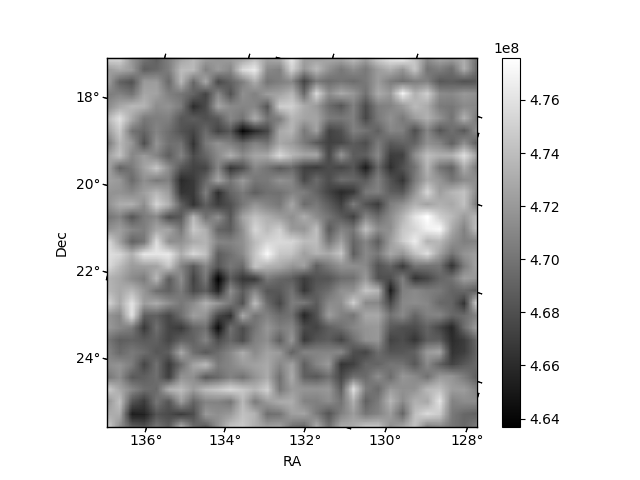
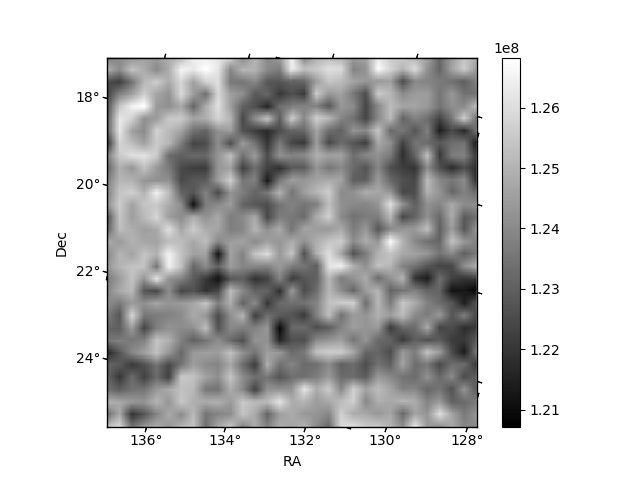
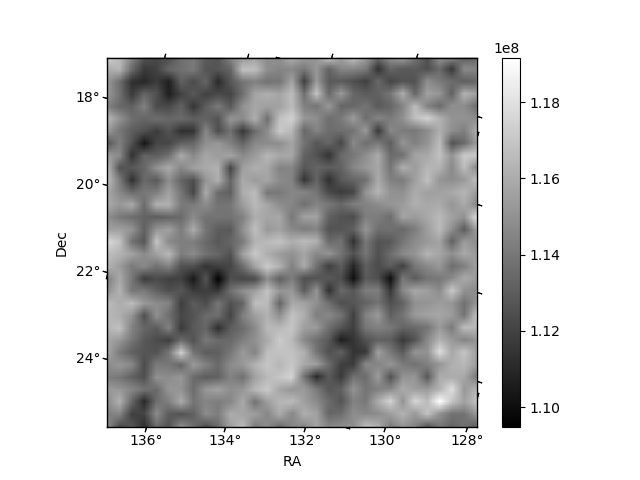
Histogram calculated using DETX and DETY for each event in the final _common_clean file
| Quadrant A | 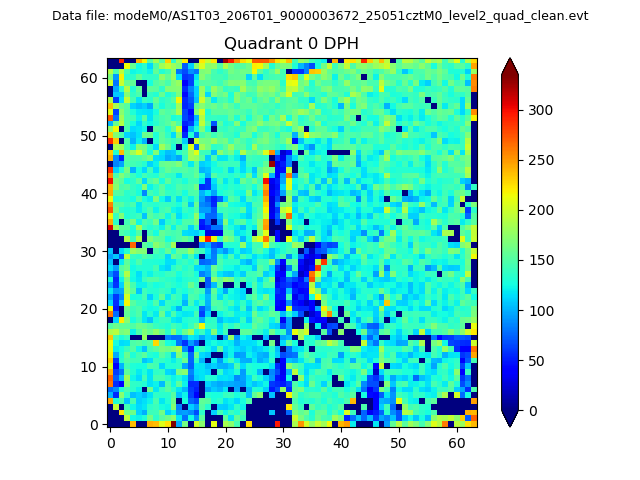 |
 |
Quadrant B |
|---|---|---|---|
| Quadrant D | 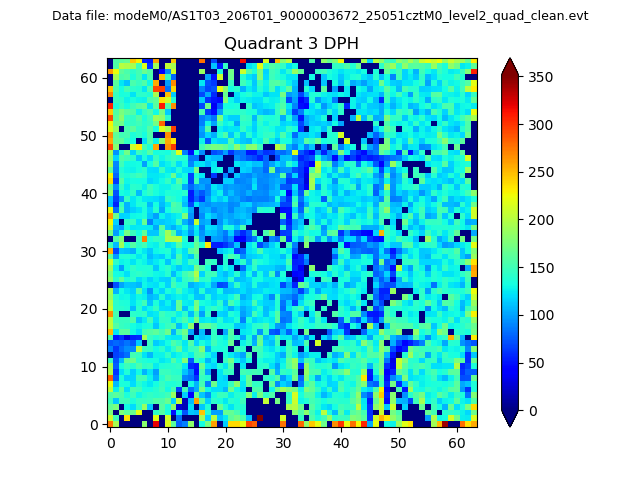 |
 |
Quadrant C |
| Plot type | Count rate plots | Images |
|---|---|---|
| Comparison with Poisson distribution Blue bars denote a histogram of data divided into 1 sec bins. Red curve is a Poisson curve with rate = median count rate of data. |
 |
 |
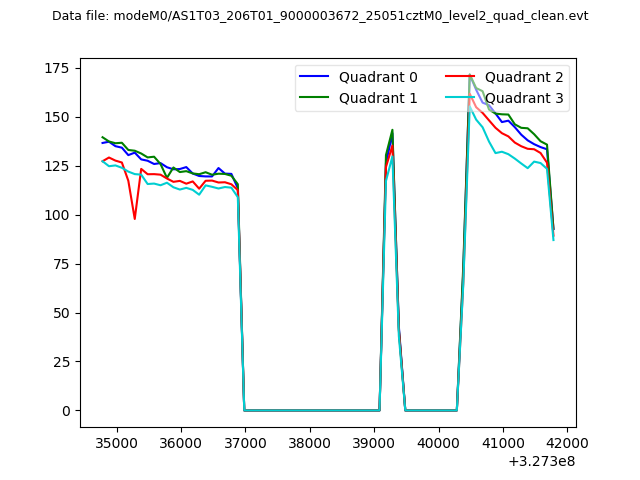
| Quadrant-wise count rates Data is divided into 100 sec bins |
 |
|
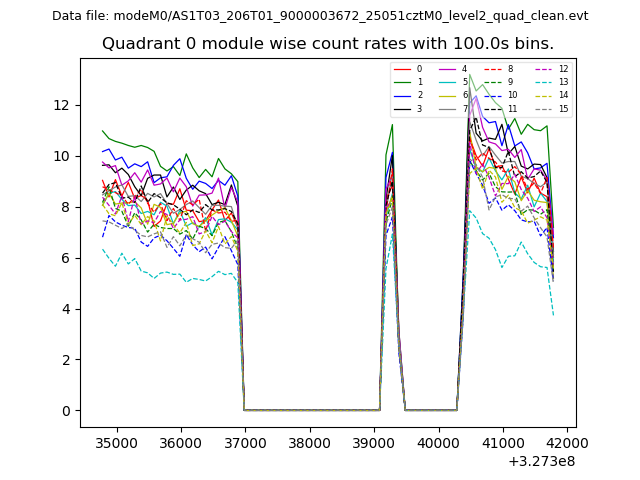
| Module-wise count rates for Quadrant A Data is divided into 100 sec bins |
 |
 |
| Module-wise count rates for Quadrant B Data is divided into 100 sec bins |
 |
 |
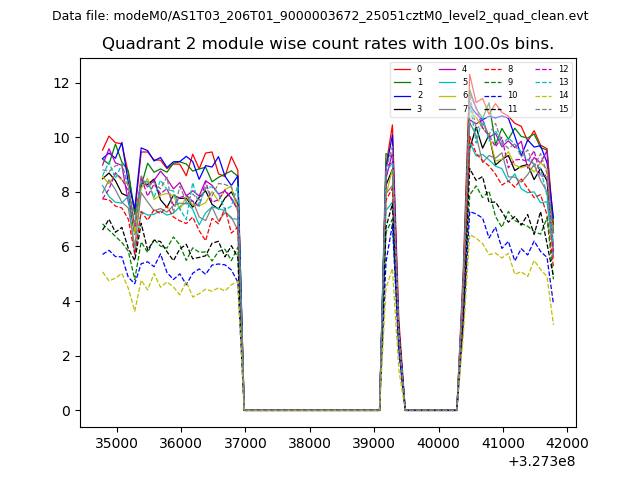
| Module-wise count rates for Quadrant C Data is divided into 100 sec bins |
 |
 |
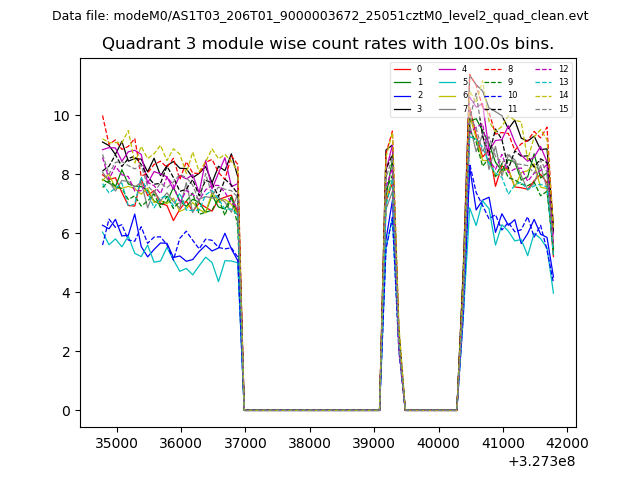
| Module-wise count rates for Quadrant D Data is divided into 100 sec bins |
 |
 |
| Parameter | Plot |
|---|---|
| CZT HV Monitor |  |
| D_VDD | 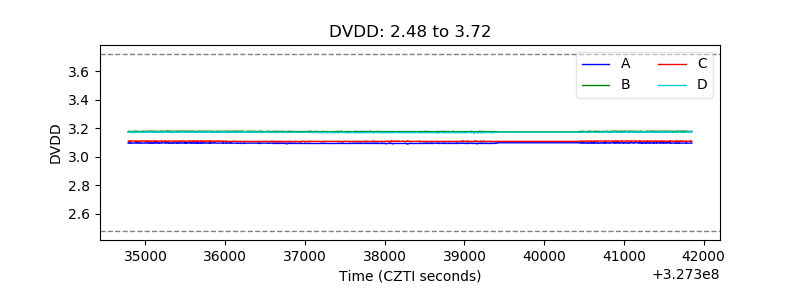 |
| Temperature 1 | 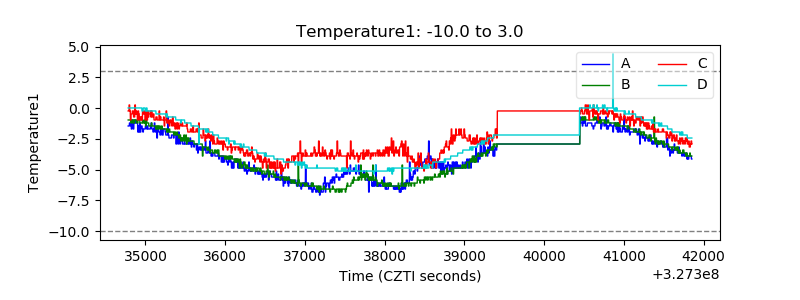 |
| Veto HV Monitor | 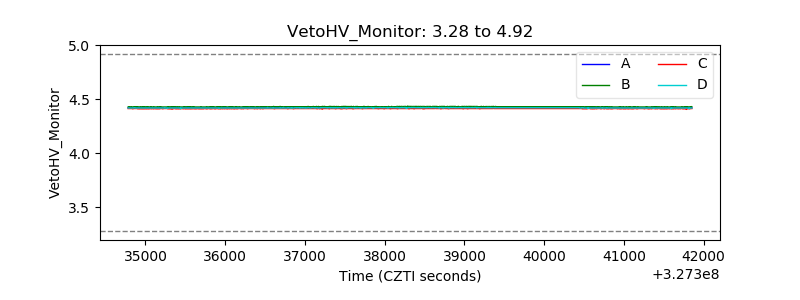 |
| Veto LLD | 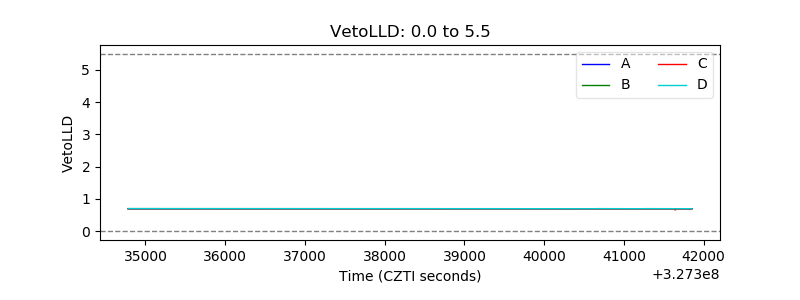 |
| Alpha Counter | 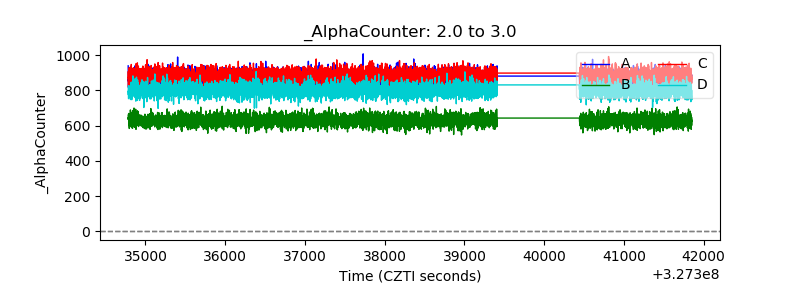 |
| _CPM_Rate | 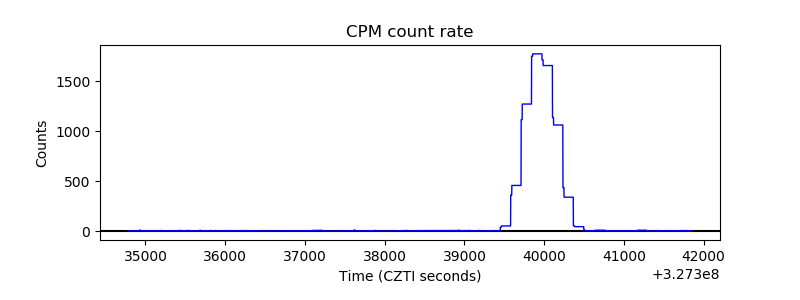 |
| CZT Counter | 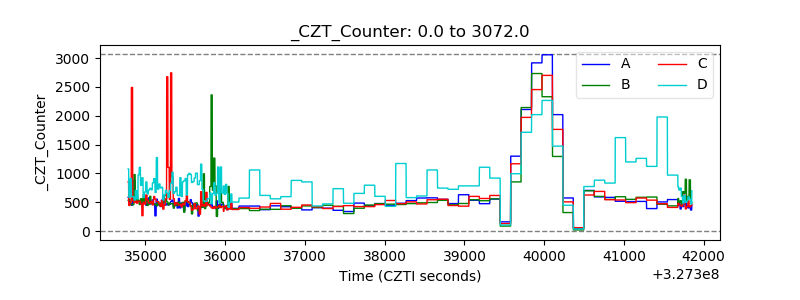 |
| +2.5 Volts monitor |  |
| +5 Volts monitor |  |
| _ROLL_ROT | 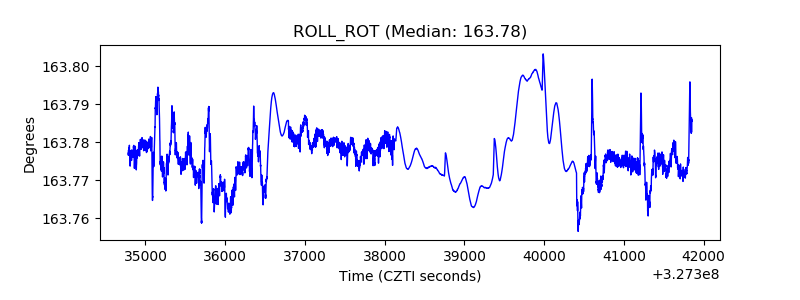 |
| _Roll_DEC | 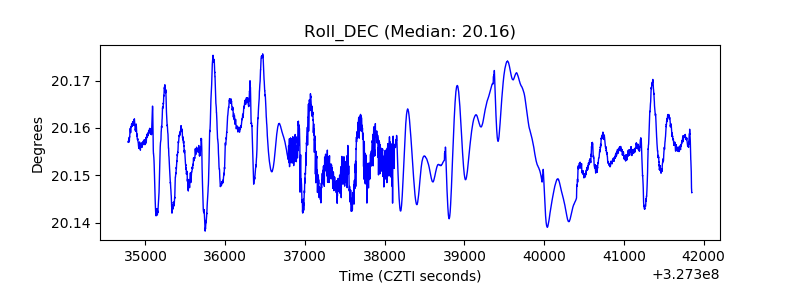 |
| _Roll_RA | 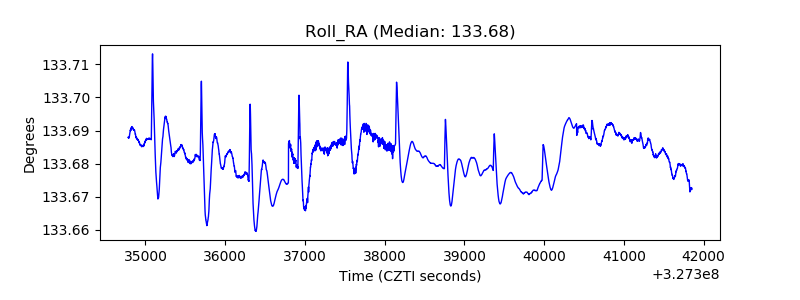 |
| Veto Counter | 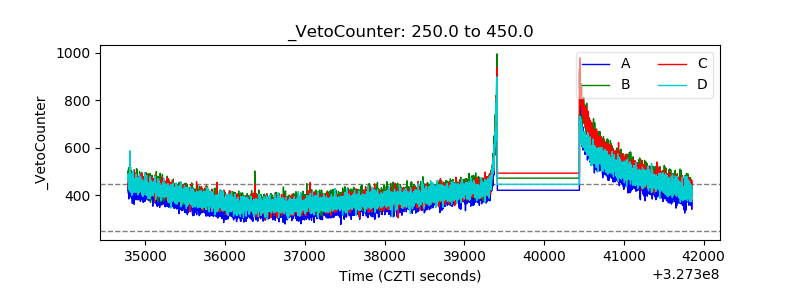 |