| Param | Original file | Final file |
|---|---|---|
| Filename | modeM0/AS1T03_206T01_9000003672_25053cztM0_level2.evt | modeM0/AS1T03_206T01_9000003672_25053cztM0_level2_quad_clean.evt |
| Size (bytes) | 523,474,560 | 91,402,560 |
| Size | 499.2 MB | 87.2 MB |
| Events in quadrant A | 3,207,303 | 604,145 |
| Events in quadrant B | 3,331,818 | 616,884 |
| Events in quadrant C | 3,458,765 | 577,510 |
| Events in quadrant D | 5,425,307 | 526,268 |
| Mode M9 | |||
|---|---|---|---|
| Quadrant | BADHDUFLAG | Total packets | Discarded packets |
| A | 0 | 12 | 0 |
| B | 0 | 13 | 0 |
| C | 0 | 13 | 0 |
| D | 0 | 13 | 0 |
| Mode SS | |||
|---|---|---|---|
| Quadrant | BADHDUFLAG | Total packets | Discarded packets |
| A | 0 | 128 | 0 |
| B | 0 | 128 | 0 |
| C | 0 | 128 | 0 |
| D | 0 | 128 | 0 |
| Mode M0 | |||
|---|---|---|---|
| Quadrant | BADHDUFLAG | Total packets | Discarded packets |
| A | 0 | 13627 | 2 |
| B | 0 | 13960 | 2 |
| C | 0 | 14472 | 2 |
| D | 0 | 20509 | 2 |
| Quadrant | Total seconds | Saturated seconds | Saturation percentage |
|---|---|---|---|
| A | 6351 | 56 | 0.881751% |
| B | 6351 | 50 | 0.787278% |
| C | 6351 | 80 | 1.259644% |
| D | 6351 | 326 | 5.133050% |
Noise dominated data is calculated using 1-second bins in cleaned event files. If a bin has >2000 counts, and if more than 50% of those come from <1% of pixels, then it is considered to be noise-dominated and hence unusable.
| Quadrant | # 1 sec bins | Bins with >0 counts | Bins with >2000 counts | High rate bins dominated by noise | Noise dominated (total time) | Noise dominated (detector-on time) | Marked lightcurve |
|---|---|---|---|---|---|---|---|
| A | 7506 | 6352 | 15 | 15 | 0.20% | 0.24% | 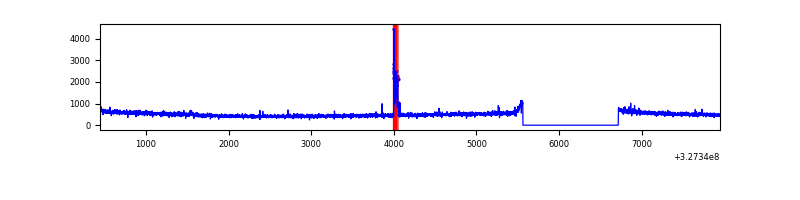 |
| B | 7506 | 6352 | 8 | 8 | 0.11% | 0.13% | 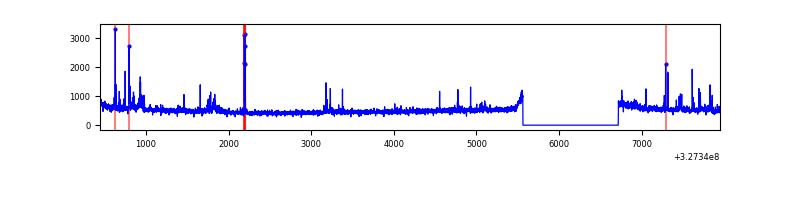 |
| C | 7506 | 6352 | 2 | 2 | 0.03% | 0.03% | 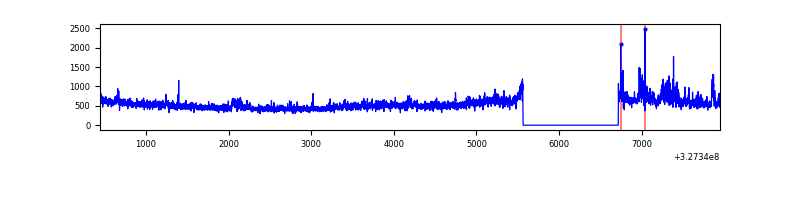 |
| D | 7506 | 6352 | 238 | 238 | 3.17% | 3.75% | 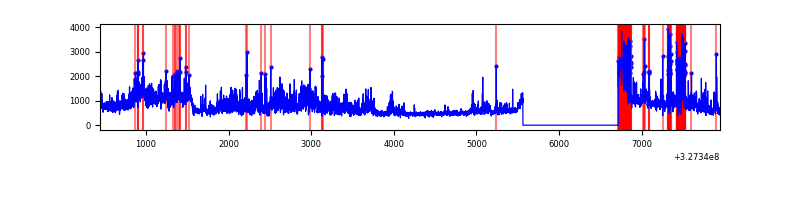 |
Top three noisy pixels from each quadrant. If the there are fewer than three noisy pixels in the level2.evt file, extra rows are filled as -1
| Pixel properties | Quadrant properties | ||||||
|---|---|---|---|---|---|---|---|
| Quadrant | DetID | PixID | Counts | Sigma | Mean | Median | Sigma |
| A | 15 | 174 | 77211 | 470.72 | 804 | 787 | 162.4 |
| A | 10 | 17 | 26186 | 156.44 | 804 | 787 | 162.4 |
| A | 13 | 254 | 11260 | 64.51 | 804 | 787 | 162.4 |
| B | 0 | 190 | 51526 | 337.58 | 802 | 781 | 150.3 |
| B | 0 | 229 | 41848 | 273.19 | 802 | 781 | 150.3 |
| B | 5 | 172 | 36830 | 239.81 | 802 | 781 | 150.3 |
| C | 0 | 239 | 258454 | 1435.72 | 768 | 772 | 179.5 |
| C | 14 | 238 | 120797 | 668.74 | 768 | 772 | 179.5 |
| C | 3 | 233 | 45280 | 247.98 | 768 | 772 | 179.5 |
| D | 8 | 195 | 1214097 | 6617.64 | 753 | 731 | 183.4 |
| D | 12 | 233 | 332528 | 1809.6 | 753 | 731 | 183.4 |
| D | 1 | 52 | 278897 | 1517.1 | 753 | 731 | 183.4 |
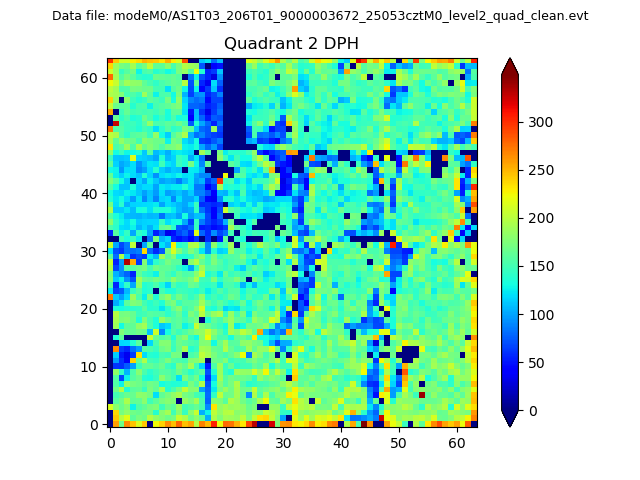
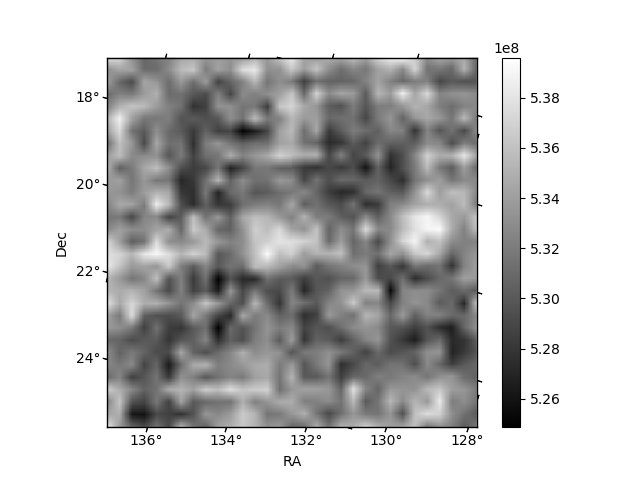
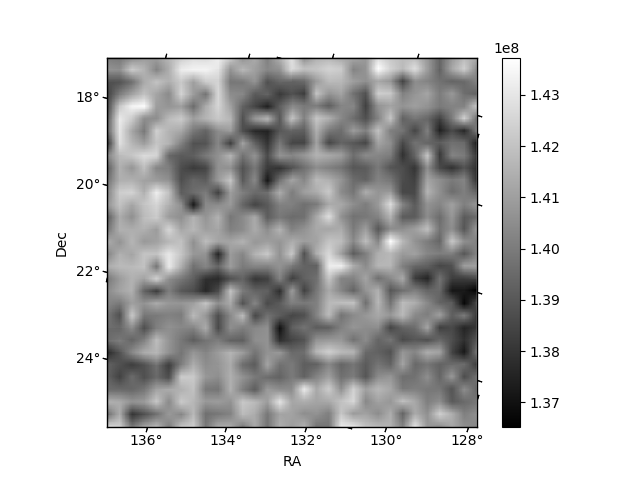
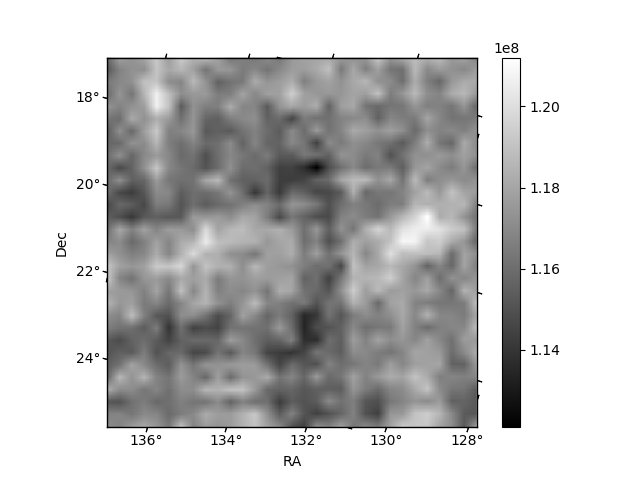
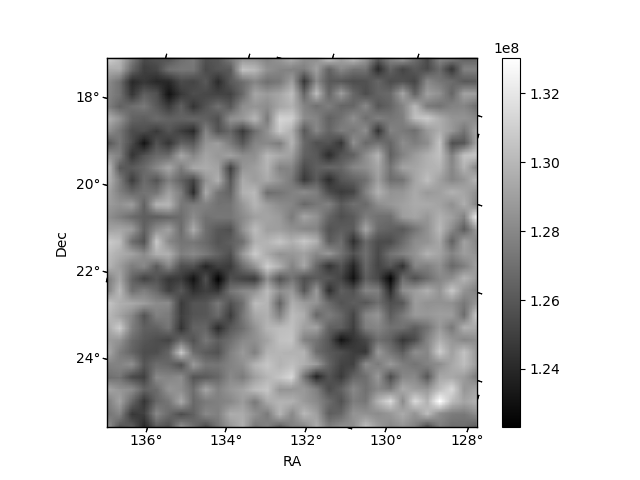
Histogram calculated using DETX and DETY for each event in the final _common_clean file
| Quadrant A | 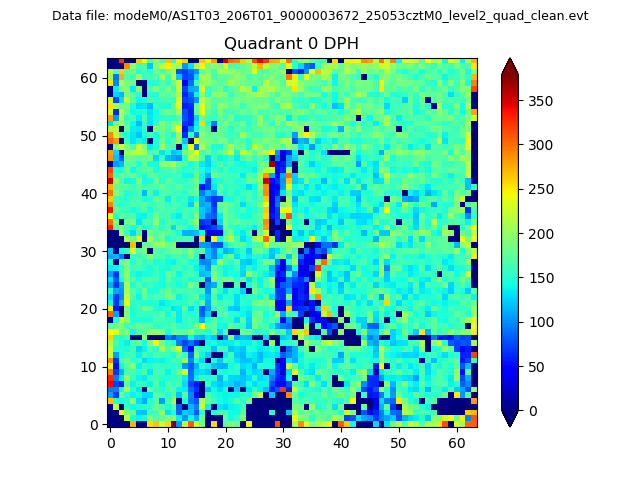 |
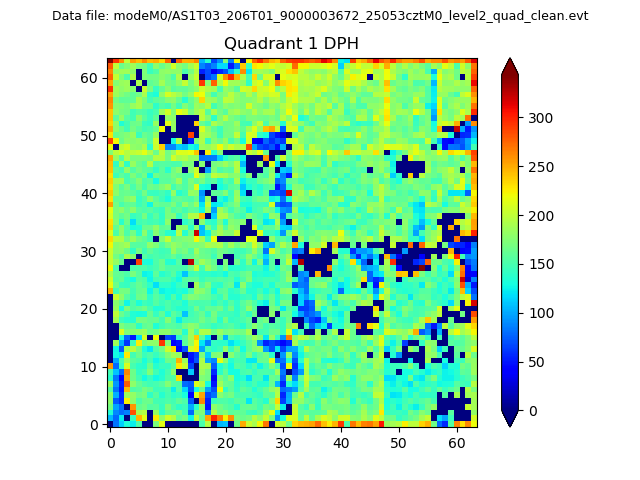 |
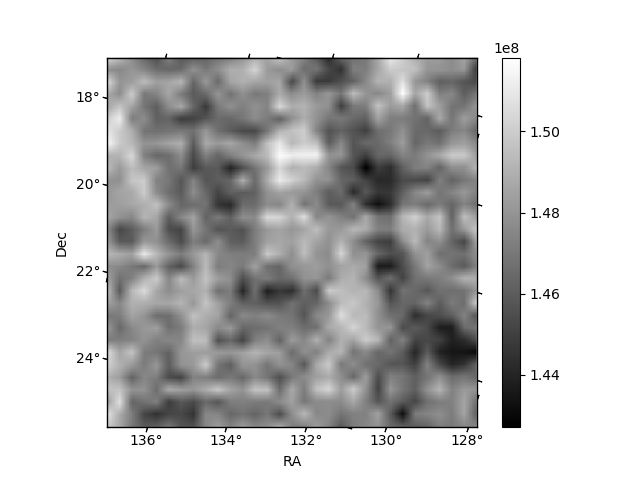
Quadrant B |
|---|---|---|---|
| Quadrant D | 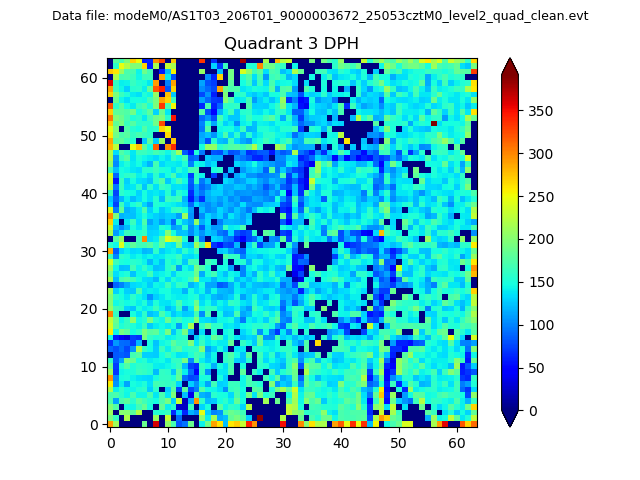 |
 |
Quadrant C |
| Plot type | Count rate plots | Images |
|---|---|---|
| Comparison with Poisson distribution Blue bars denote a histogram of data divided into 1 sec bins. Red curve is a Poisson curve with rate = median count rate of data. |
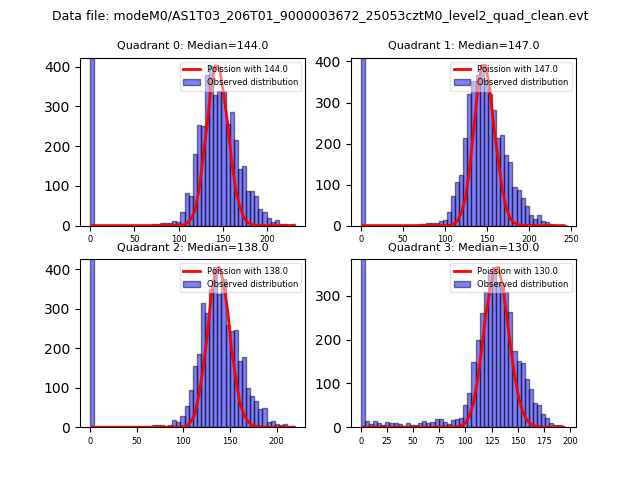 |
 |
| Quadrant-wise count rates Data is divided into 100 sec bins |
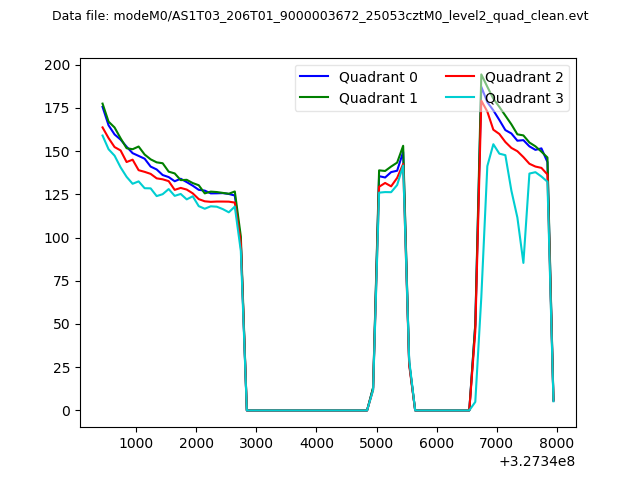 |
|
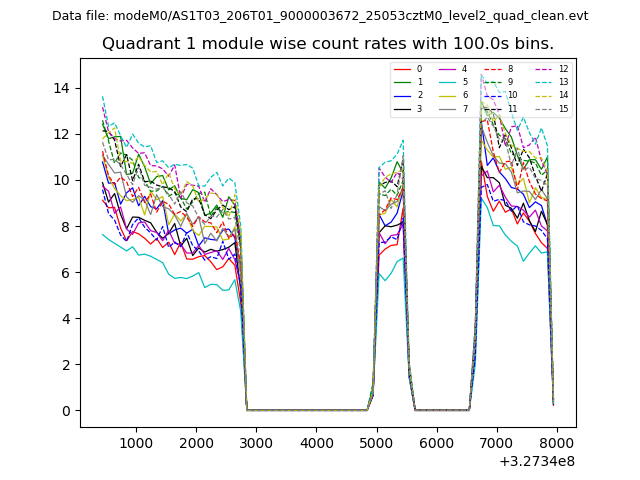
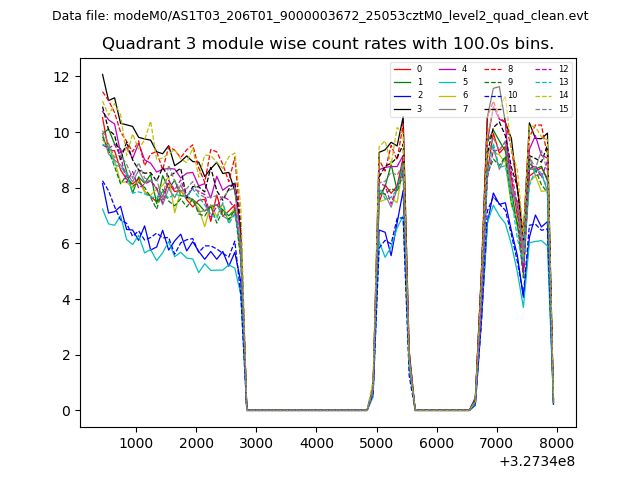
| Module-wise count rates for Quadrant A Data is divided into 100 sec bins |
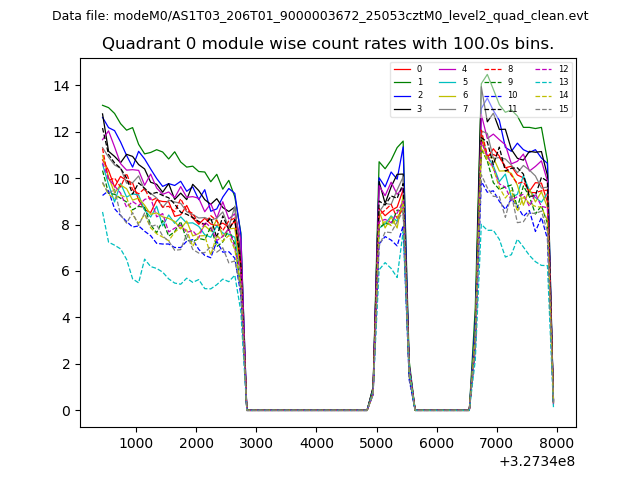 |
 |
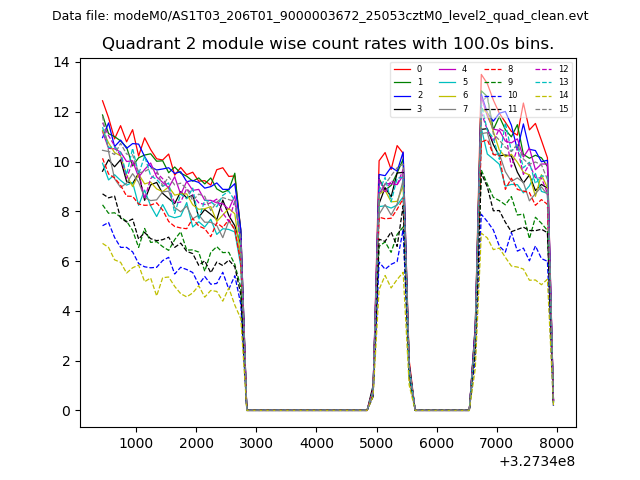
| Module-wise count rates for Quadrant B Data is divided into 100 sec bins |
 |
 |
| Module-wise count rates for Quadrant C Data is divided into 100 sec bins |
 |
 |
| Module-wise count rates for Quadrant D Data is divided into 100 sec bins |
 |
 |
| Parameter | Plot |
|---|---|
| CZT HV Monitor | 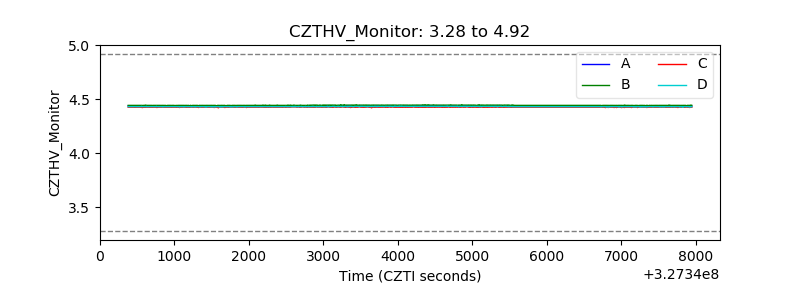 |
| D_VDD | 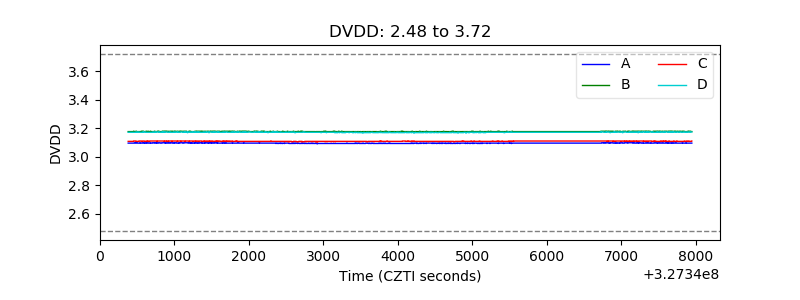 |
| Temperature 1 | 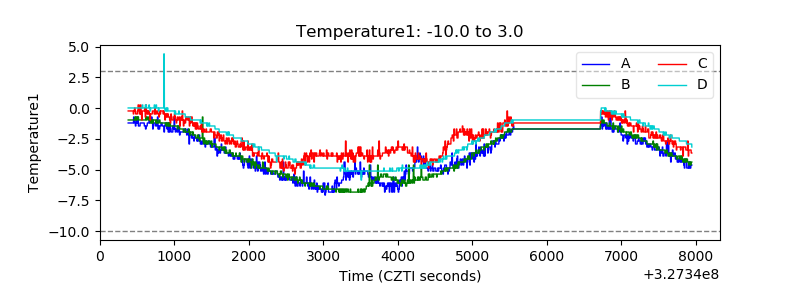 |
| Veto HV Monitor | 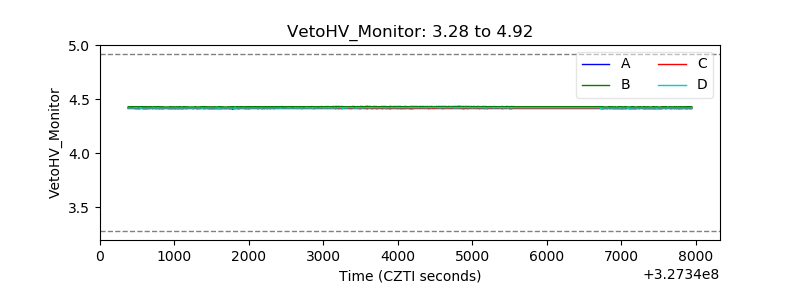 |
| Veto LLD | 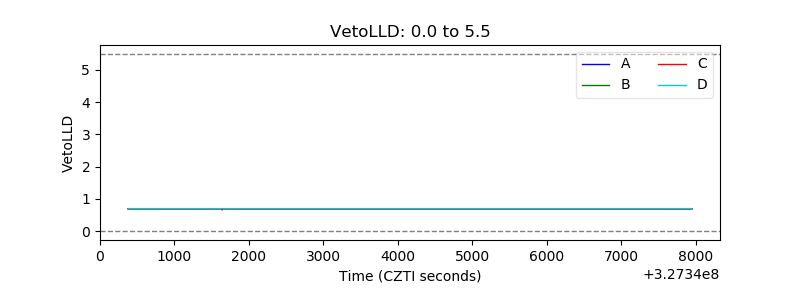 |
| Alpha Counter | 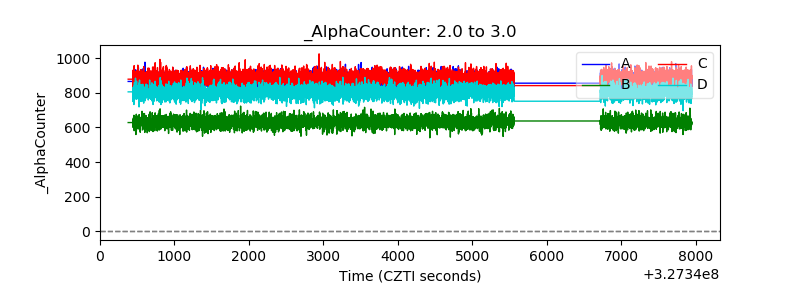 |
| _CPM_Rate | 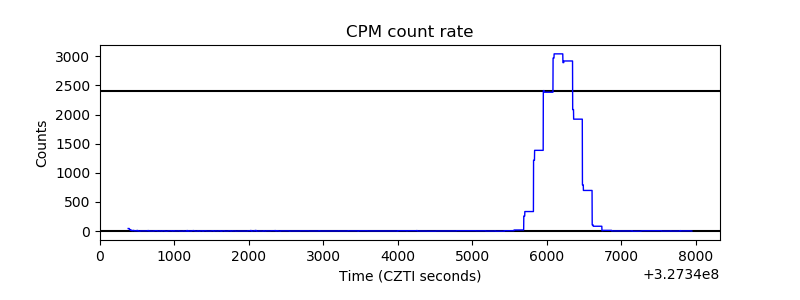 |
| CZT Counter | 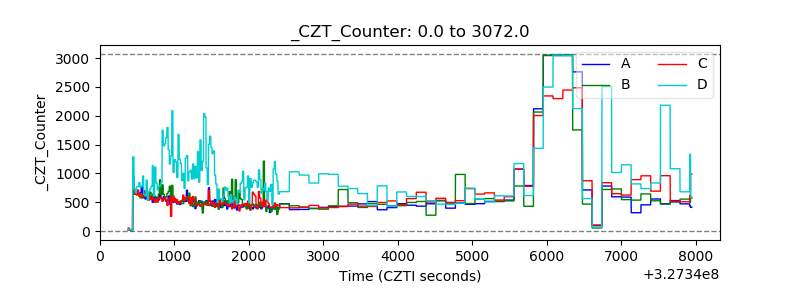 |
| +2.5 Volts monitor | 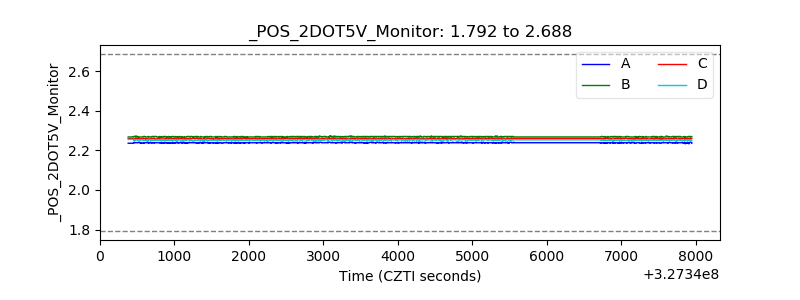 |
| +5 Volts monitor | 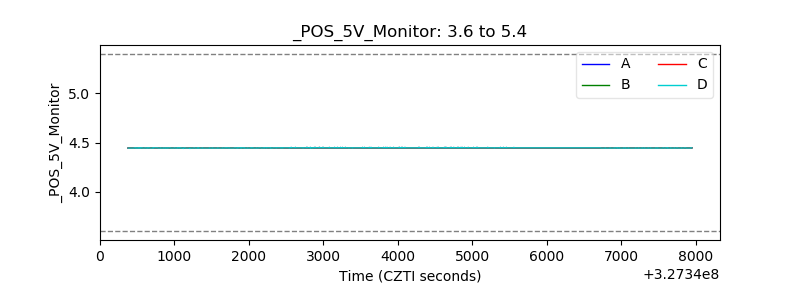 |
| _ROLL_ROT | 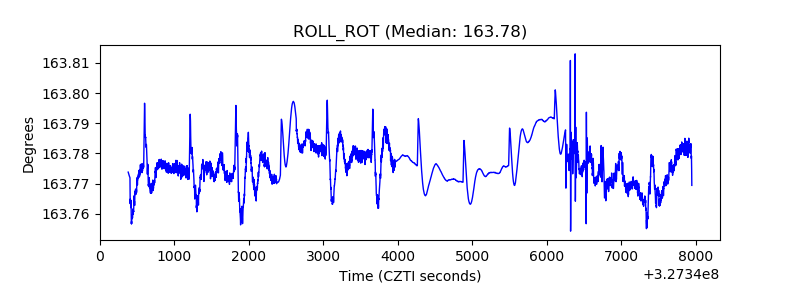 |
| _Roll_DEC | 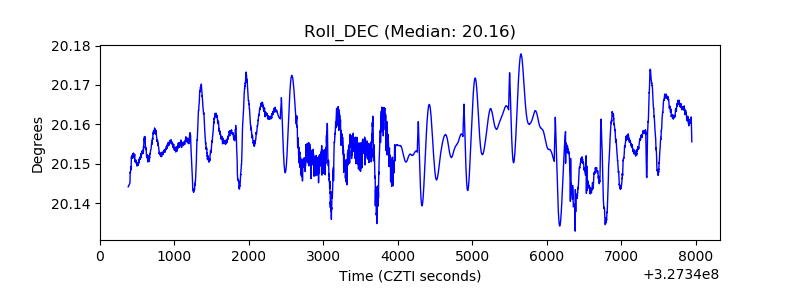 |
| _Roll_RA | 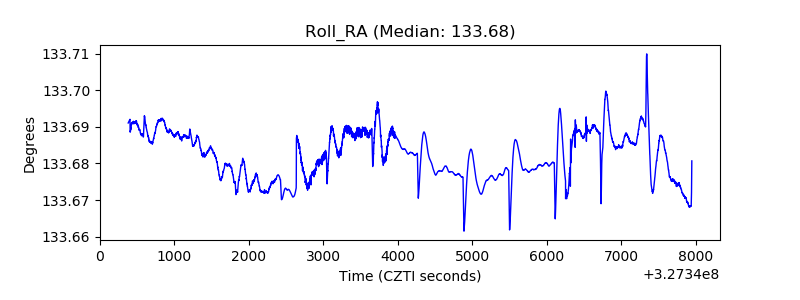 |
| Veto Counter | 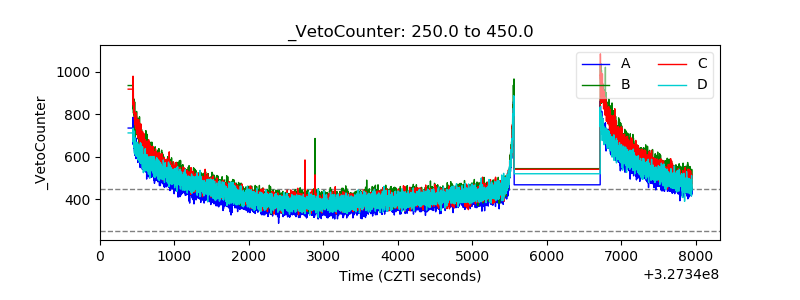 |