| Param | Original file | Final file |
|---|---|---|
| Filename | modeM0/AS1T03_206T01_9000003672_25056cztM0_level2.evt | modeM0/AS1T03_206T01_9000003672_25056cztM0_level2_quad_clean.evt |
| Size (bytes) | 490,219,200 | 84,185,280 |
| Size | 467.5 MB | 80.3 MB |
| Events in quadrant A | 3,232,041 | 548,261 |
| Events in quadrant B | 3,492,767 | 565,806 |
| Events in quadrant C | 3,292,286 | 520,239 |
| Events in quadrant D | 4,409,068 | 482,446 |
| Mode M9 | |||
|---|---|---|---|
| Quadrant | BADHDUFLAG | Total packets | Discarded packets |
| A | 0 | 22 | 0 |
| B | 0 | 23 | 0 |
| C | 0 | 23 | 0 |
| D | 0 | 23 | 0 |
| Mode SS | |||
|---|---|---|---|
| Quadrant | BADHDUFLAG | Total packets | Discarded packets |
| A | 0 | 126 | 0 |
| B | 0 | 126 | 0 |
| C | 0 | 126 | 0 |
| D | 0 | 126 | 0 |
| Mode M0 | |||
|---|---|---|---|
| Quadrant | BADHDUFLAG | Total packets | Discarded packets |
| A | 0 | 13172 | 2 |
| B | 0 | 13997 | 2 |
| C | 0 | 13360 | 2 |
| D | 0 | 17135 | 2 |
| Quadrant | Total seconds | Saturated seconds | Saturation percentage |
|---|---|---|---|
| A | 6194 | 42 | 0.678076% |
| B | 6194 | 99 | 1.598321% |
| C | 6194 | 91 | 1.469164% |
| D | 6194 | 298 | 4.811108% |
Noise dominated data is calculated using 1-second bins in cleaned event files. If a bin has >2000 counts, and if more than 50% of those come from <1% of pixels, then it is considered to be noise-dominated and hence unusable.
| Quadrant | # 1 sec bins | Bins with >0 counts | Bins with >2000 counts | High rate bins dominated by noise | Noise dominated (total time) | Noise dominated (detector-on time) | Marked lightcurve |
|---|---|---|---|---|---|---|---|
| A | 7584 | 6195 | 0 | 0 | 0.00% | 0.00% | 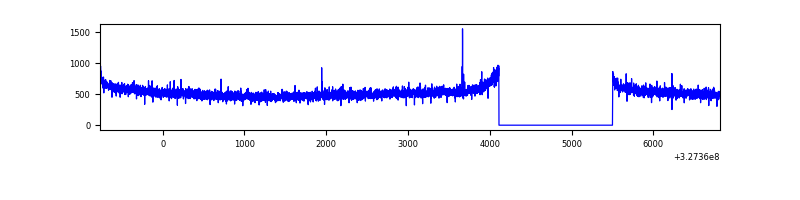 |
| B | 7584 | 6195 | 26 | 26 | 0.34% | 0.42% | 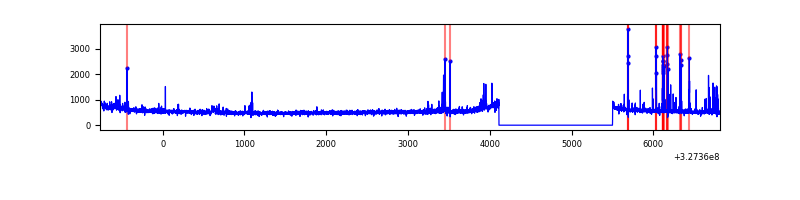 |
| C | 7584 | 6195 | 0 | 0 | 0.00% | 0.00% | 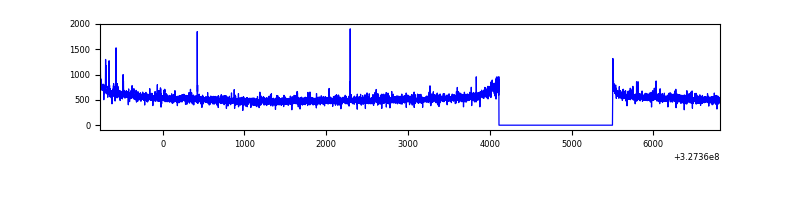 |
| D | 7584 | 6195 | 269 | 269 | 3.55% | 4.34% | 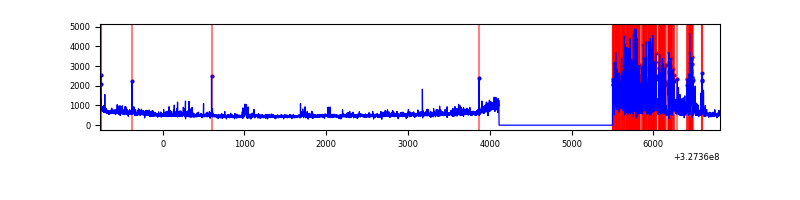 |
Top three noisy pixels from each quadrant. If the there are fewer than three noisy pixels in the level2.evt file, extra rows are filled as -1
| Pixel properties | Quadrant properties | ||||||
|---|---|---|---|---|---|---|---|
| Quadrant | DetID | PixID | Counts | Sigma | Mean | Median | Sigma |
| A | 13 | 254 | 10579 | 58.59 | 837 | 820 | 166.6 |
| A | 0 | 226 | 7422 | 39.64 | 837 | 820 | 166.6 |
| A | 3 | 137 | 6918 | 36.61 | 837 | 820 | 166.6 |
| B | 4 | 80 | 108028 | 680.6 | 844 | 826 | 157.5 |
| B | 5 | 172 | 21780 | 133.03 | 844 | 826 | 157.5 |
| B | 0 | 190 | 20314 | 123.72 | 844 | 826 | 157.5 |
| C | 14 | 238 | 129091 | 693.41 | 797 | 803 | 185.0 |
| C | 3 | 233 | 39940 | 211.54 | 797 | 803 | 185.0 |
| C | 7 | 247 | 11917 | 60.07 | 797 | 803 | 185.0 |
| D | 1 | 52 | 1018100 | 5328.02 | 782 | 759 | 190.9 |
| D | 8 | 195 | 286956 | 1498.87 | 782 | 759 | 190.9 |
| D | 1 | 3 | 43450 | 223.58 | 782 | 759 | 190.9 |
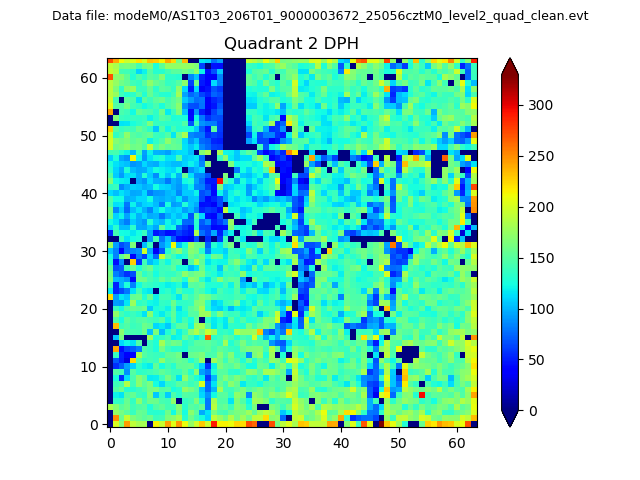
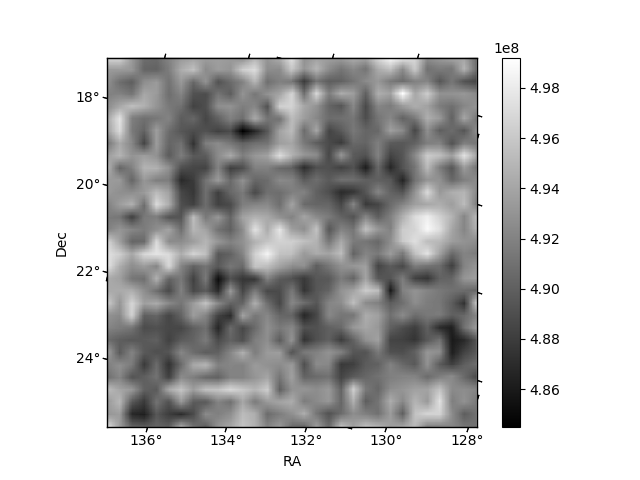
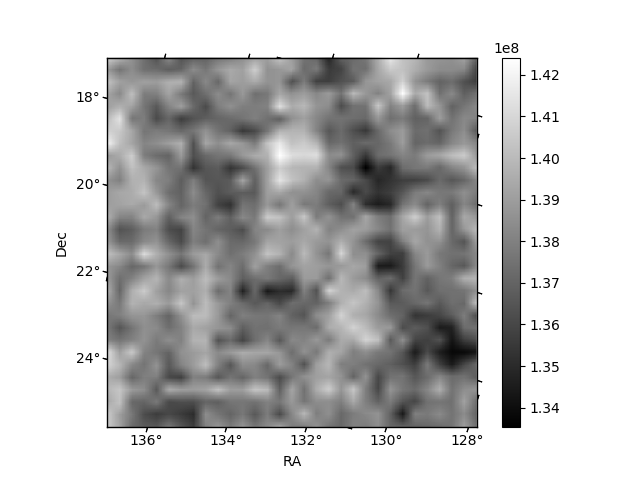
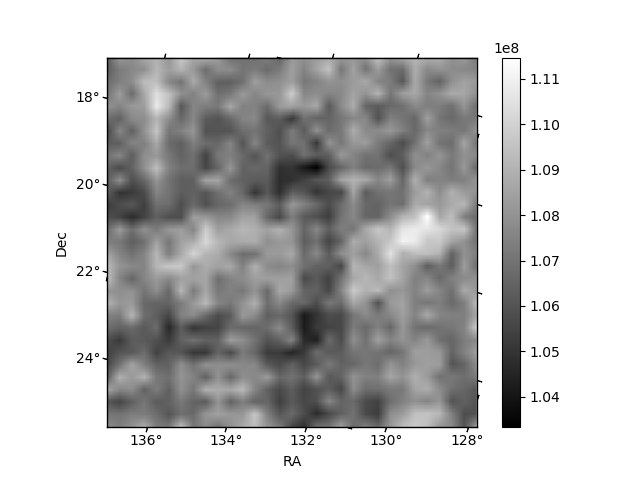
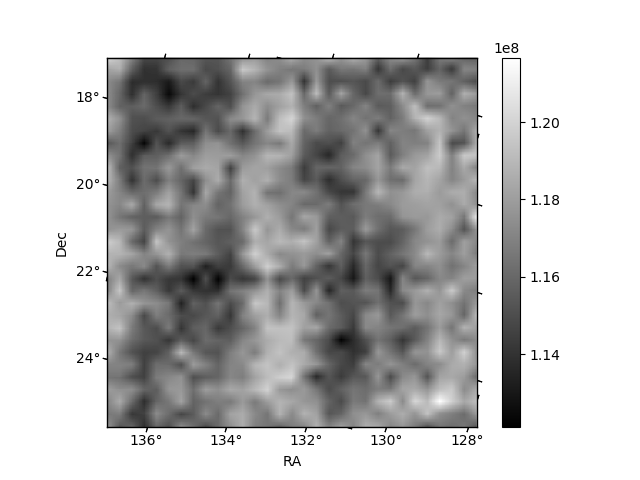
Histogram calculated using DETX and DETY for each event in the final _common_clean file
| Quadrant A | 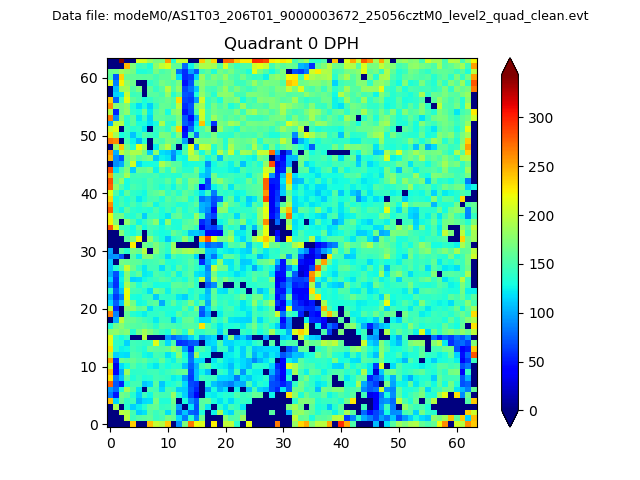 |
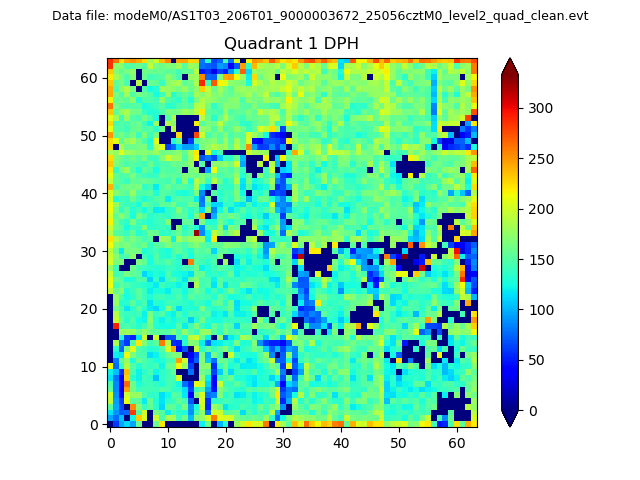 |
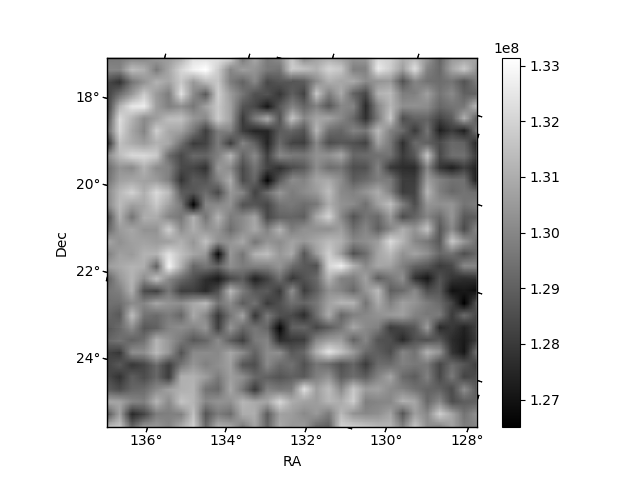
Quadrant B |
|---|---|---|---|
| Quadrant D | 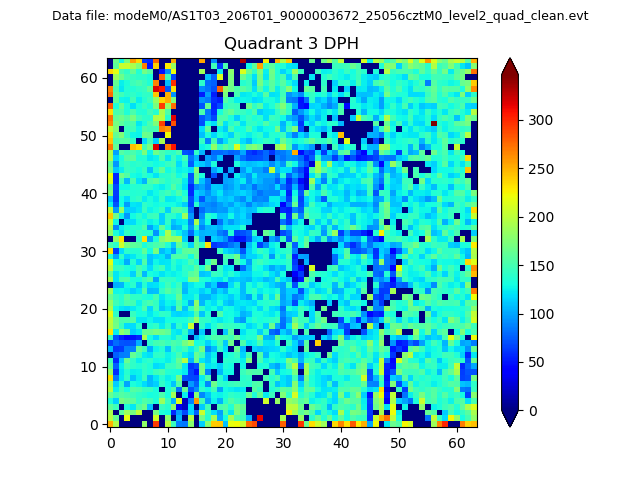 |
 |
Quadrant C |
| Plot type | Count rate plots | Images |
|---|---|---|
| Comparison with Poisson distribution Blue bars denote a histogram of data divided into 1 sec bins. Red curve is a Poisson curve with rate = median count rate of data. |
 |
 |
| Quadrant-wise count rates Data is divided into 100 sec bins |
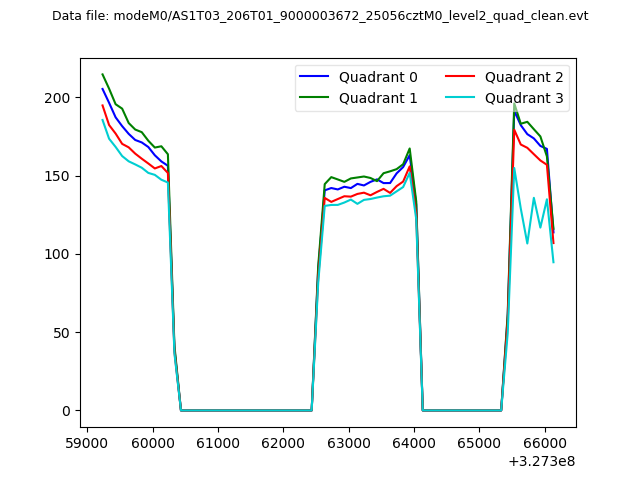 |
|
| Module-wise count rates for Quadrant A Data is divided into 100 sec bins |
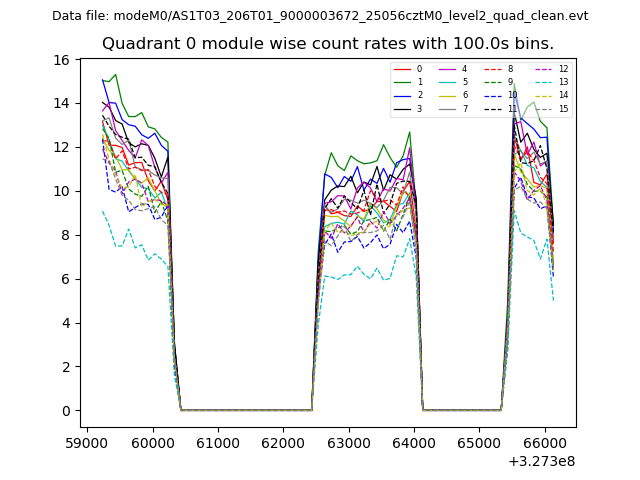 |
 |
| Module-wise count rates for Quadrant B Data is divided into 100 sec bins |
 |
 |
| Module-wise count rates for Quadrant C Data is divided into 100 sec bins |
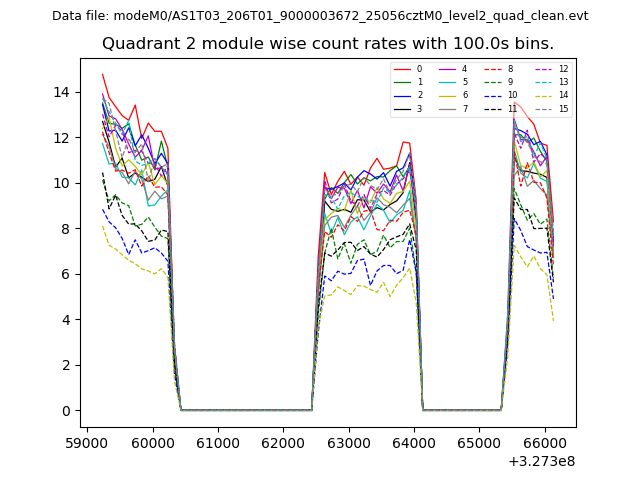 |
 |
| Module-wise count rates for Quadrant D Data is divided into 100 sec bins |
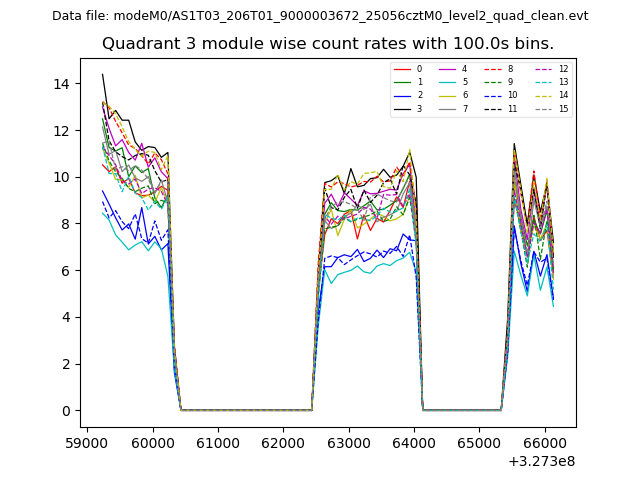 |
 |
| Parameter | Plot |
|---|---|
| CZT HV Monitor |  |
| D_VDD | 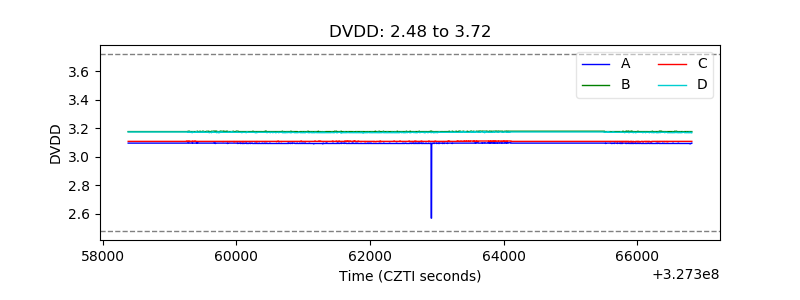 |
| Temperature 1 | 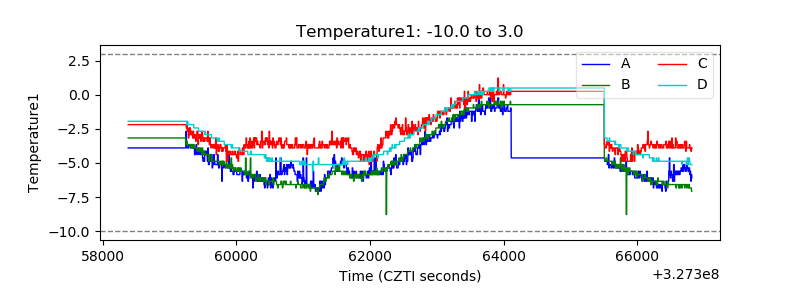 |
| Veto HV Monitor | 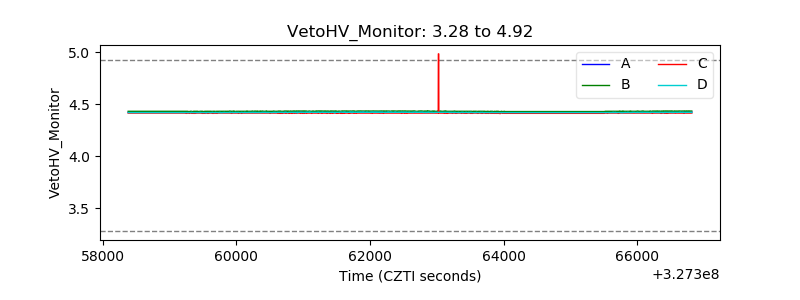 |
| Veto LLD | 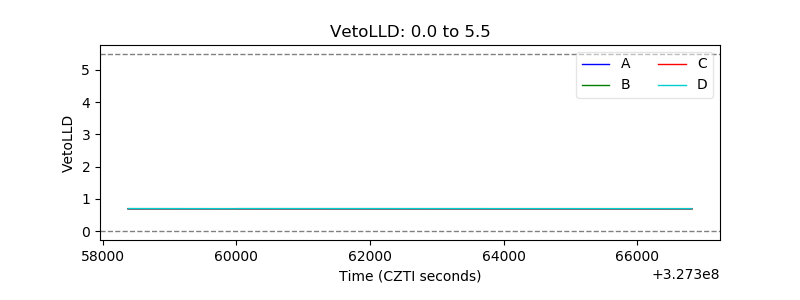 |
| Alpha Counter | 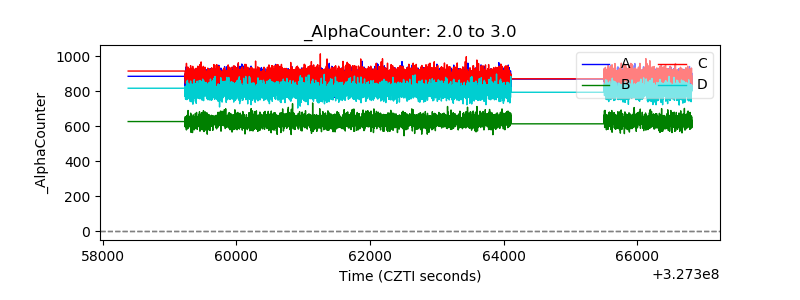 |
| _CPM_Rate | 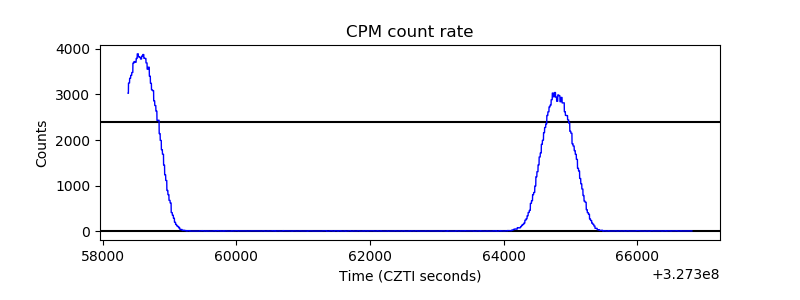 |
| CZT Counter | 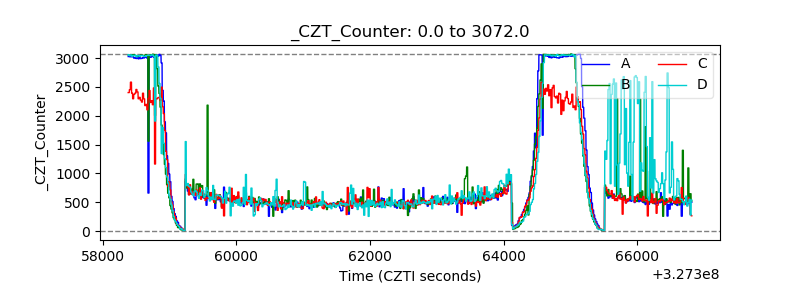 |
| +2.5 Volts monitor |  |
| +5 Volts monitor |  |
| _ROLL_ROT | 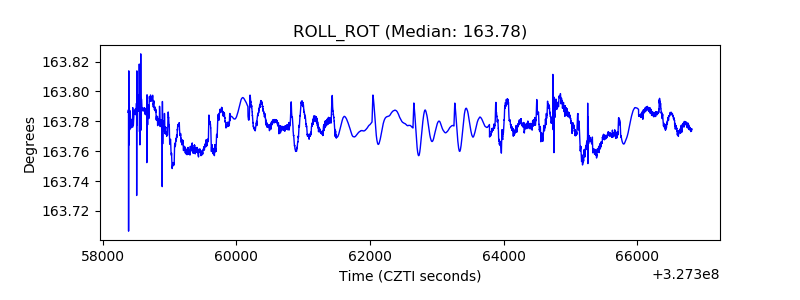 |
| _Roll_DEC | 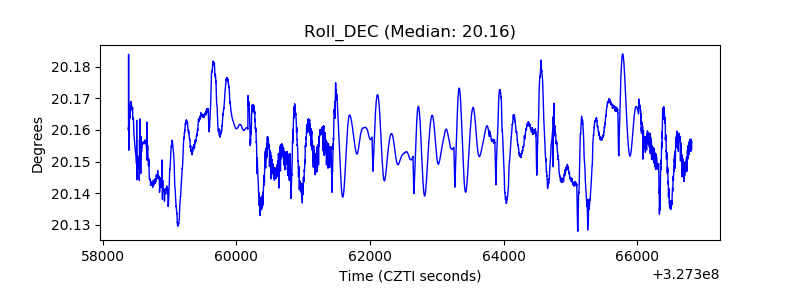 |
| _Roll_RA | 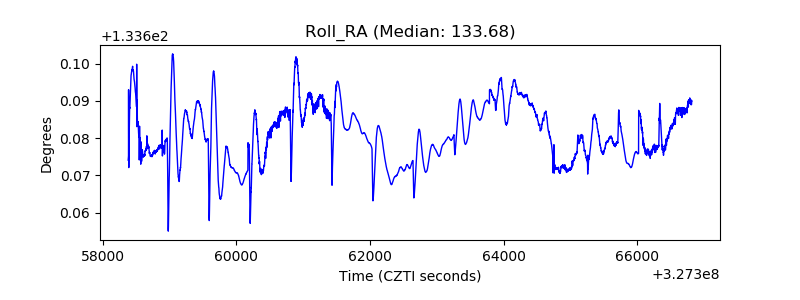 |
| Veto Counter | 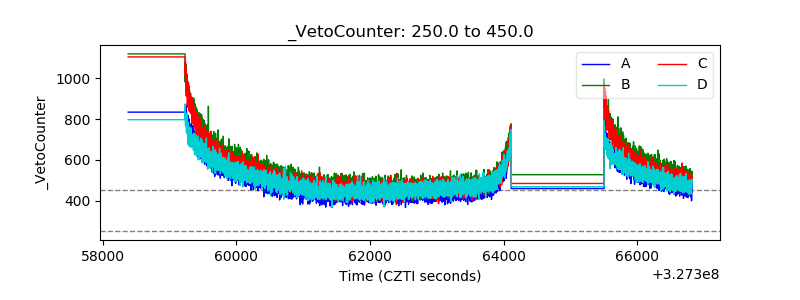 |