| Param | Original file | Final file |
|---|---|---|
| Filename | modeM0/AS1T03_206T01_9000003672_25057cztM0_level2.evt | modeM0/AS1T03_206T01_9000003672_25057cztM0_level2_quad_clean.evt |
| Size (bytes) | 500,958,720 | 73,540,800 |
| Size | 477.8 MB | 70.1 MB |
| Events in quadrant A | 3,193,344 | 468,327 |
| Events in quadrant B | 3,506,815 | 477,789 |
| Events in quadrant C | 3,229,365 | 441,594 |
| Events in quadrant D | 4,821,371 | 406,060 |
| Mode M9 | |||
|---|---|---|---|
| Quadrant | BADHDUFLAG | Total packets | Discarded packets |
| A | 0 | 21 | 0 |
| B | 0 | 22 | 0 |
| C | 0 | 22 | 0 |
| D | 0 | 22 | 0 |
| Mode SS | |||
|---|---|---|---|
| Quadrant | BADHDUFLAG | Total packets | Discarded packets |
| A | 0 | 124 | 0 |
| B | 0 | 124 | 0 |
| C | 0 | 124 | 0 |
| D | 0 | 124 | 0 |
| Mode M0 | |||
|---|---|---|---|
| Quadrant | BADHDUFLAG | Total packets | Discarded packets |
| A | 0 | 13034 | 2 |
| B | 0 | 14063 | 2 |
| C | 0 | 13105 | 2 |
| D | 0 | 18396 | 2 |
| Quadrant | Total seconds | Saturated seconds | Saturation percentage |
|---|---|---|---|
| A | 6210 | 40 | 0.644122% |
| B | 6210 | 100 | 1.610306% |
| C | 6209 | 58 | 0.934128% |
| D | 6209 | 323 | 5.202126% |
Noise dominated data is calculated using 1-second bins in cleaned event files. If a bin has >2000 counts, and if more than 50% of those come from <1% of pixels, then it is considered to be noise-dominated and hence unusable.
| Quadrant | # 1 sec bins | Bins with >0 counts | Bins with >2000 counts | High rate bins dominated by noise | Noise dominated (total time) | Noise dominated (detector-on time) | Marked lightcurve |
|---|---|---|---|---|---|---|---|
| A | 7535 | 6211 | 0 | 0 | 0.00% | 0.00% | 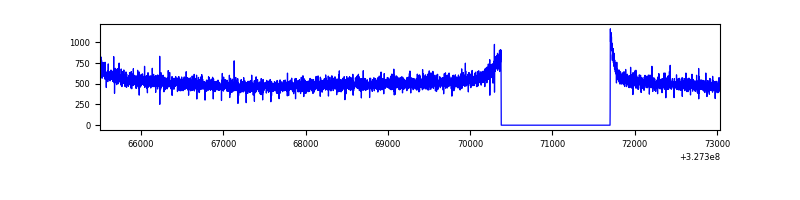 |
| B | 7535 | 6211 | 38 | 38 | 0.50% | 0.61% | 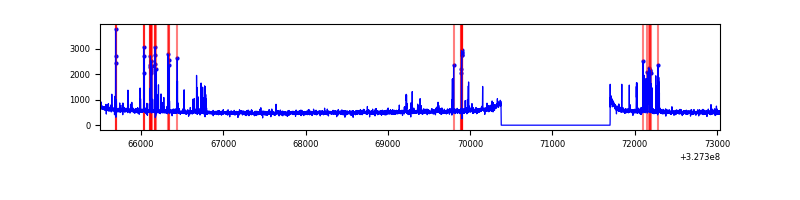 |
| C | 7534 | 6210 | 0 | 0 | 0.00% | 0.00% | 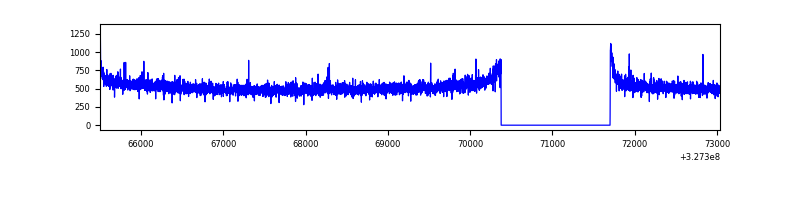 |
| D | 7534 | 6210 | 288 | 288 | 3.82% | 4.64% | 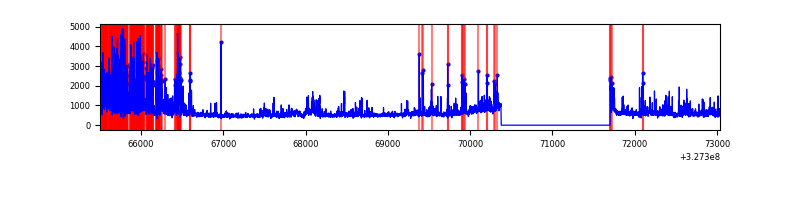 |
Top three noisy pixels from each quadrant. If the there are fewer than three noisy pixels in the level2.evt file, extra rows are filled as -1
| Pixel properties | Quadrant properties | ||||||
|---|---|---|---|---|---|---|---|
| Quadrant | DetID | PixID | Counts | Sigma | Mean | Median | Sigma |
| A | 13 | 254 | 11412 | 63.78 | 828 | 813 | 166.2 |
| A | 3 | 137 | 7083 | 37.73 | 828 | 813 | 166.2 |
| A | 0 | 226 | 7057 | 37.57 | 828 | 813 | 166.2 |
| B | 4 | 80 | 184749 | 1180.88 | 830 | 812 | 155.8 |
| B | 10 | 251 | 31822 | 199.08 | 830 | 812 | 155.8 |
| B | 12 | 111 | 17983 | 110.24 | 830 | 812 | 155.8 |
| C | 14 | 238 | 127236 | 692.85 | 785 | 792 | 182.5 |
| C | 7 | 247 | 19168 | 100.69 | 785 | 792 | 182.5 |
| C | 3 | 233 | 17594 | 92.07 | 785 | 792 | 182.5 |
| D | 1 | 52 | 1454579 | 7748.63 | 770 | 748 | 187.6 |
| D | 8 | 195 | 285039 | 1515.21 | 770 | 748 | 187.6 |
| D | 12 | 233 | 42521 | 222.64 | 770 | 748 | 187.6 |
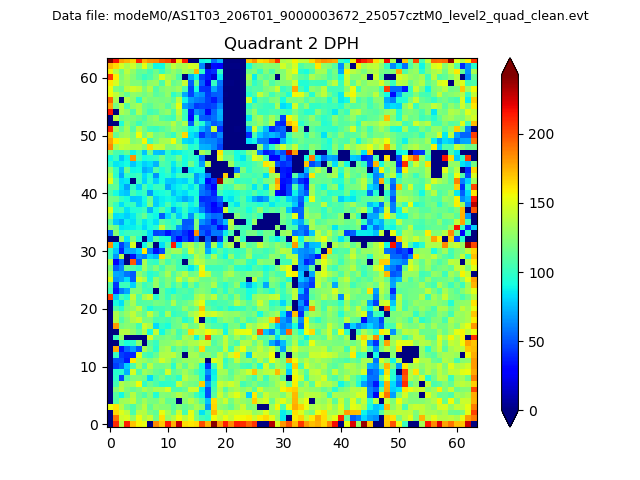
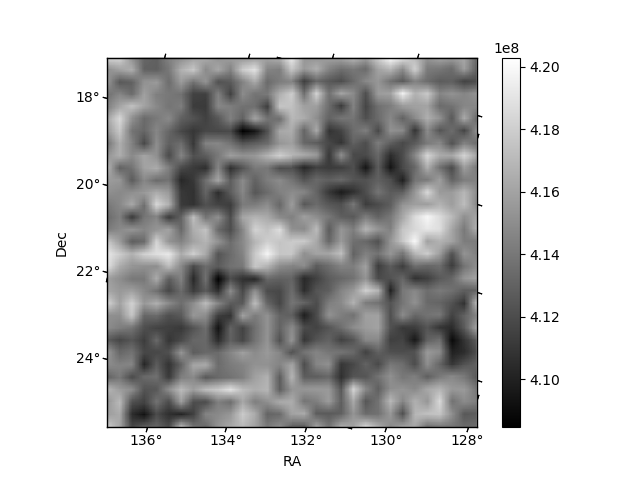
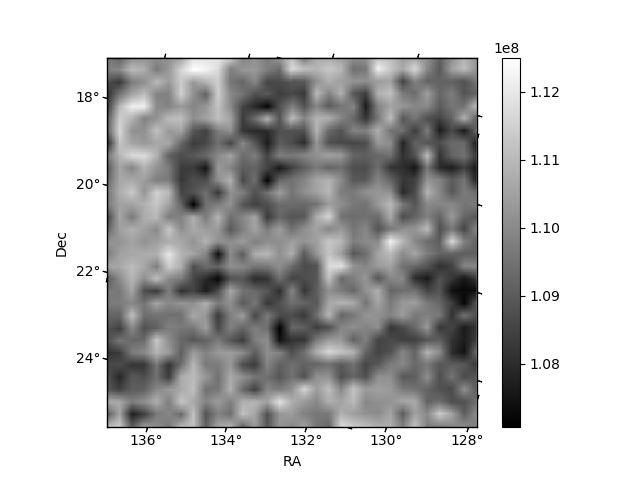
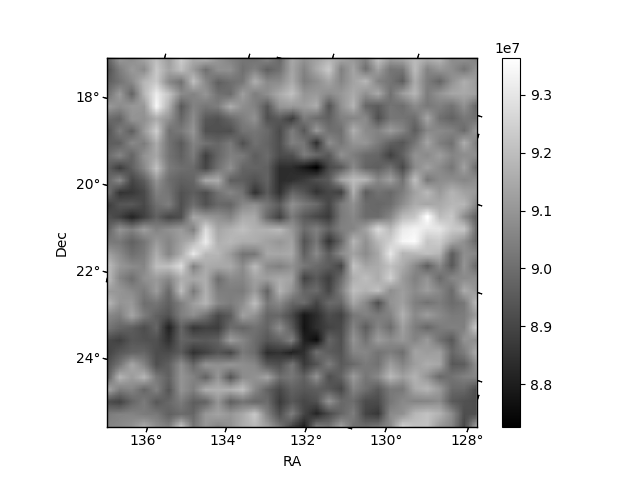
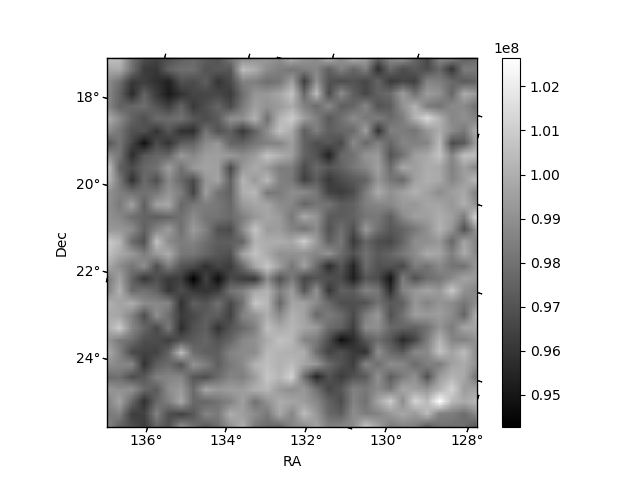
Histogram calculated using DETX and DETY for each event in the final _common_clean file
| Quadrant A | 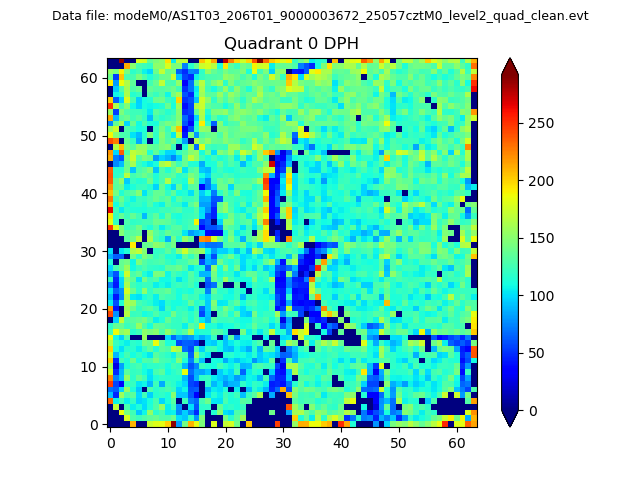 |
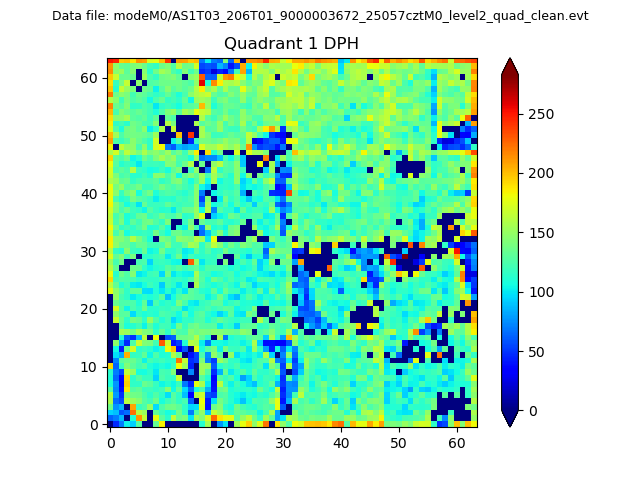 |
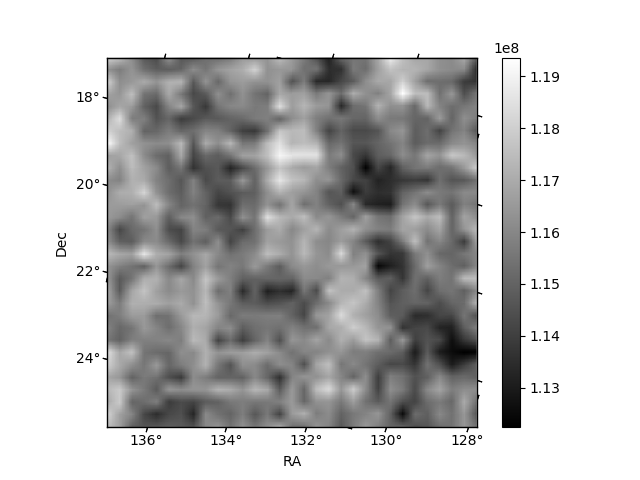
Quadrant B |
|---|---|---|---|
| Quadrant D | 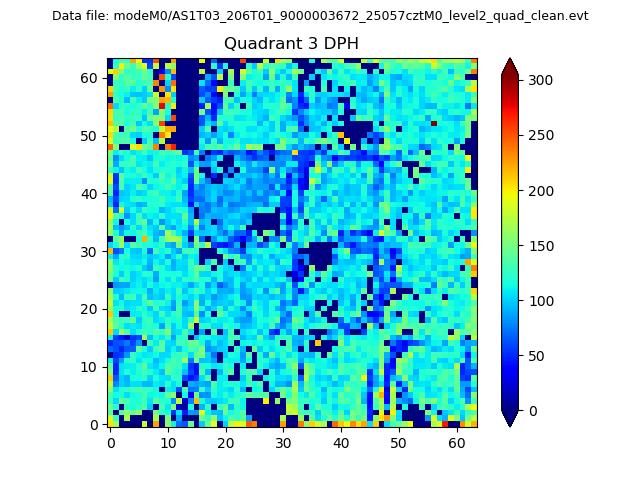 |
 |
Quadrant C |
| Plot type | Count rate plots | Images |
|---|---|---|
| Comparison with Poisson distribution Blue bars denote a histogram of data divided into 1 sec bins. Red curve is a Poisson curve with rate = median count rate of data. |
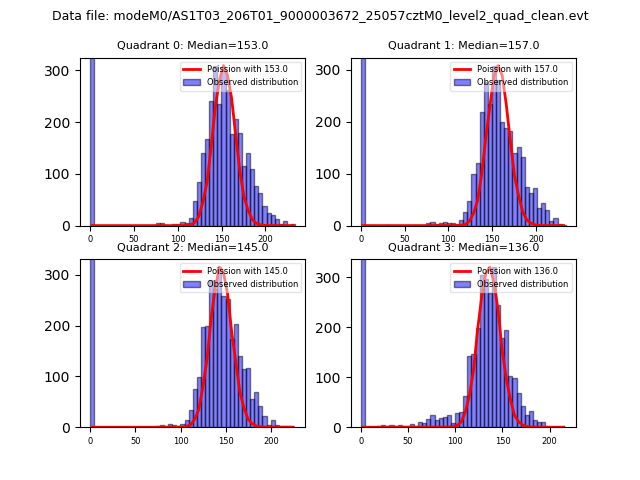 |
 |
| Quadrant-wise count rates Data is divided into 100 sec bins |
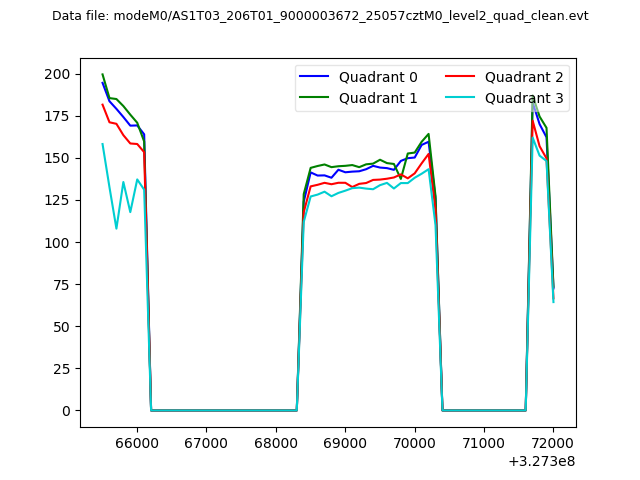 |
|
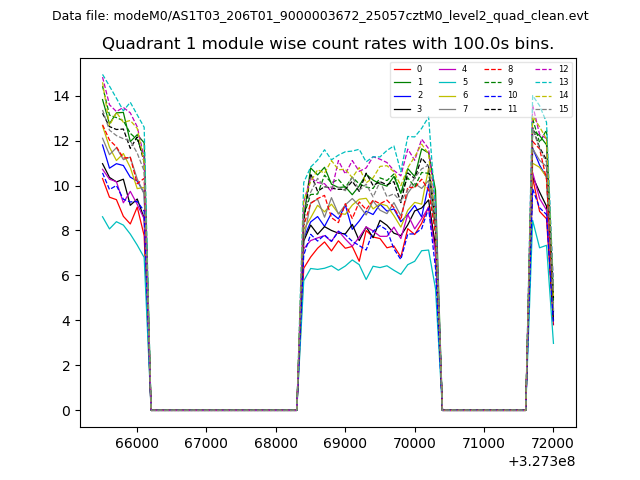
| Module-wise count rates for Quadrant A Data is divided into 100 sec bins |
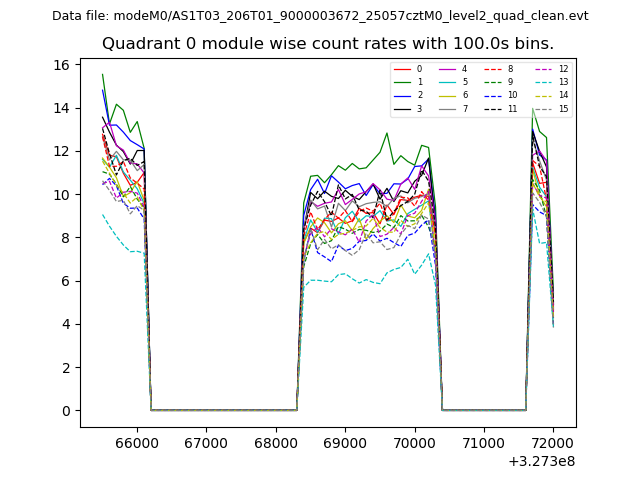 |
 |
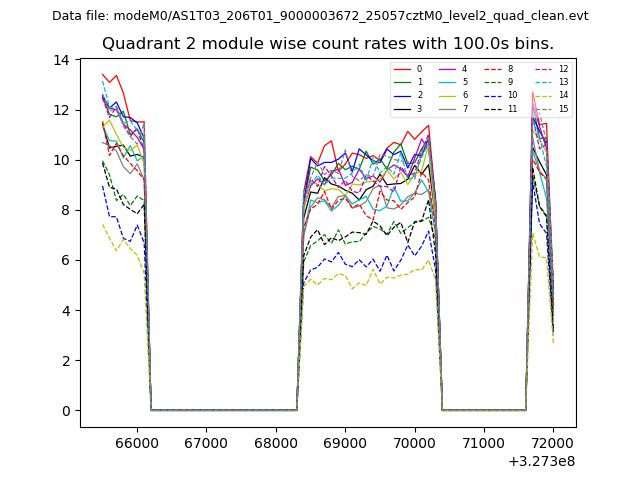
| Module-wise count rates for Quadrant B Data is divided into 100 sec bins |
 |
 |
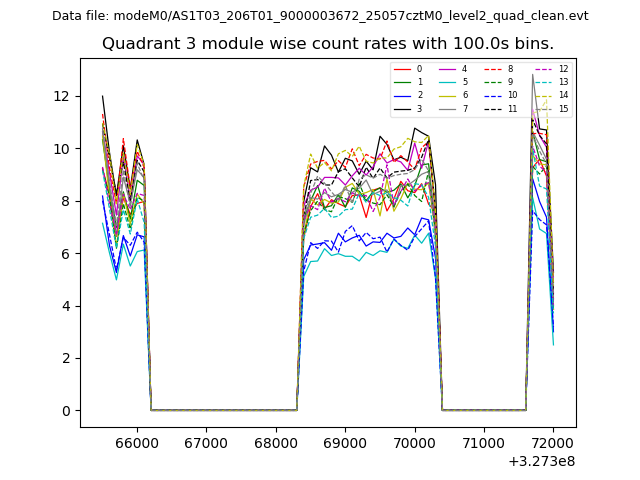
| Module-wise count rates for Quadrant C Data is divided into 100 sec bins |
 |
 |
| Module-wise count rates for Quadrant D Data is divided into 100 sec bins |
 |
 |
| Parameter | Plot |
|---|---|
| CZT HV Monitor | 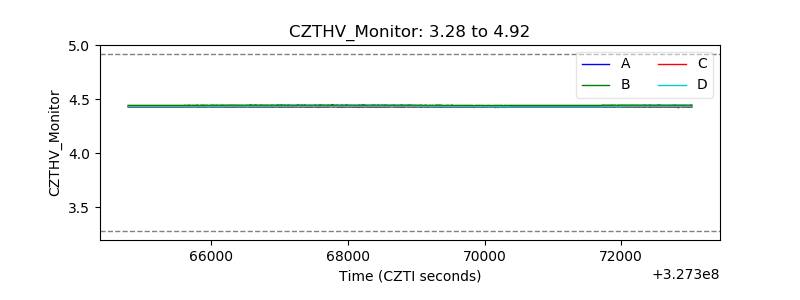 |
| D_VDD | 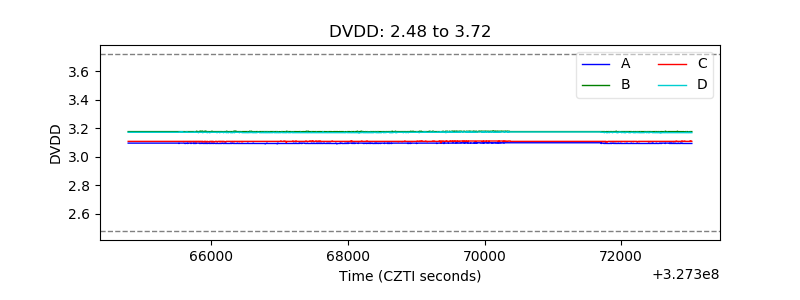 |
| Temperature 1 | 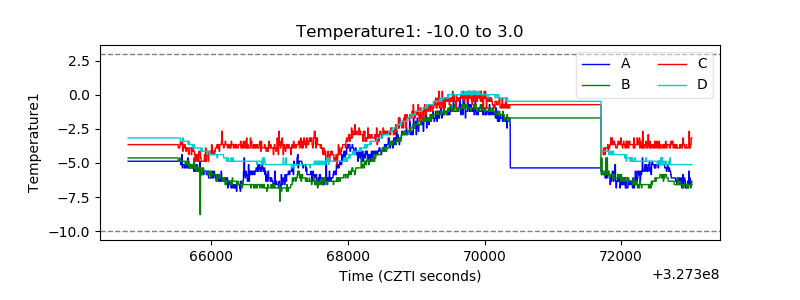 |
| Veto HV Monitor | 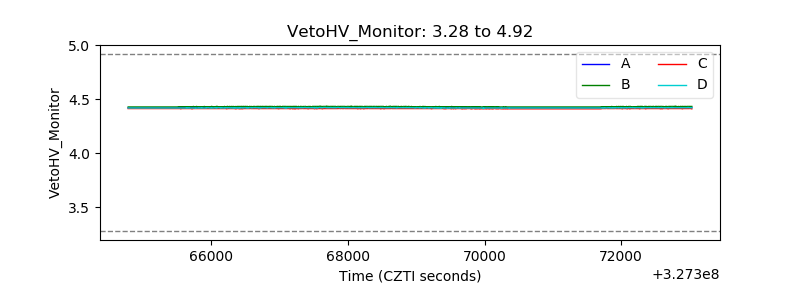 |
| Veto LLD | 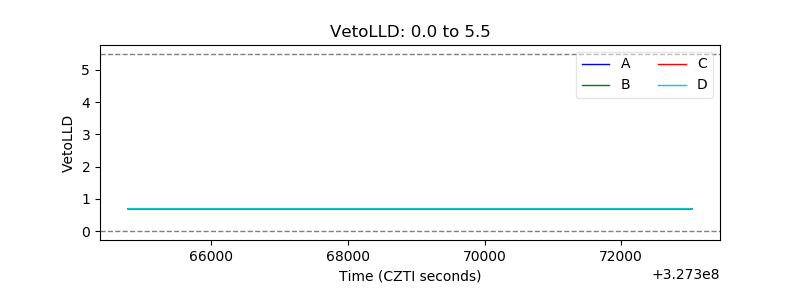 |
| Alpha Counter | 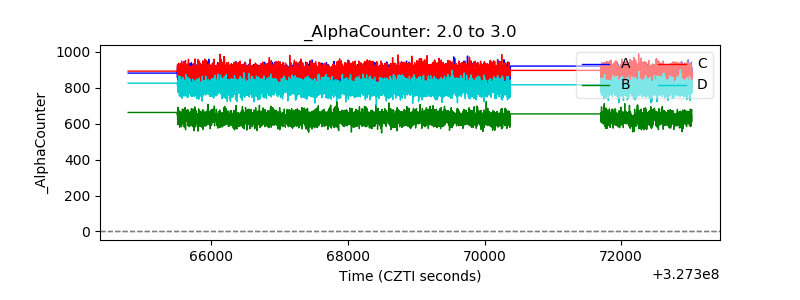 |
| _CPM_Rate | 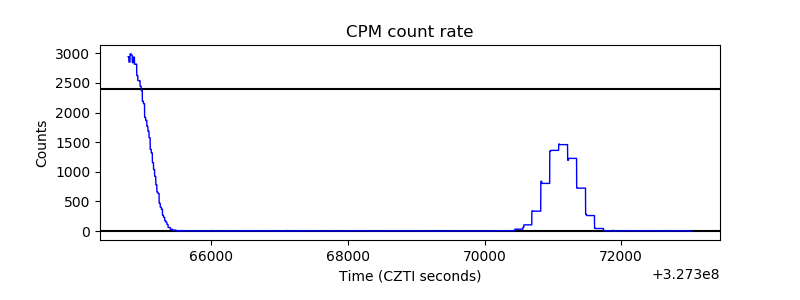 |
| CZT Counter | 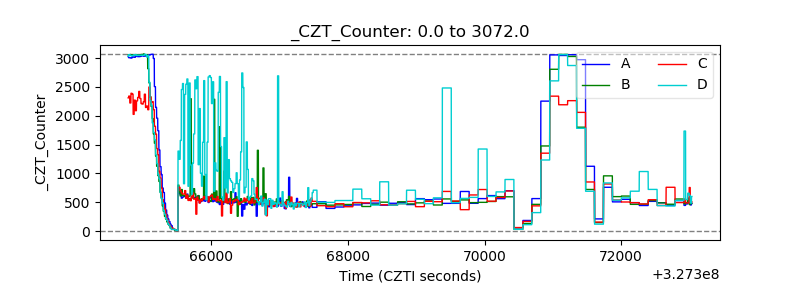 |
| +2.5 Volts monitor |  |
| +5 Volts monitor | 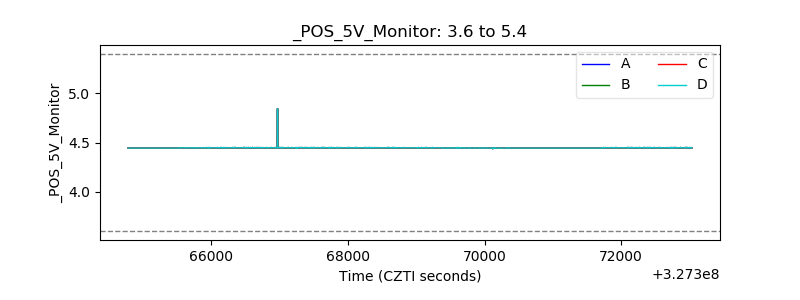 |
| _ROLL_ROT | 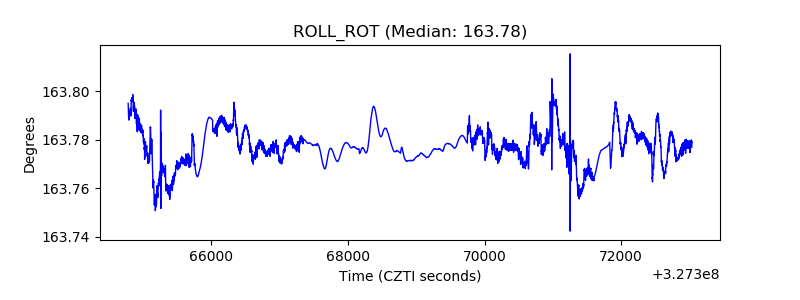 |
| _Roll_DEC | 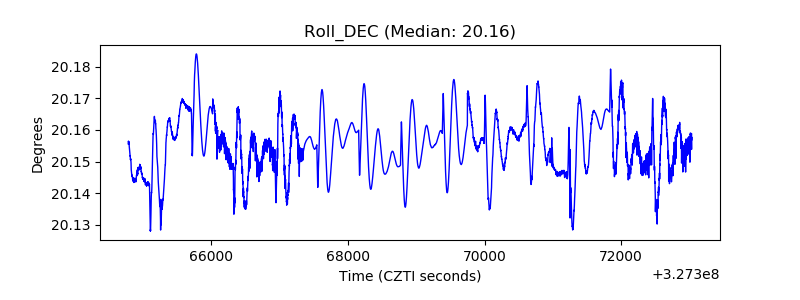 |
| _Roll_RA | 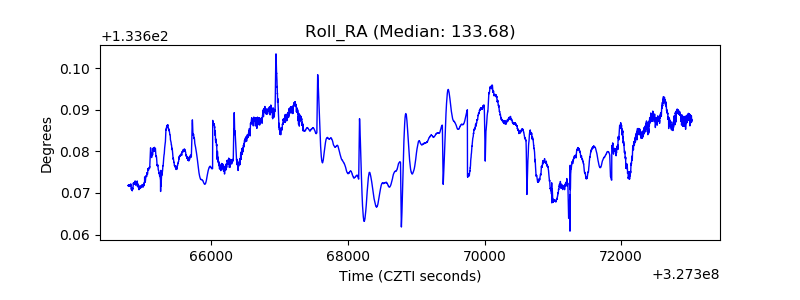 |
| Veto Counter | 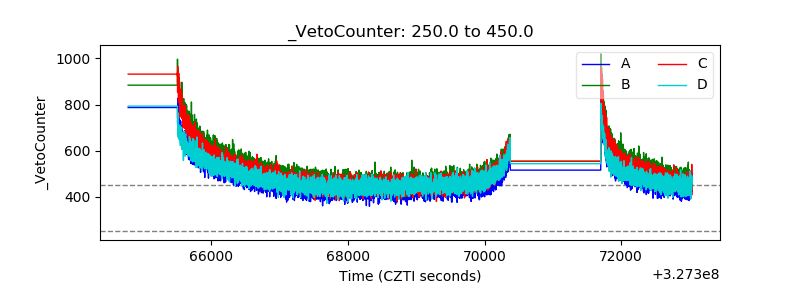 |