| Param | Original file | Final file |
|---|---|---|
| Filename | modeM0/AS1T03_206T01_9000003672_25059cztM0_level2.evt | modeM0/AS1T03_206T01_9000003672_25059cztM0_level2_quad_clean.evt |
| Size (bytes) | 526,127,040 | 75,556,800 |
| Size | 501.8 MB | 72.1 MB |
| Events in quadrant A | 3,499,944 | 460,428 |
| Events in quadrant B | 3,629,138 | 467,824 |
| Events in quadrant C | 3,580,838 | 441,324 |
| Events in quadrant D | 4,740,736 | 422,406 |
| Mode M9 | |||
|---|---|---|---|
| Quadrant | BADHDUFLAG | Total packets | Discarded packets |
| A | 0 | 10 | 0 |
| B | 0 | 11 | 0 |
| C | 0 | 11 | 0 |
| D | 0 | 11 | 0 |
| Mode SS | |||
|---|---|---|---|
| Quadrant | BADHDUFLAG | Total packets | Discarded packets |
| A | 0 | 144 | 0 |
| B | 0 | 144 | 0 |
| C | 0 | 144 | 0 |
| D | 0 | 144 | 0 |
| Mode M0 | |||
|---|---|---|---|
| Quadrant | BADHDUFLAG | Total packets | Discarded packets |
| A | 0 | 14802 | 2 |
| B | 0 | 15105 | 2 |
| C | 0 | 14966 | 2 |
| D | 0 | 18664 | 2 |
| Quadrant | Total seconds | Saturated seconds | Saturation percentage |
|---|---|---|---|
| A | 7121 | 169 | 2.373262% |
| B | 7121 | 197 | 2.766465% |
| C | 7121 | 191 | 2.682208% |
| D | 7121 | 250 | 3.510743% |
Noise dominated data is calculated using 1-second bins in cleaned event files. If a bin has >2000 counts, and if more than 50% of those come from <1% of pixels, then it is considered to be noise-dominated and hence unusable.
| Quadrant | # 1 sec bins | Bins with >0 counts | Bins with >2000 counts | High rate bins dominated by noise | Noise dominated (total time) | Noise dominated (detector-on time) | Marked lightcurve |
|---|---|---|---|---|---|---|---|
| A | 7726 | 7122 | 0 | 0 | 0.00% | 0.00% | 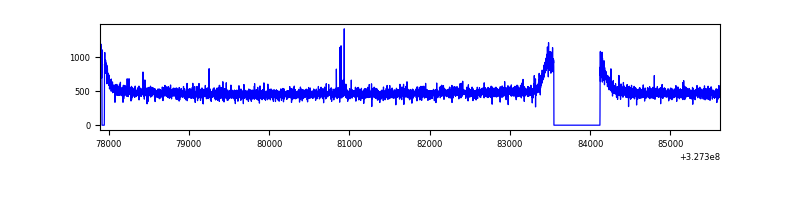 |
| B | 7726 | 7122 | 0 | 0 | 0.00% | 0.00% | 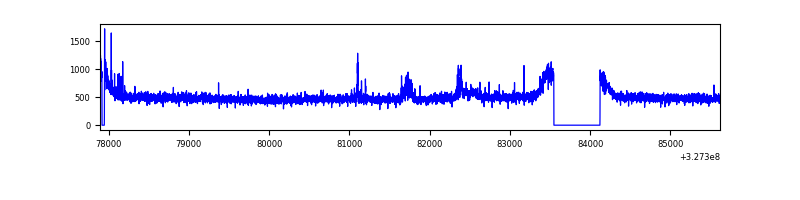 |
| C | 7726 | 7123 | 0 | 0 | 0.00% | 0.00% | 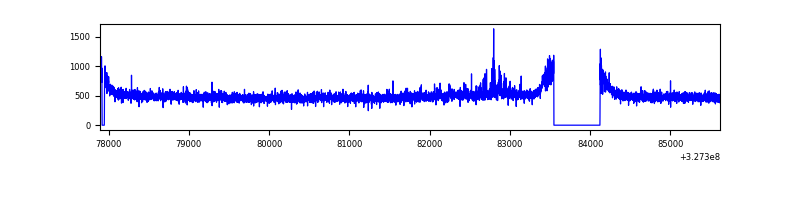 |
| D | 7726 | 7122 | 83 | 83 | 1.07% | 1.17% | 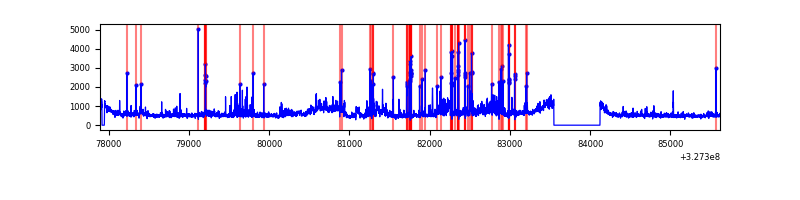 |
Top three noisy pixels from each quadrant. If the there are fewer than three noisy pixels in the level2.evt file, extra rows are filled as -1
| Pixel properties | Quadrant properties | ||||||
|---|---|---|---|---|---|---|---|
| Quadrant | DetID | PixID | Counts | Sigma | Mean | Median | Sigma |
| A | 13 | 254 | 12849 | 65.42 | 905 | 885 | 182.9 |
| A | 15 | 174 | 8508 | 41.68 | 905 | 885 | 182.9 |
| A | 3 | 137 | 8371 | 40.93 | 905 | 885 | 182.9 |
| B | 0 | 190 | 47907 | 268.09 | 904 | 881 | 175.4 |
| B | 12 | 111 | 21901 | 119.83 | 904 | 881 | 175.4 |
| B | 11 | 111 | 19229 | 104.6 | 904 | 881 | 175.4 |
| C | 14 | 238 | 135627 | 659.32 | 864 | 869 | 204.4 |
| C | 3 | 233 | 63644 | 307.14 | 864 | 869 | 204.4 |
| C | 7 | 247 | 16084 | 74.44 | 864 | 869 | 204.4 |
| D | 1 | 52 | 516805 | 2437.51 | 867 | 842 | 211.7 |
| D | 7 | 238 | 486854 | 2296.02 | 867 | 842 | 211.7 |
| D | 8 | 195 | 263822 | 1242.37 | 867 | 842 | 211.7 |
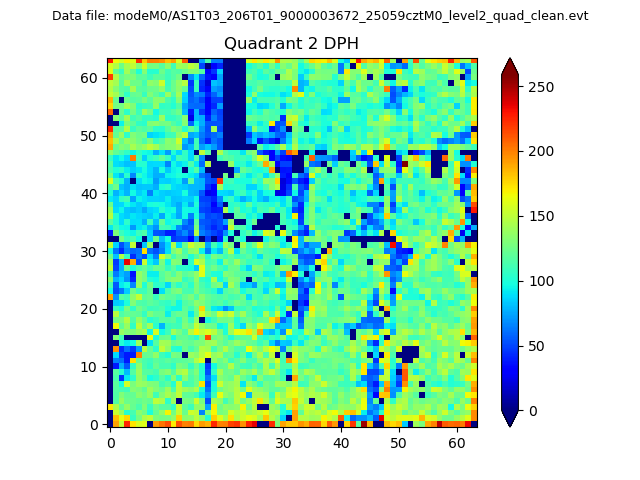
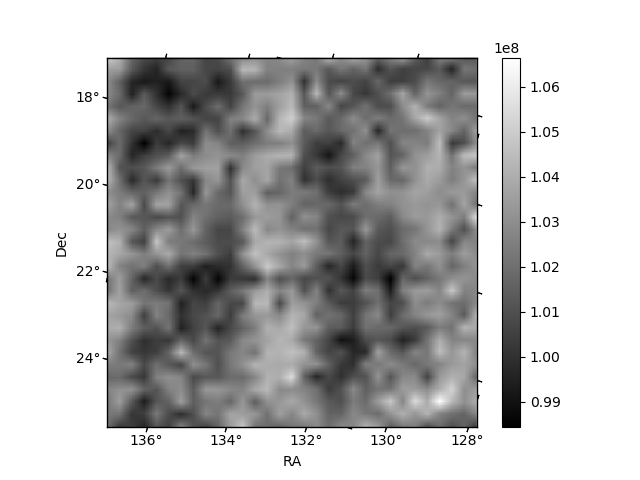
Histogram calculated using DETX and DETY for each event in the final _common_clean file
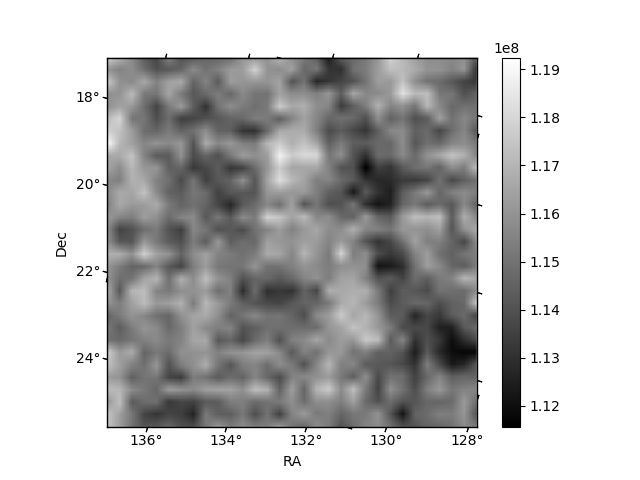
| Quadrant A | 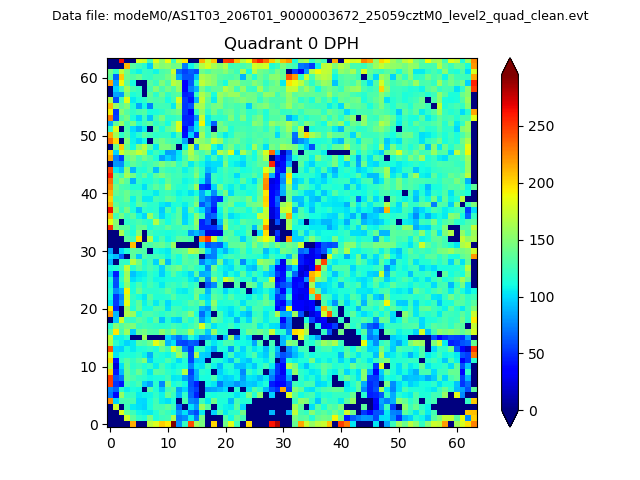 |
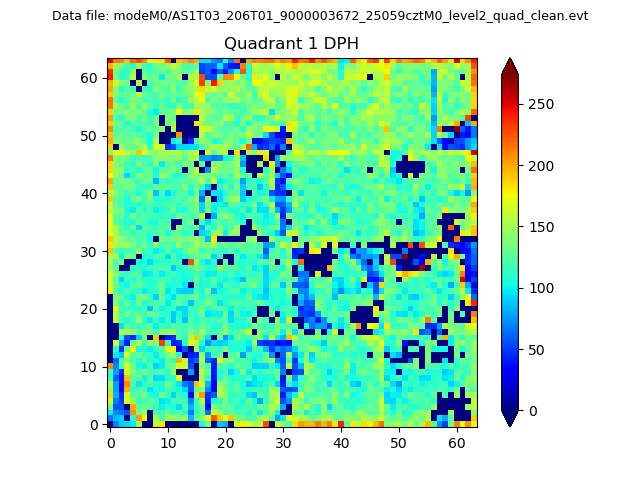 |
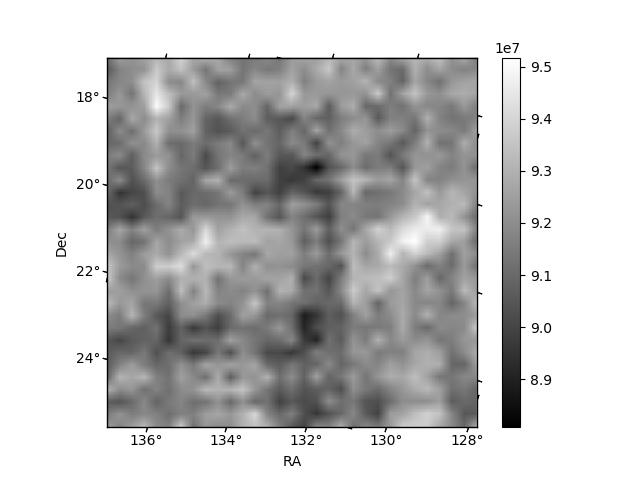
Quadrant B |
|---|---|---|---|
| Quadrant D | 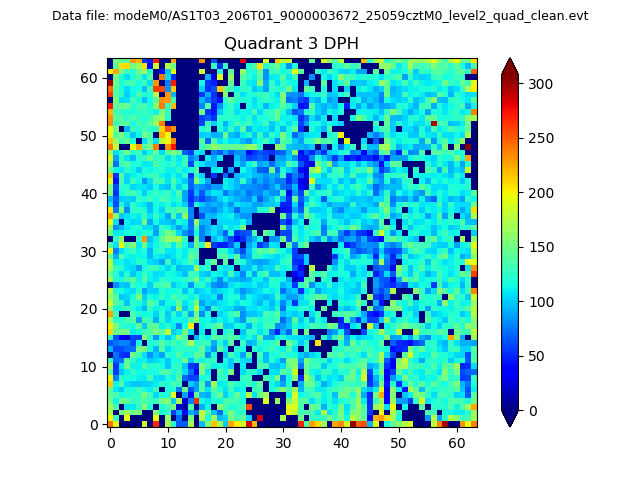 |
 |
Quadrant C |
| Plot type | Count rate plots | Images |
|---|---|---|
| Comparison with Poisson distribution Blue bars denote a histogram of data divided into 1 sec bins. Red curve is a Poisson curve with rate = median count rate of data. |
 |
 |
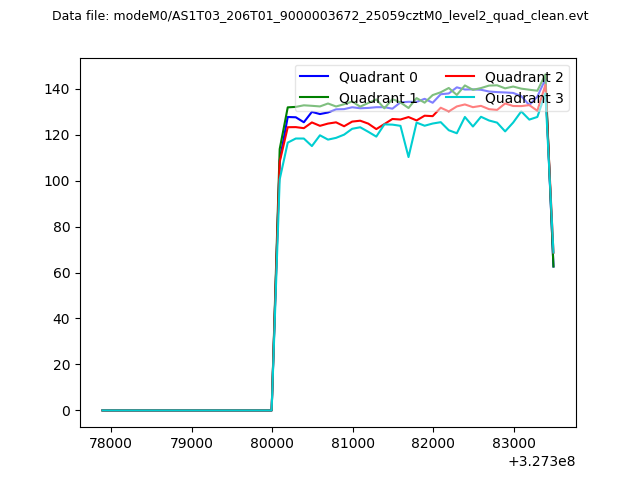
| Quadrant-wise count rates Data is divided into 100 sec bins |
 |
|
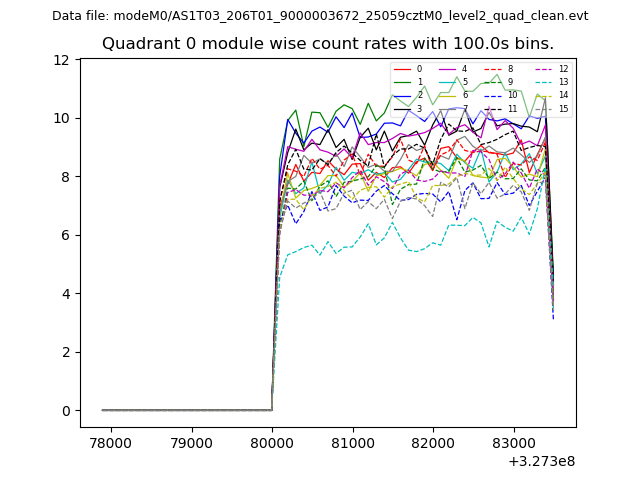
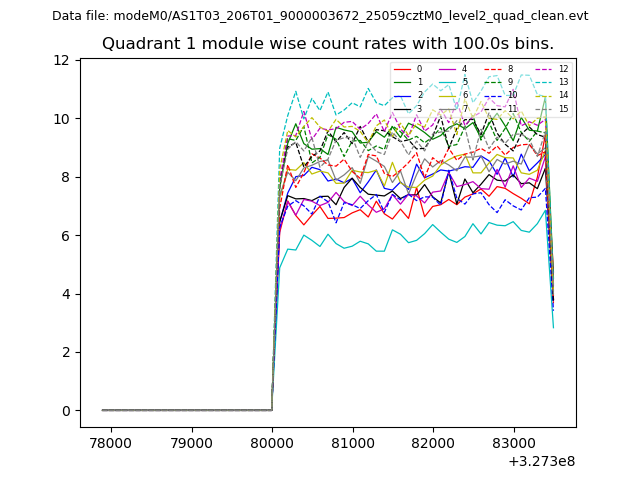
| Module-wise count rates for Quadrant A Data is divided into 100 sec bins |
 |
 |
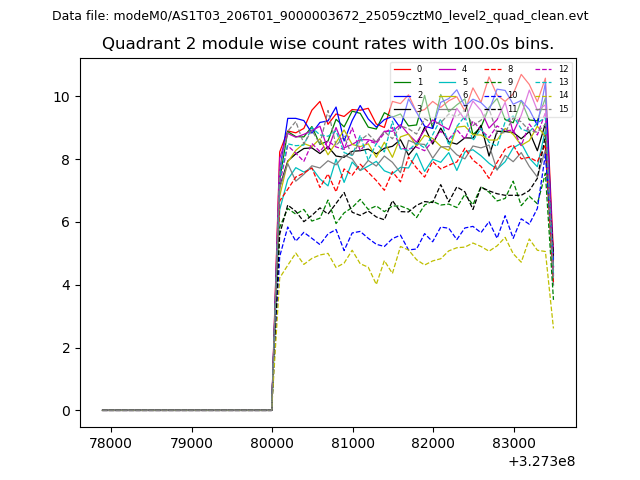
| Module-wise count rates for Quadrant B Data is divided into 100 sec bins |
 |
 |
| Module-wise count rates for Quadrant C Data is divided into 100 sec bins |
 |
 |
| Module-wise count rates for Quadrant D Data is divided into 100 sec bins |
 |
 |
| Parameter | Plot |
|---|---|
| CZT HV Monitor | 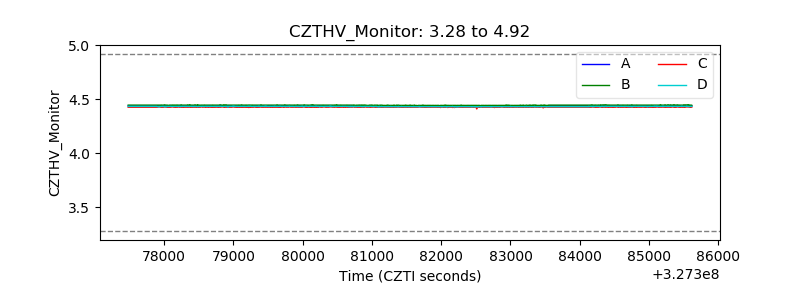 |
| D_VDD | 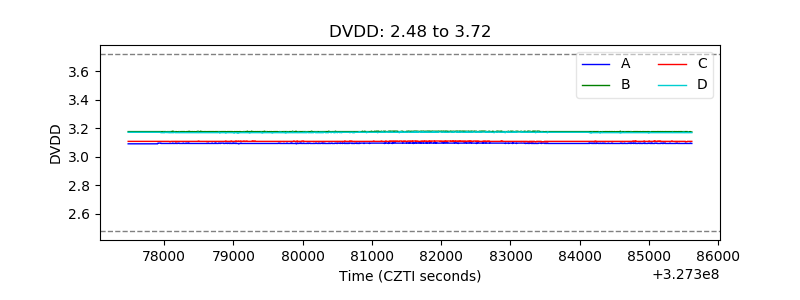 |
| Temperature 1 | 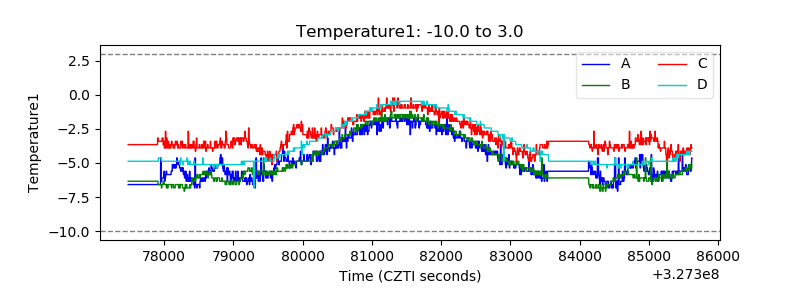 |
| Veto HV Monitor | 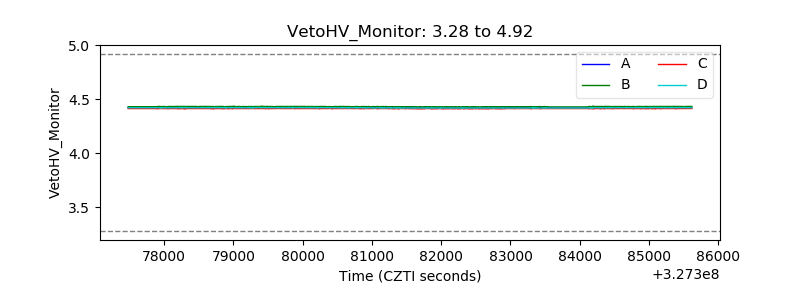 |
| Veto LLD | 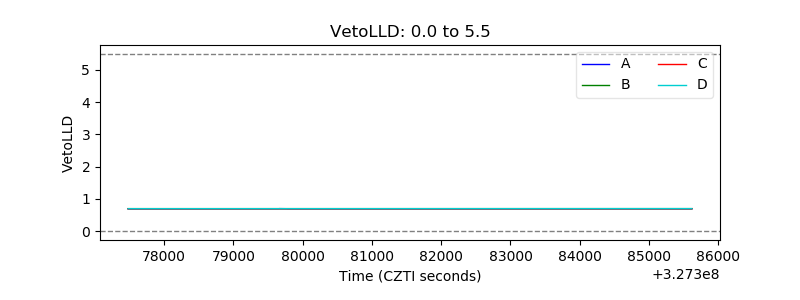 |
| Alpha Counter | 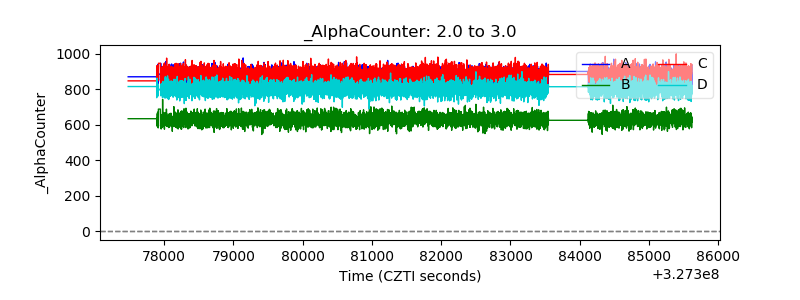 |
| _CPM_Rate | 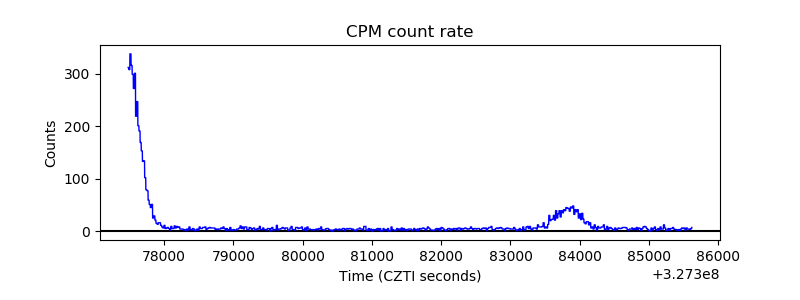 |
| CZT Counter | 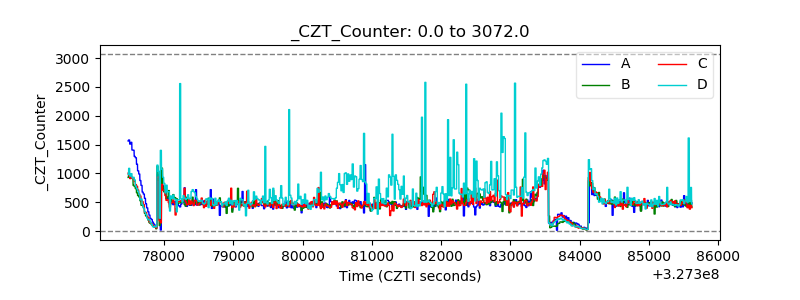 |
| +2.5 Volts monitor |  |
| +5 Volts monitor | 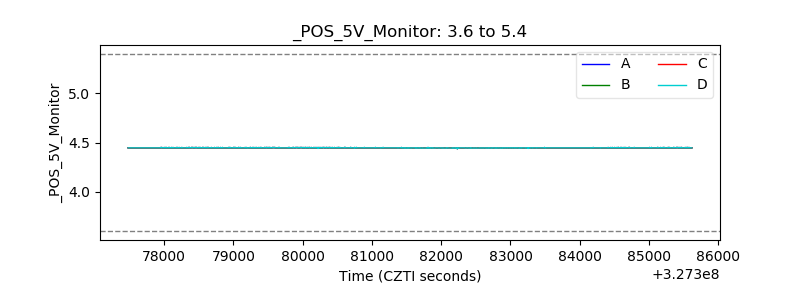 |
| _ROLL_ROT | 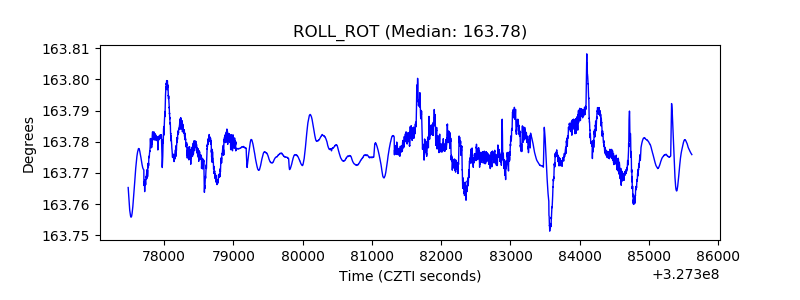 |
| _Roll_DEC | 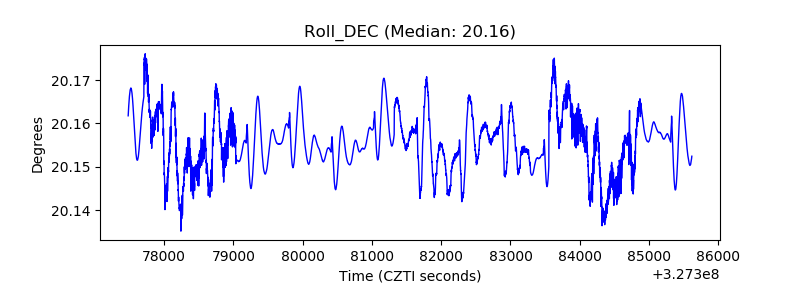 |
| _Roll_RA | 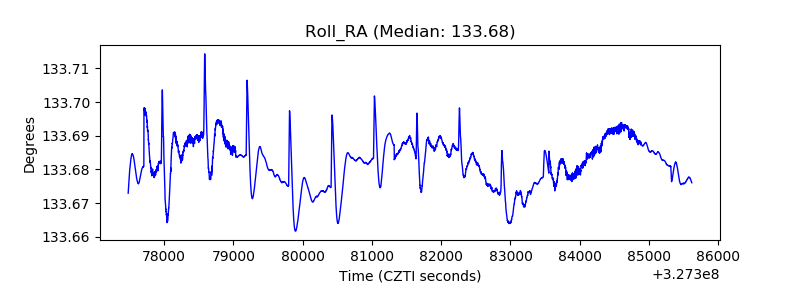 |
| Veto Counter |  |