| Param | Original file | Final file |
|---|---|---|
| Filename | modeM0/AS1T03_206T01_9000003672_25061cztM0_level2.evt | modeM0/AS1T03_206T01_9000003672_25061cztM0_level2_quad_clean.evt |
| Size (bytes) | 603,031,680 | 86,143,680 |
| Size | 575.1 MB | 82.2 MB |
| Events in quadrant A | 3,691,891 | 535,381 |
| Events in quadrant B | 3,839,324 | 544,616 |
| Events in quadrant C | 3,783,394 | 514,823 |
| Events in quadrant D | 6,425,519 | 477,255 |
| Mode M9 | |||
|---|---|---|---|
| Quadrant | BADHDUFLAG | Total packets | Discarded packets |
| A | 0 | 2 | 0 |
| B | 0 | 3 | 0 |
| C | 0 | 3 | 0 |
| D | 0 | 3 | 0 |
| Mode SS | |||
|---|---|---|---|
| Quadrant | BADHDUFLAG | Total packets | Discarded packets |
| A | 0 | 156 | 0 |
| B | 0 | 156 | 0 |
| C | 0 | 156 | 0 |
| D | 0 | 156 | 0 |
| Mode M0 | |||
|---|---|---|---|
| Quadrant | BADHDUFLAG | Total packets | Discarded packets |
| A | 0 | 15914 | 2 |
| B | 0 | 16169 | 2 |
| C | 0 | 15985 | 2 |
| D | 0 | 24659 | 2 |
| Quadrant | Total seconds | Saturated seconds | Saturation percentage |
|---|---|---|---|
| A | 7711 | 215 | 2.788225% |
| B | 7711 | 258 | 3.345870% |
| C | 7711 | 259 | 3.358838% |
| D | 7711 | 626 | 8.118273% |
Noise dominated data is calculated using 1-second bins in cleaned event files. If a bin has >2000 counts, and if more than 50% of those come from <1% of pixels, then it is considered to be noise-dominated and hence unusable.
| Quadrant | # 1 sec bins | Bins with >0 counts | Bins with >2000 counts | High rate bins dominated by noise | Noise dominated (total time) | Noise dominated (detector-on time) | Marked lightcurve |
|---|---|---|---|---|---|---|---|
| A | 7911 | 7712 | 0 | 0 | 0.00% | 0.00% | 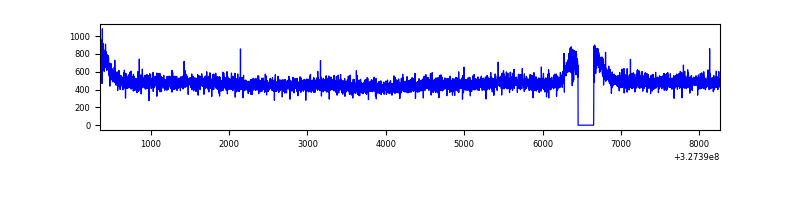 |
| B | 7911 | 7711 | 5 | 5 | 0.06% | 0.06% | 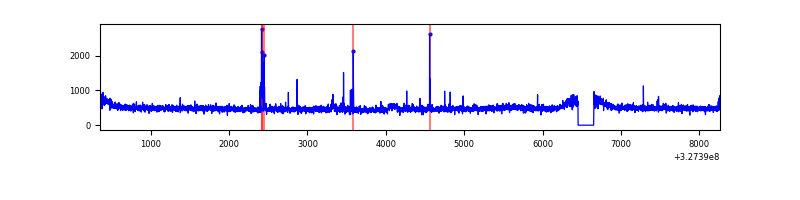 |
| C | 7911 | 7712 | 0 | 0 | 0.00% | 0.00% | 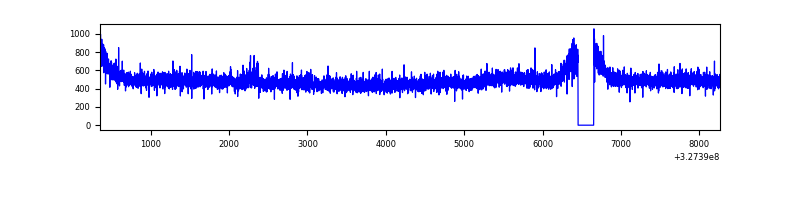 |
| D | 7911 | 7711 | 356 | 356 | 4.50% | 4.62% | 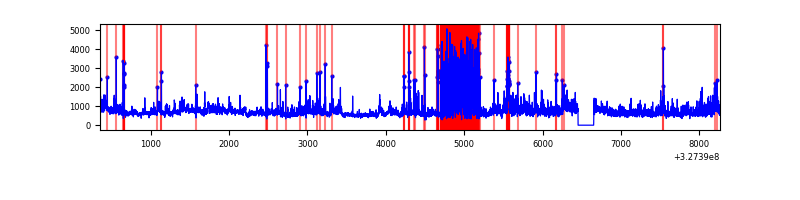 |
Top three noisy pixels from each quadrant. If the there are fewer than three noisy pixels in the level2.evt file, extra rows are filled as -1
| Pixel properties | Quadrant properties | ||||||
|---|---|---|---|---|---|---|---|
| Quadrant | DetID | PixID | Counts | Sigma | Mean | Median | Sigma |
| A | 13 | 254 | 13054 | 62.31 | 957 | 936 | 194.5 |
| A | 3 | 137 | 9116 | 42.06 | 957 | 936 | 194.5 |
| A | 0 | 226 | 8232 | 37.52 | 957 | 936 | 194.5 |
| B | 10 | 249 | 39602 | 209.26 | 954 | 928 | 184.8 |
| B | 12 | 111 | 23041 | 119.65 | 954 | 928 | 184.8 |
| B | 5 | 172 | 21802 | 112.95 | 954 | 928 | 184.8 |
| C | 14 | 238 | 145236 | 671.13 | 913 | 918 | 215.0 |
| C | 7 | 247 | 33974 | 153.72 | 913 | 918 | 215.0 |
| C | 3 | 233 | 24641 | 110.32 | 913 | 918 | 215.0 |
| D | 1 | 52 | 1363145 | 6201.78 | 902 | 872 | 219.7 |
| D | 8 | 195 | 858046 | 3902.31 | 902 | 872 | 219.7 |
| D | 7 | 238 | 506944 | 2303.9 | 902 | 872 | 219.7 |
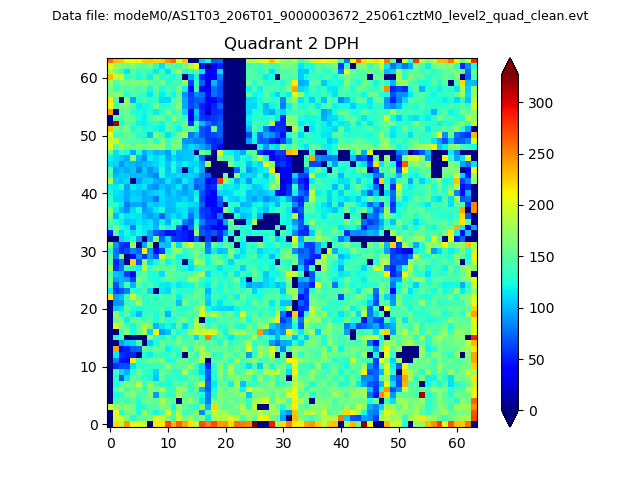
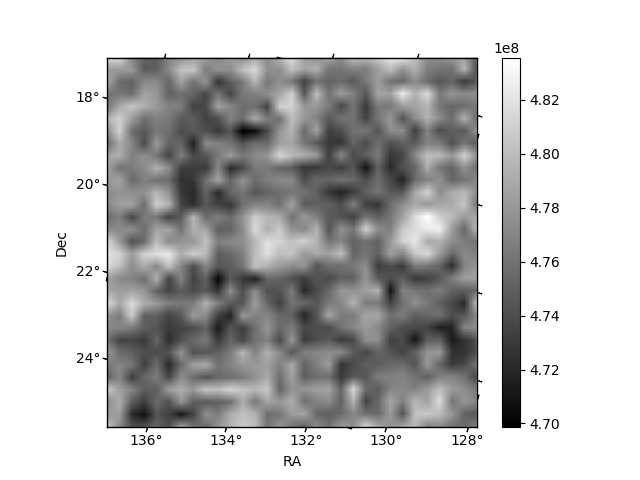
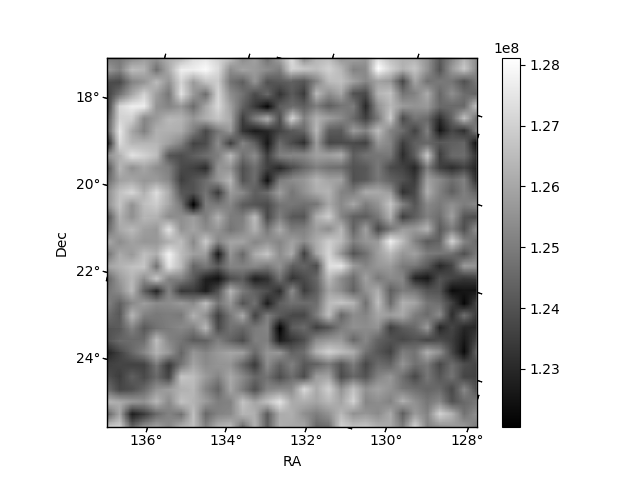
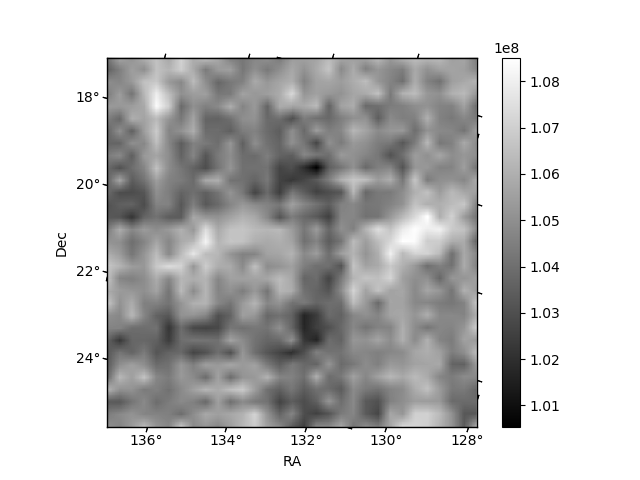
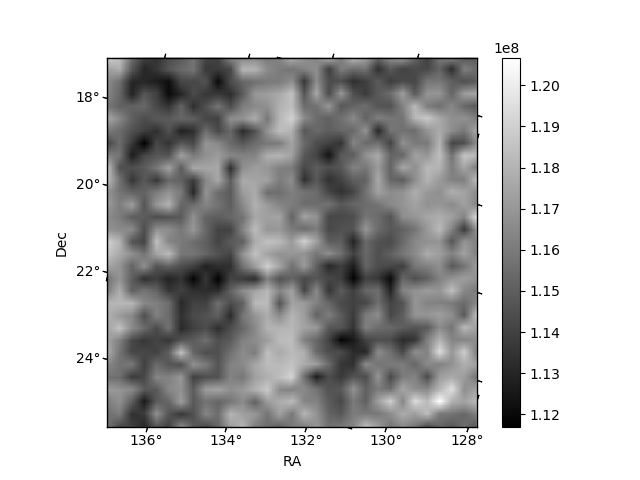
Histogram calculated using DETX and DETY for each event in the final _common_clean file
| Quadrant A | 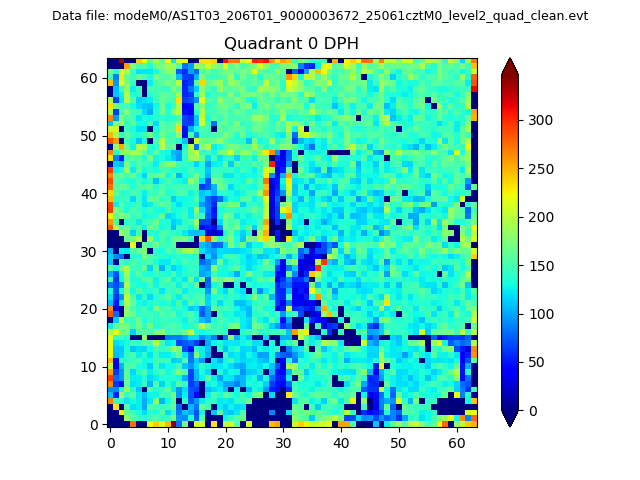 |
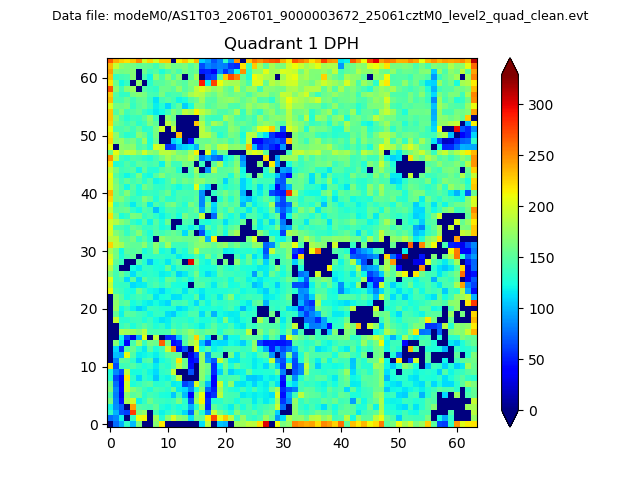 |
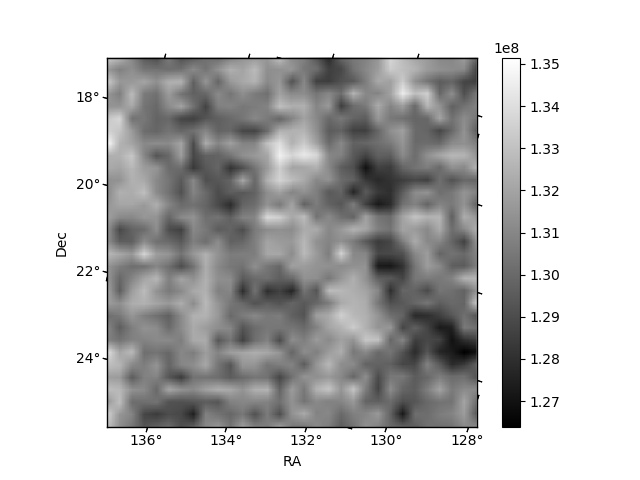
Quadrant B |
|---|---|---|---|
| Quadrant D | 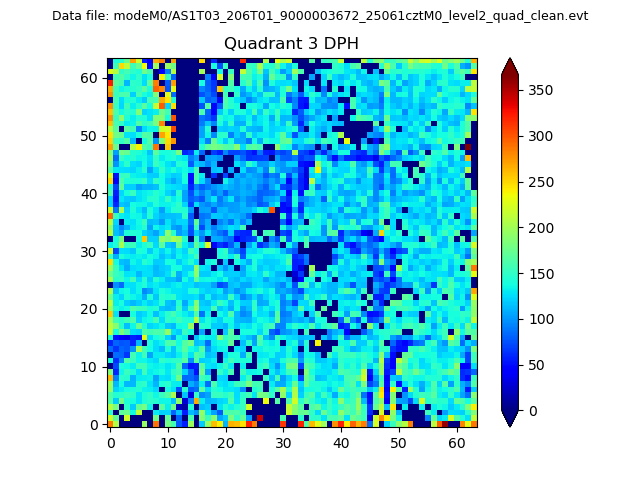 |
 |
Quadrant C |
| Plot type | Count rate plots | Images |
|---|---|---|
| Comparison with Poisson distribution Blue bars denote a histogram of data divided into 1 sec bins. Red curve is a Poisson curve with rate = median count rate of data. |
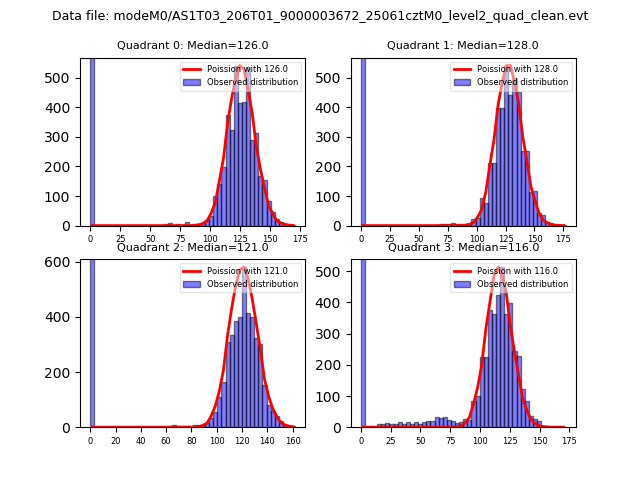 |
 |
| Quadrant-wise count rates Data is divided into 100 sec bins |
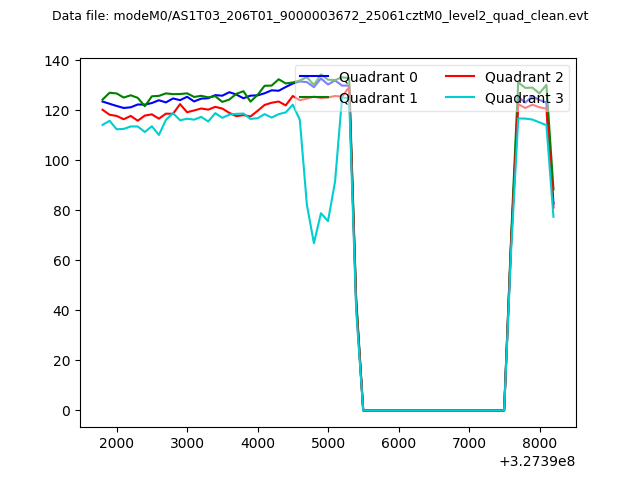 |
|
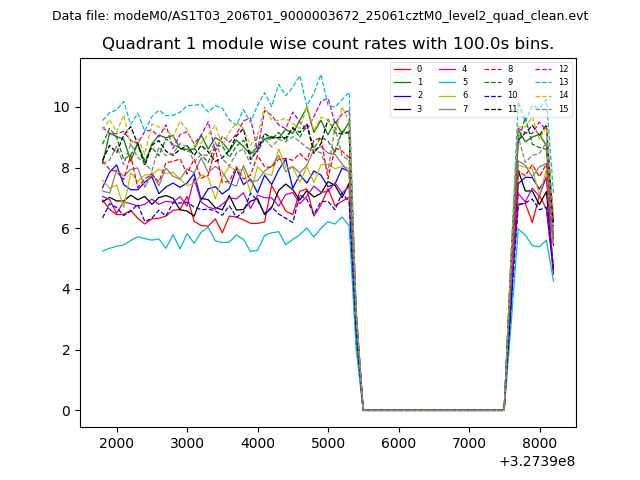
| Module-wise count rates for Quadrant A Data is divided into 100 sec bins |
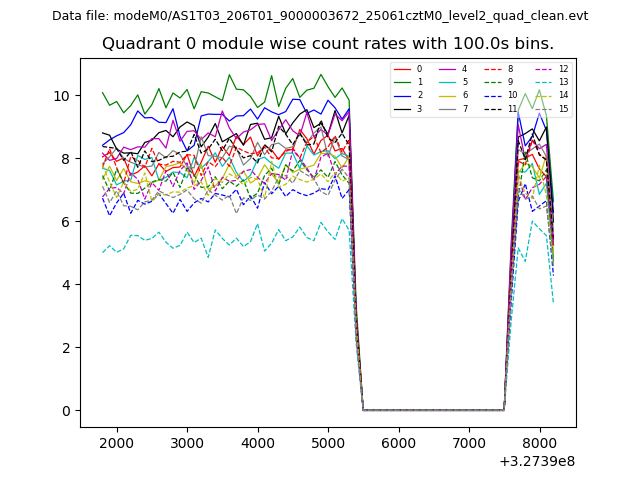 |
 |
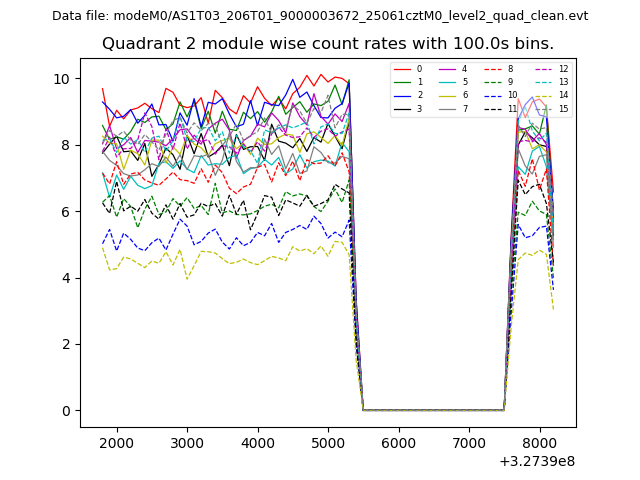
| Module-wise count rates for Quadrant B Data is divided into 100 sec bins |
 |
 |
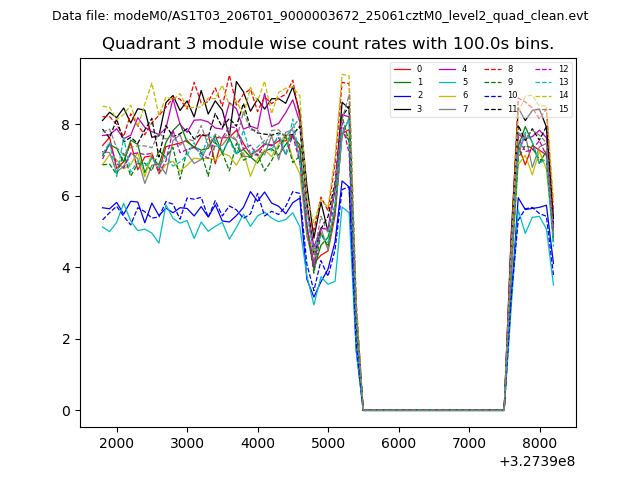
| Module-wise count rates for Quadrant C Data is divided into 100 sec bins |
 |
 |
| Module-wise count rates for Quadrant D Data is divided into 100 sec bins |
 |
 |
| Parameter | Plot |
|---|---|
| CZT HV Monitor | 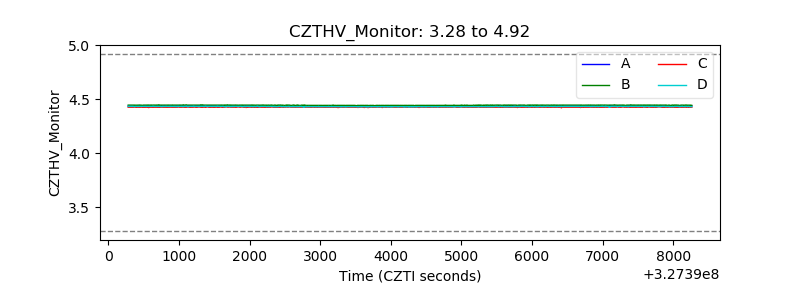 |
| D_VDD | 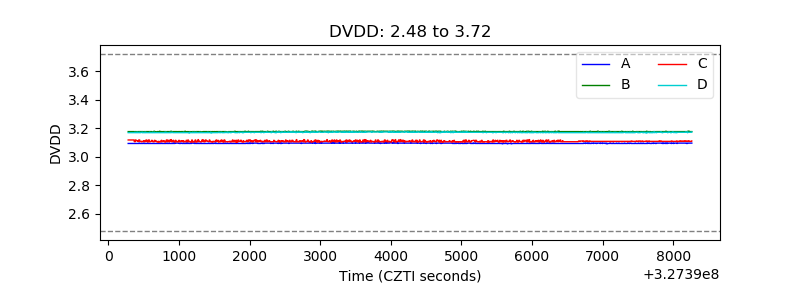 |
| Temperature 1 | 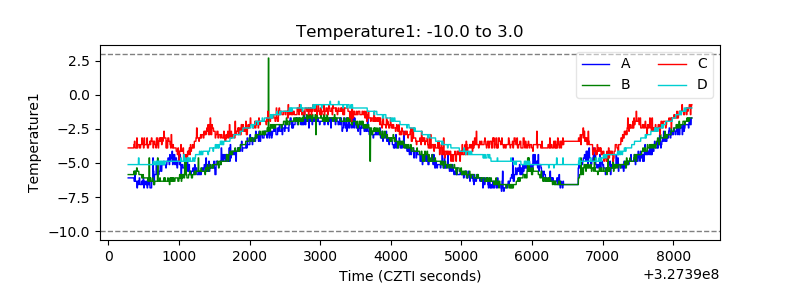 |
| Veto HV Monitor | 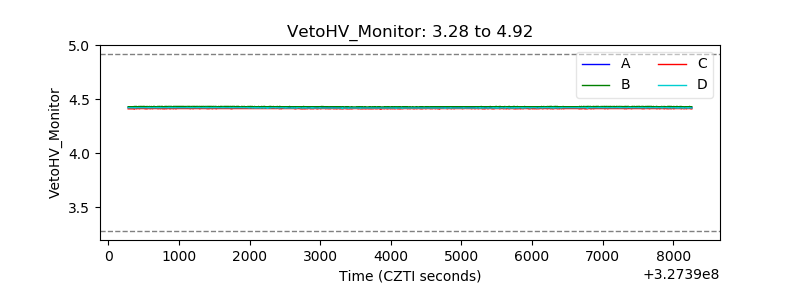 |
| Veto LLD | 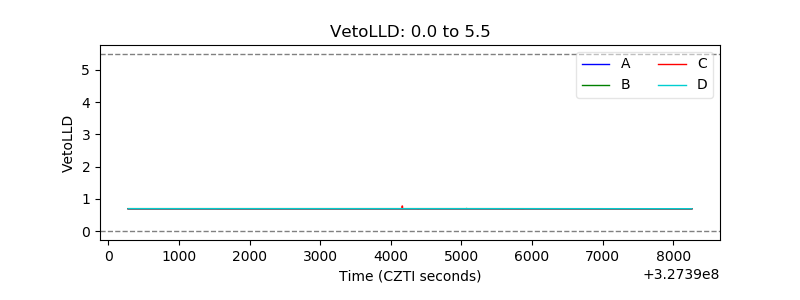 |
| Alpha Counter | 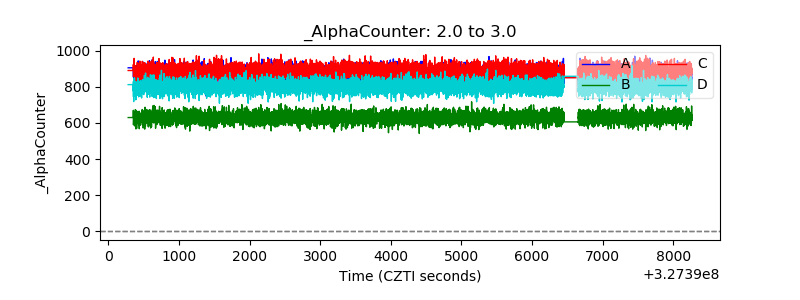 |
| _CPM_Rate | 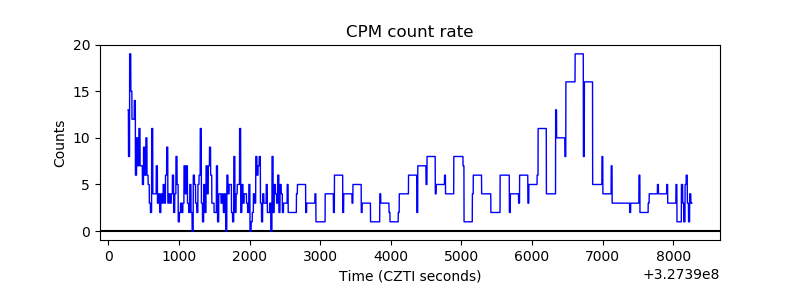 |
| CZT Counter | 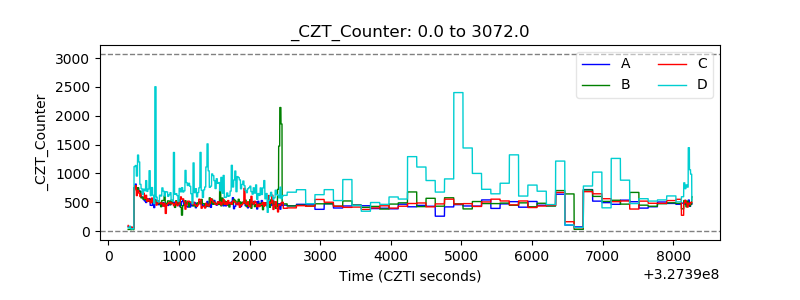 |
| +2.5 Volts monitor |  |
| +5 Volts monitor |  |
| _ROLL_ROT | 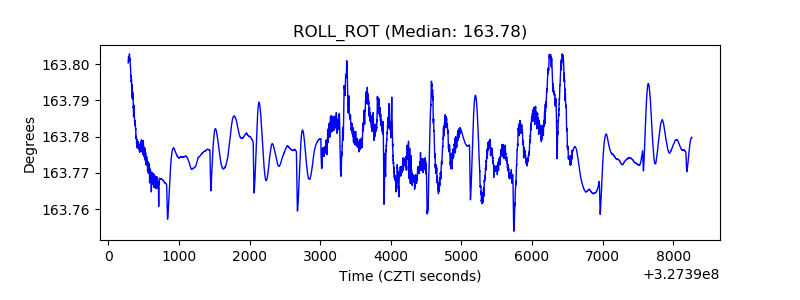 |
| _Roll_DEC | 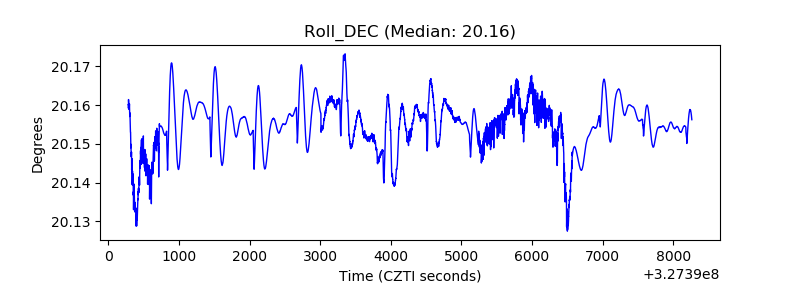 |
| _Roll_RA | 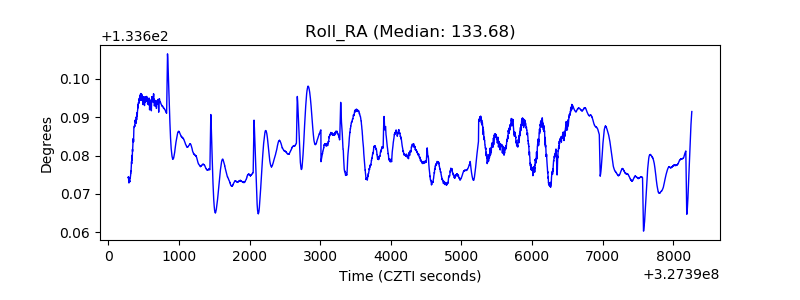 |
| Veto Counter | 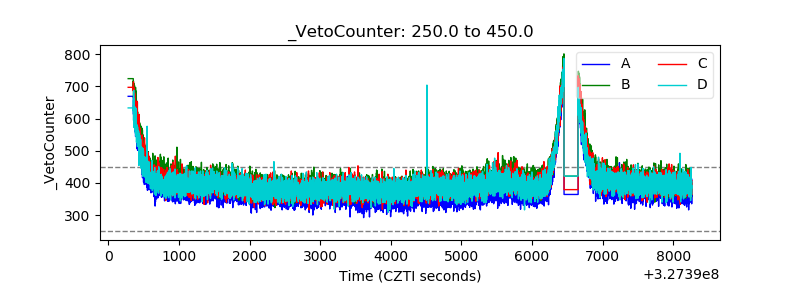 |