| Param | Original file | Final file |
|---|---|---|
| Filename | modeM0/AS1T03_206T01_9000003672_25064cztM0_level2.evt | modeM0/AS1T03_206T01_9000003672_25064cztM0_level2_quad_clean.evt |
| Size (bytes) | 1,443,191,040 | 240,491,520 |
| Size | 1.3 GB | 229.4 MB |
| Events in quadrant A | 8,382,417 | 1,560,520 |
| Events in quadrant B | 9,037,414 | 1,572,815 |
| Events in quadrant C | 8,622,297 | 1,498,437 |
| Events in quadrant D | 16,461,649 | 1,422,313 |
| Mode M9 | |||
|---|---|---|---|
| Quadrant | BADHDUFLAG | Total packets | Discarded packets |
| A | 0 | 18 | 0 |
| B | 0 | 18 | 0 |
| C | 0 | 18 | 0 |
| D | 0 | 18 | 0 |
| Mode SS | |||
|---|---|---|---|
| Quadrant | BADHDUFLAG | Total packets | Discarded packets |
| A | 0 | 362 | 0 |
| B | 0 | 362 | 0 |
| C | 0 | 362 | 0 |
| D | 0 | 362 | 0 |
| Mode M0 | |||
|---|---|---|---|
| Quadrant | BADHDUFLAG | Total packets | Discarded packets |
| A | 0 | 36540 | 3 |
| B | 0 | 38072 | 3 |
| C | 0 | 36682 | 3 |
| D | 0 | 61697 | 3 |
| Quadrant | Total seconds | Saturated seconds | Saturation percentage |
|---|---|---|---|
| A | 17848 | 191 | 1.070148% |
| B | 17849 | 231 | 1.294190% |
| C | 17849 | 266 | 1.490280% |
| D | 17849 | 681 | 3.815340% |
Noise dominated data is calculated using 1-second bins in cleaned event files. If a bin has >2000 counts, and if more than 50% of those come from <1% of pixels, then it is considered to be noise-dominated and hence unusable.
| Quadrant | # 1 sec bins | Bins with >0 counts | Bins with >2000 counts | High rate bins dominated by noise | Noise dominated (total time) | Noise dominated (detector-on time) | Marked lightcurve |
|---|---|---|---|---|---|---|---|
| A | 19628 | 17849 | 4 | 4 | 0.02% | 0.02% | 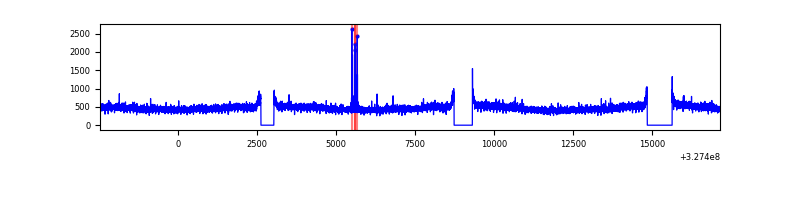 |
| B | 19629 | 17851 | 30 | 30 | 0.15% | 0.17% | 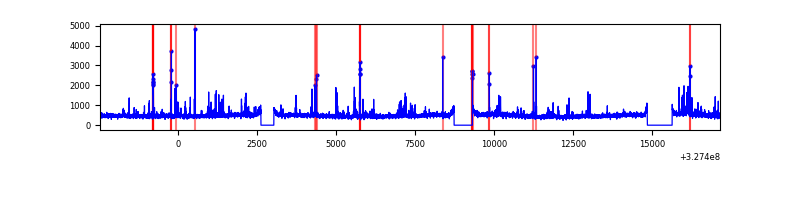 |
| C | 19629 | 17852 | 6 | 6 | 0.03% | 0.03% | 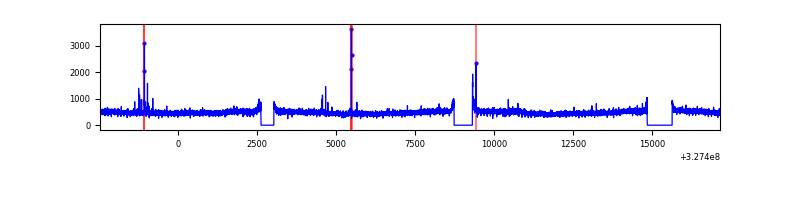 |
| D | 19629 | 17851 | 405 | 405 | 2.06% | 2.27% | 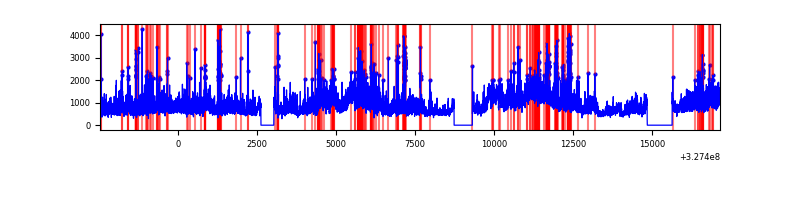 |
Top three noisy pixels from each quadrant. If the there are fewer than three noisy pixels in the level2.evt file, extra rows are filled as -1
| Pixel properties | Quadrant properties | ||||||
|---|---|---|---|---|---|---|---|
| Quadrant | DetID | PixID | Counts | Sigma | Mean | Median | Sigma |
| A | 2 | 79 | 38757 | 84.25 | 2158 | 2109 | 435.0 |
| A | 13 | 254 | 30789 | 65.94 | 2158 | 2109 | 435.0 |
| A | 13 | 34 | 23354 | 48.84 | 2158 | 2109 | 435.0 |
| B | 5 | 172 | 173680 | 421.73 | 2146 | 2091 | 406.9 |
| B | 0 | 190 | 149451 | 362.18 | 2146 | 2091 | 406.9 |
| B | 4 | 80 | 92348 | 221.83 | 2146 | 2091 | 406.9 |
| C | 14 | 238 | 325736 | 674.37 | 2062 | 2075 | 479.9 |
| C | 7 | 247 | 130151 | 266.85 | 2062 | 2075 | 479.9 |
| C | 3 | 233 | 56961 | 114.36 | 2062 | 2075 | 479.9 |
| D | 8 | 195 | 4029083 | 8035.23 | 2072 | 2009 | 501.2 |
| D | 1 | 52 | 2101773 | 4189.66 | 2072 | 2009 | 501.2 |
| D | 1 | 3 | 932210 | 1856.03 | 2072 | 2009 | 501.2 |
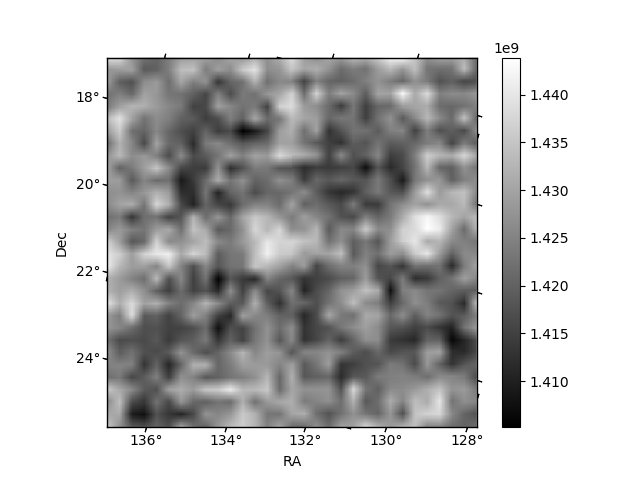
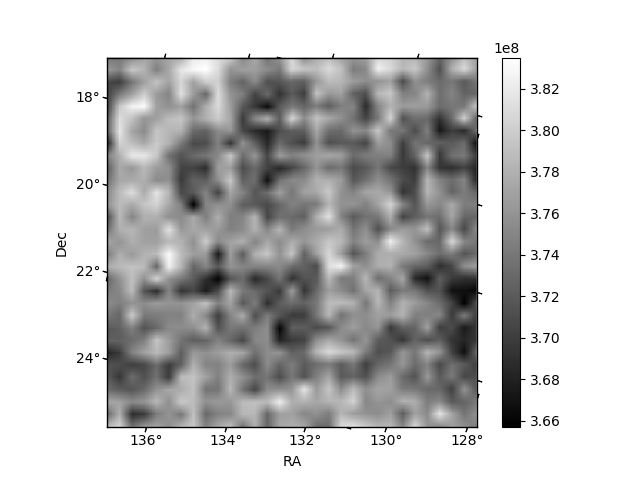
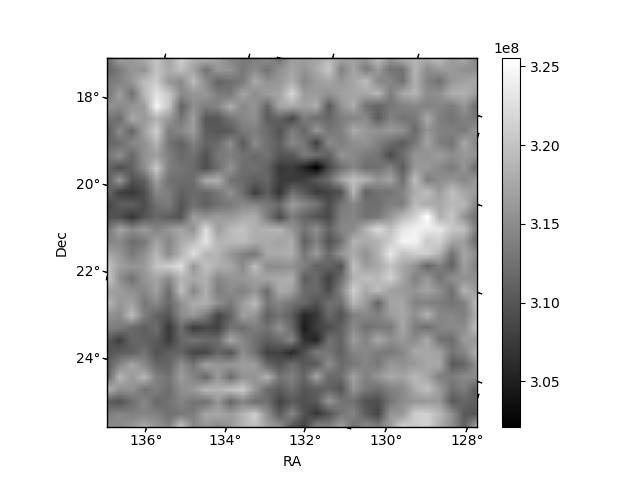
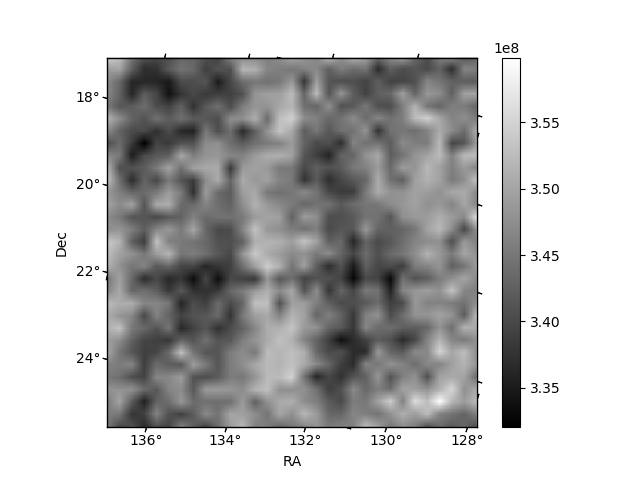
Histogram calculated using DETX and DETY for each event in the final _common_clean file
| Quadrant A | 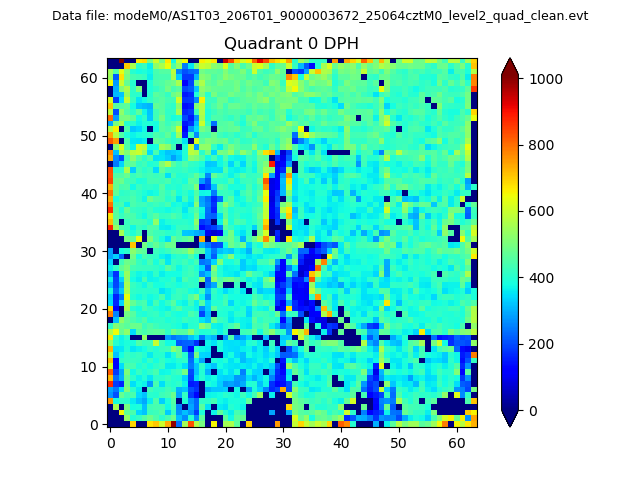 |
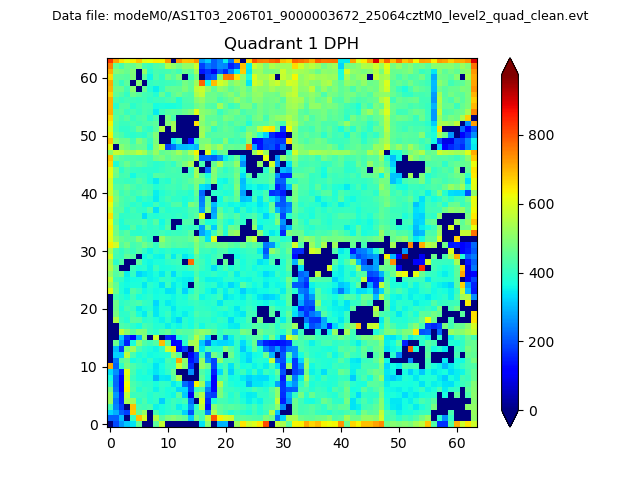 |
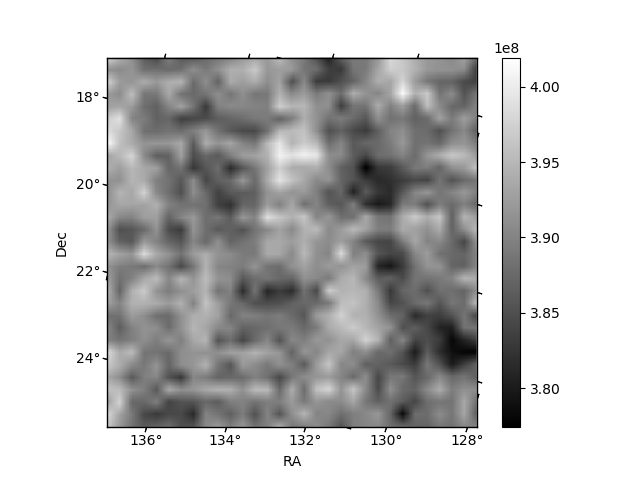
Quadrant B |
|---|---|---|---|
| Quadrant D | 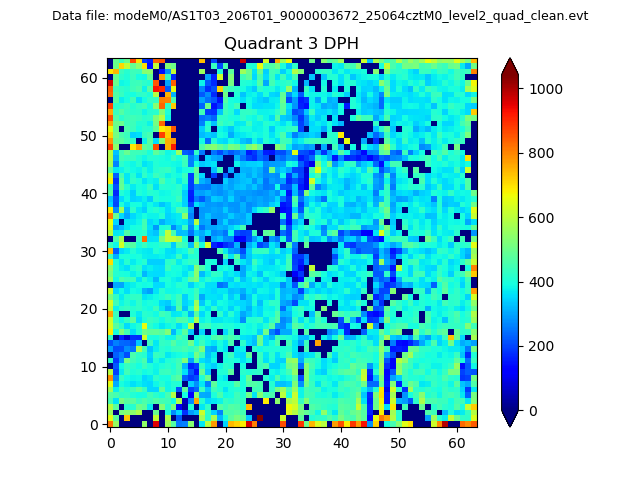 |
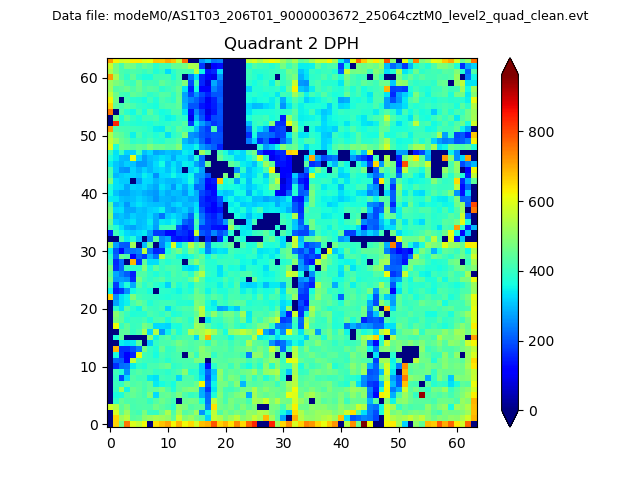 |
Quadrant C |
| Plot type | Count rate plots | Images |
|---|---|---|
| Comparison with Poisson distribution Blue bars denote a histogram of data divided into 1 sec bins. Red curve is a Poisson curve with rate = median count rate of data. |
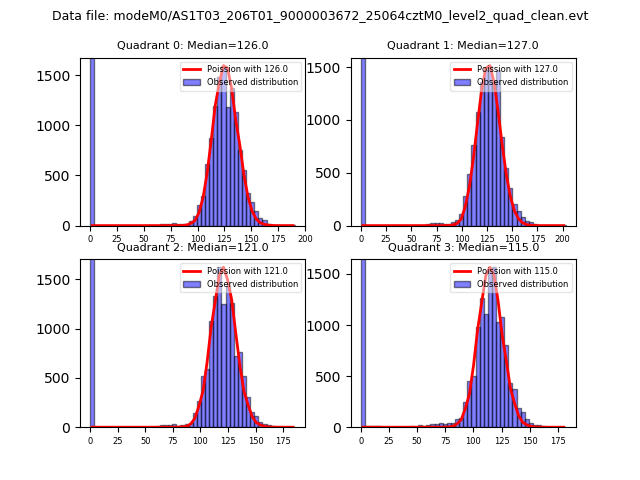 |
 |
| Quadrant-wise count rates Data is divided into 100 sec bins |
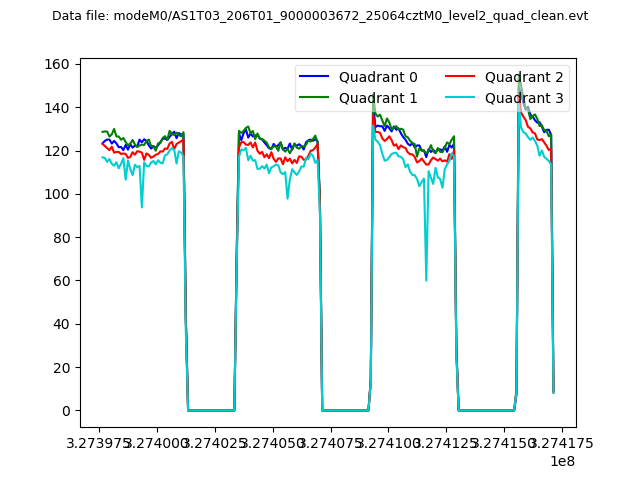 |
|
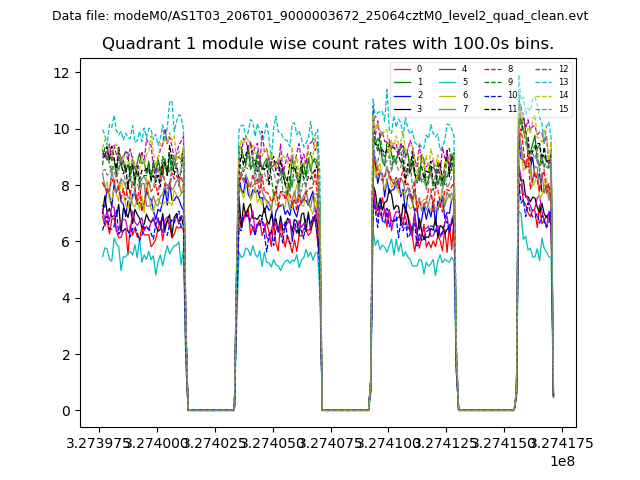
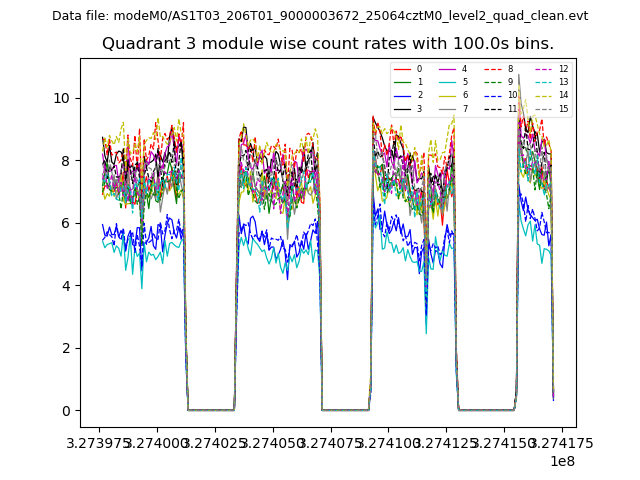
| Module-wise count rates for Quadrant A Data is divided into 100 sec bins |
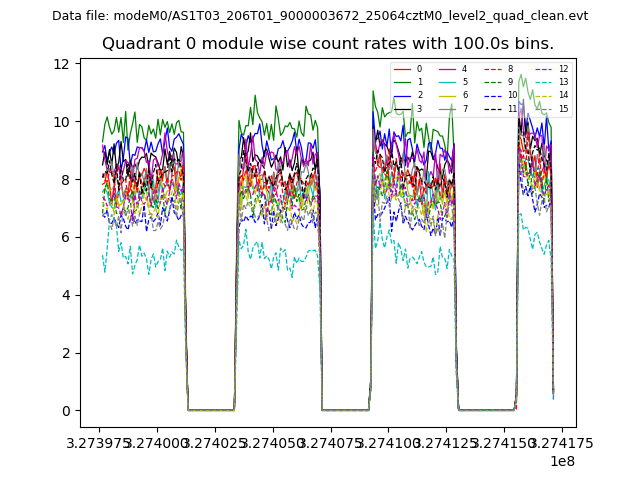 |
 |
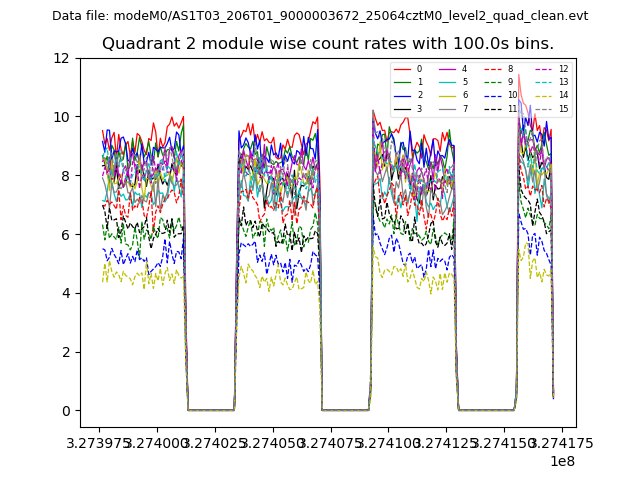
| Module-wise count rates for Quadrant B Data is divided into 100 sec bins |
 |
 |
| Module-wise count rates for Quadrant C Data is divided into 100 sec bins |
 |
 |
| Module-wise count rates for Quadrant D Data is divided into 100 sec bins |
 |
 |
| Parameter | Plot |
|---|---|
| CZT HV Monitor | 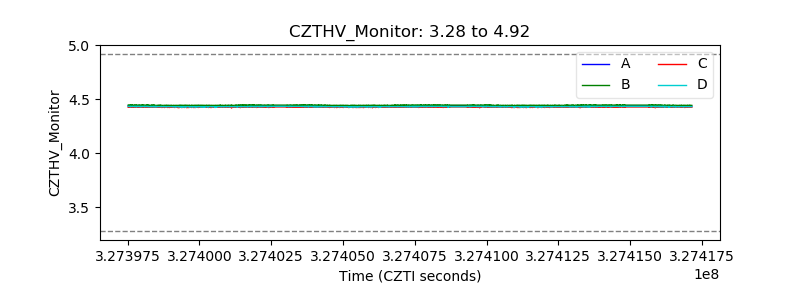 |
| D_VDD | 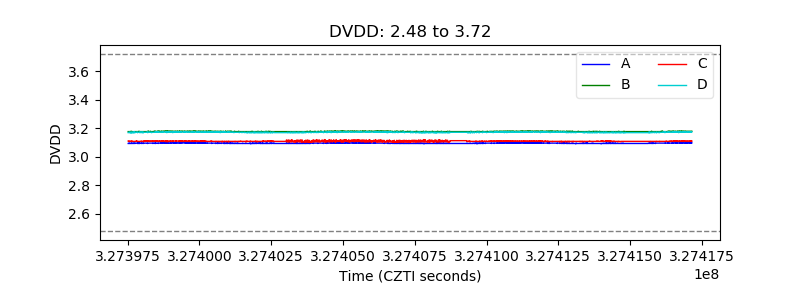 |
| Temperature 1 | 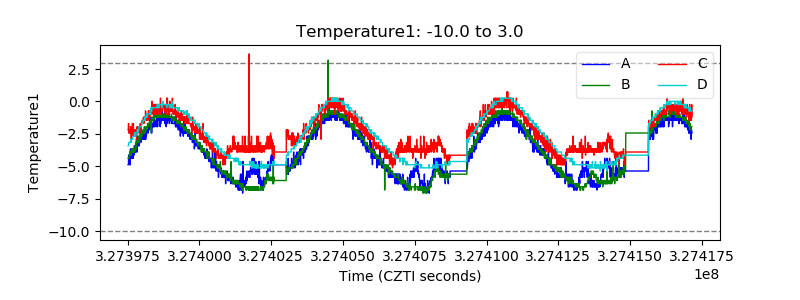 |
| Veto HV Monitor |  |
| Veto LLD | 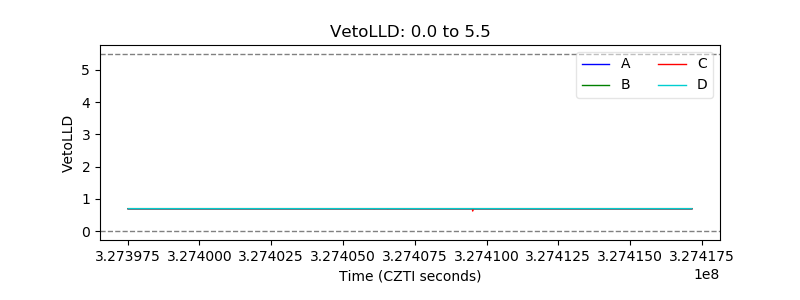 |
| Alpha Counter | 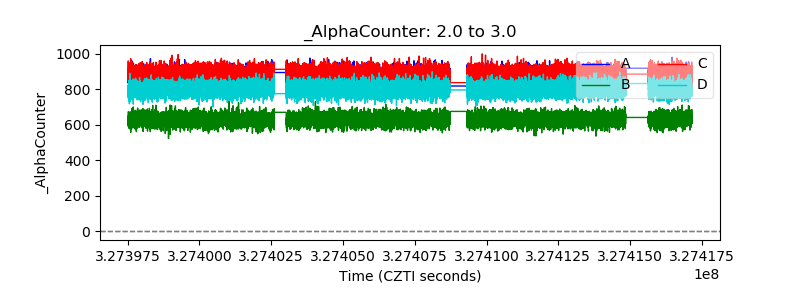 |
| _CPM_Rate | 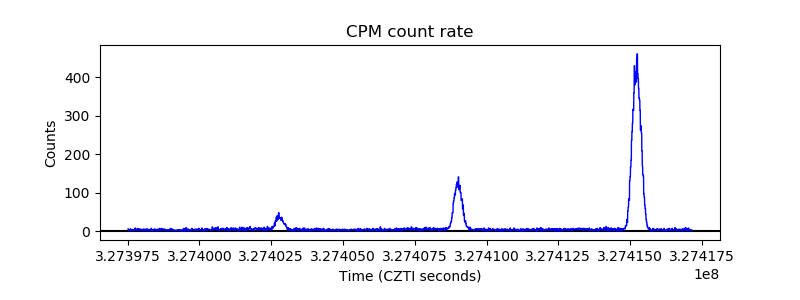 |
| CZT Counter | 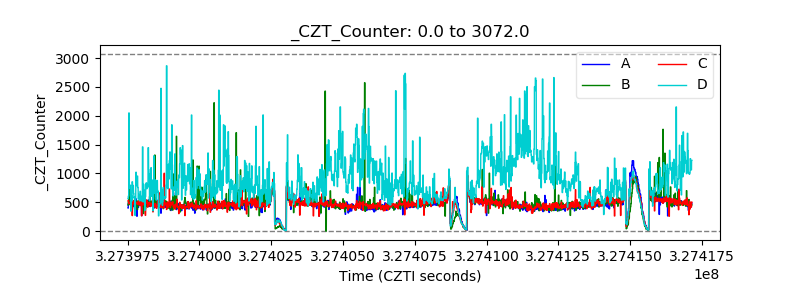 |
| +2.5 Volts monitor |  |
| +5 Volts monitor | 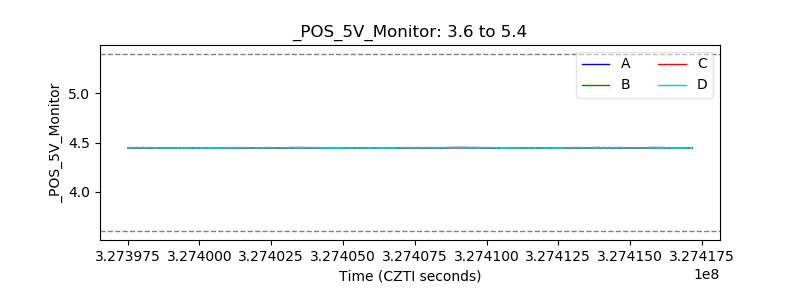 |
| _ROLL_ROT | 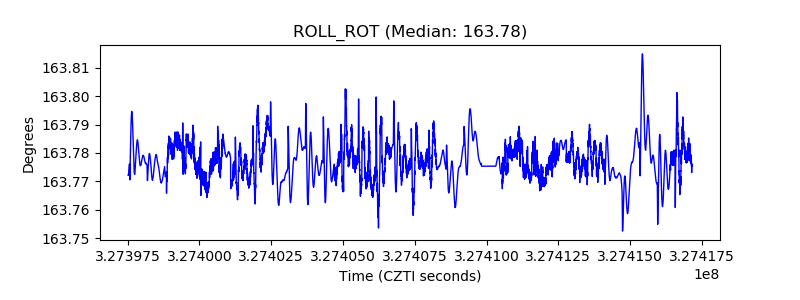 |
| _Roll_DEC | 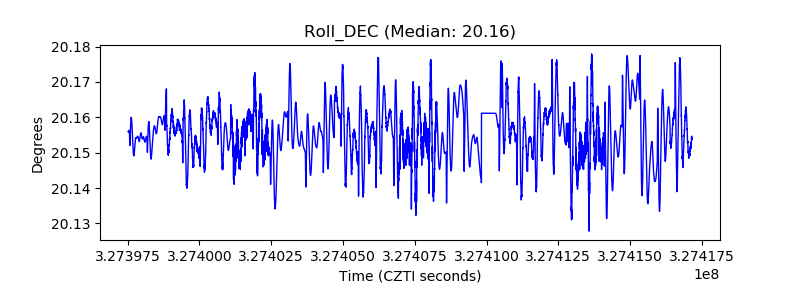 |
| _Roll_RA | 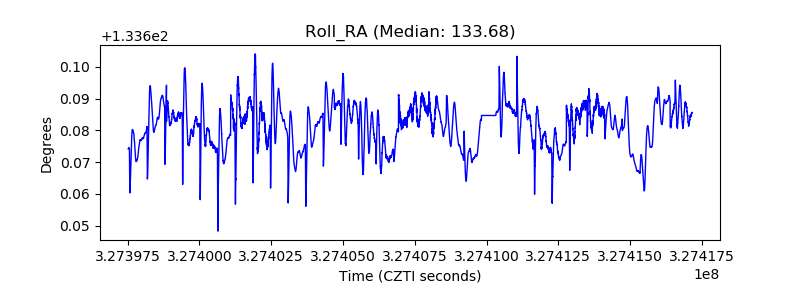 |
| Veto Counter | 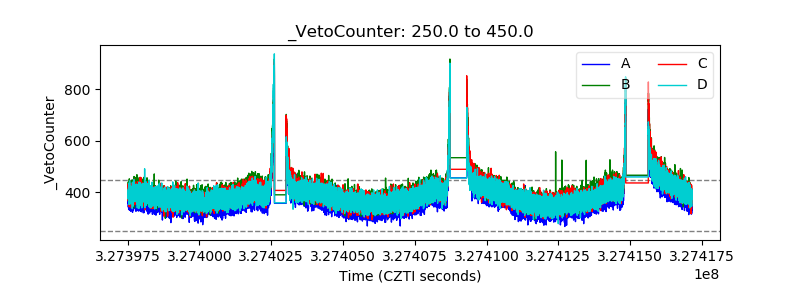 |