| Param | Original file | Final file |
|---|---|---|
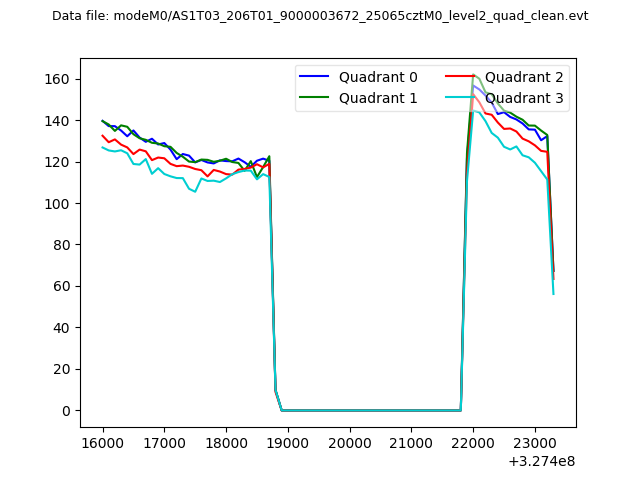
| Filename | modeM0/AS1T03_206T01_9000003672_25065cztM0_level2.evt | modeM0/AS1T03_206T01_9000003672_25065cztM0_level2_quad_clean.evt |
| Size (bytes) | 616,443,840 | 86,008,320 |
| Size | 587.9 MB | 82.0 MB |
| Events in quadrant A | 3,032,046 | 556,985 |
| Events in quadrant B | 3,519,562 | 559,950 |
| Events in quadrant C | 3,154,340 | 532,340 |
| Events in quadrant D | 8,528,973 | 507,338 |
| Mode M9 | |||
|---|---|---|---|
| Quadrant | BADHDUFLAG | Total packets | Discarded packets |
| A | 0 | 9 | 0 |
| B | 0 | 9 | 0 |
| C | 0 | 9 | 0 |
| D | 0 | 9 | 0 |
| Mode SS | |||
|---|---|---|---|
| Quadrant | BADHDUFLAG | Total packets | Discarded packets |
| A | 0 | 130 | 0 |
| B | 0 | 130 | 0 |
| C | 0 | 130 | 0 |
| D | 0 | 130 | 0 |
| Mode M0 | |||
|---|---|---|---|
| Quadrant | BADHDUFLAG | Total packets | Discarded packets |
| A | 0 | 13239 | 1 |
| B | 0 | 14556 | 1 |
| C | 0 | 13348 | 2 |
| D | 0 | 29882 | 1 |
| Quadrant | Total seconds | Saturated seconds | Saturation percentage |
|---|---|---|---|
| A | 6420 | 44 | 0.685358% |
| B | 6420 | 80 | 1.246106% |
| C | 6419 | 73 | 1.137249% |
| D | 6419 | 1105 | 17.214519% |
Noise dominated data is calculated using 1-second bins in cleaned event files. If a bin has >2000 counts, and if more than 50% of those come from <1% of pixels, then it is considered to be noise-dominated and hence unusable.
| Quadrant | # 1 sec bins | Bins with >0 counts | Bins with >2000 counts | High rate bins dominated by noise | Noise dominated (total time) | Noise dominated (detector-on time) | Marked lightcurve |
|---|---|---|---|---|---|---|---|
| A | 7355 | 6420 | 0 | 0 | 0.00% | 0.00% | 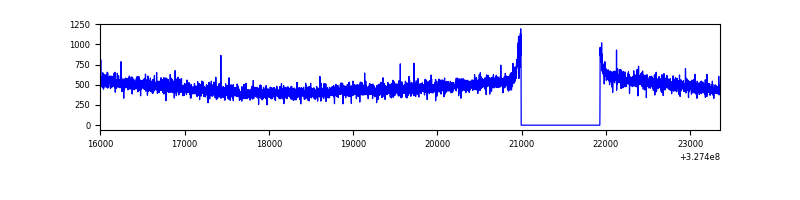 |
| B | 7355 | 6421 | 15 | 15 | 0.20% | 0.23% | 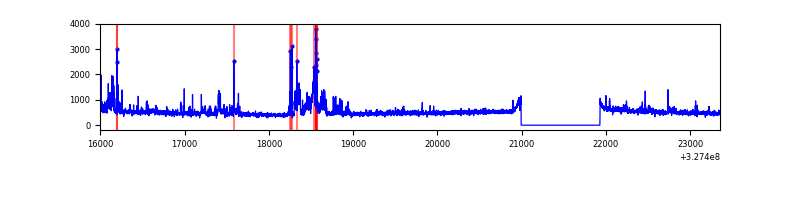 |
| C | 7354 | 6420 | 0 | 0 | 0.00% | 0.00% | 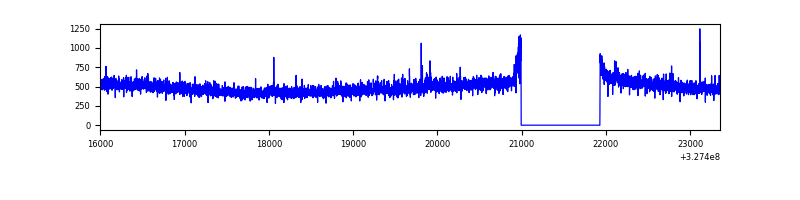 |
| D | 7354 | 6419 | 1010 | 1010 | 13.73% | 15.73% | 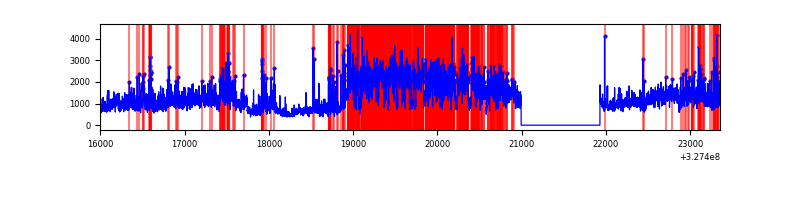 |
Top three noisy pixels from each quadrant. If the there are fewer than three noisy pixels in the level2.evt file, extra rows are filled as -1
| Pixel properties | Quadrant properties | ||||||
|---|---|---|---|---|---|---|---|
| Quadrant | DetID | PixID | Counts | Sigma | Mean | Median | Sigma |
| A | 13 | 254 | 11396 | 67.2 | 784 | 767 | 158.2 |
| A | 3 | 137 | 6980 | 39.28 | 784 | 767 | 158.2 |
| A | 0 | 226 | 6916 | 38.88 | 784 | 767 | 158.2 |
| B | 6 | 36 | 242105 | 1607.18 | 779 | 758 | 150.2 |
| B | 0 | 190 | 96523 | 637.72 | 779 | 758 | 150.2 |
| B | 3 | 64 | 61620 | 405.29 | 779 | 758 | 150.2 |
| C | 14 | 238 | 118531 | 668.38 | 749 | 754 | 176.2 |
| C | 7 | 247 | 79086 | 444.53 | 749 | 754 | 176.2 |
| C | 3 | 233 | 26726 | 147.39 | 749 | 754 | 176.2 |
| D | 9 | 35 | 2541249 | 14150.01 | 734 | 713 | 179.5 |
| D | 8 | 195 | 1660021 | 9241.84 | 734 | 713 | 179.5 |
| D | 1 | 52 | 999955 | 5565.47 | 734 | 713 | 179.5 |
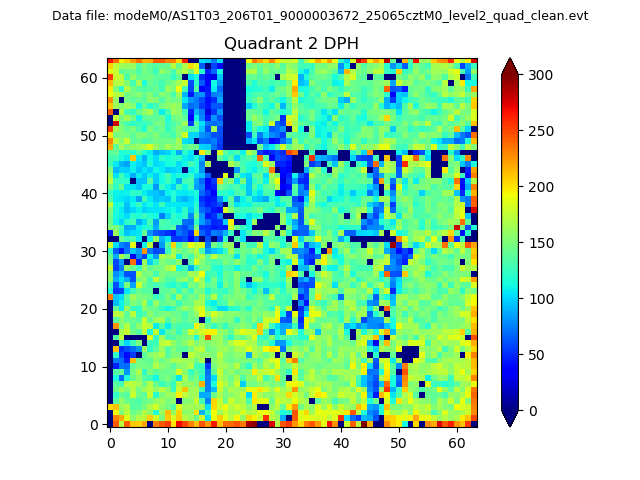
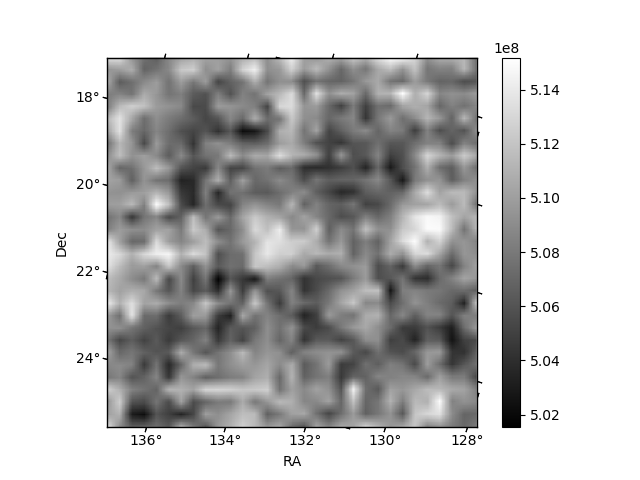
Histogram calculated using DETX and DETY for each event in the final _common_clean file
| Quadrant A | 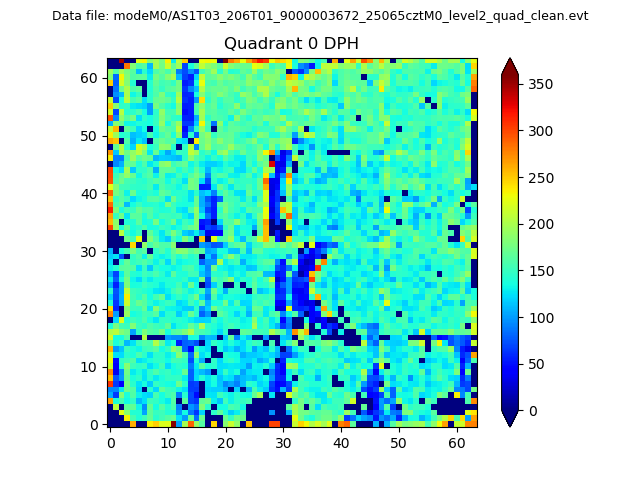 |
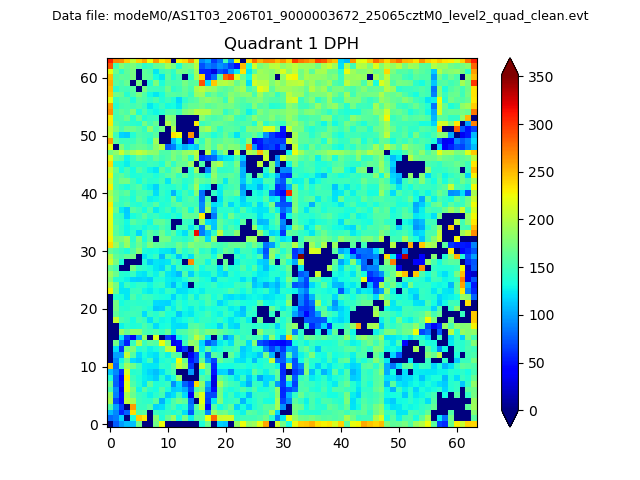 |
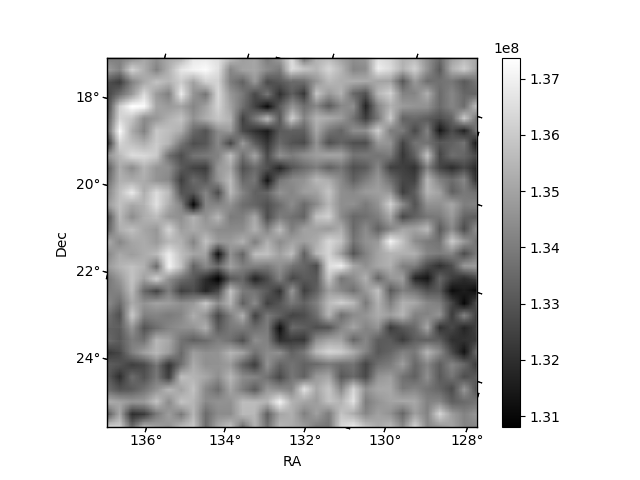
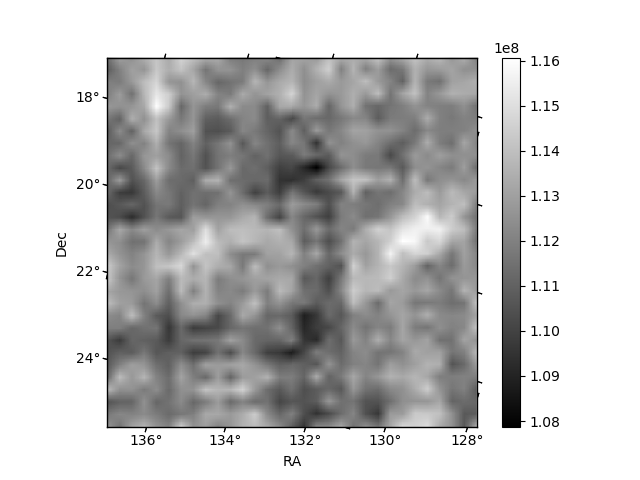
Quadrant B |
|---|---|---|---|
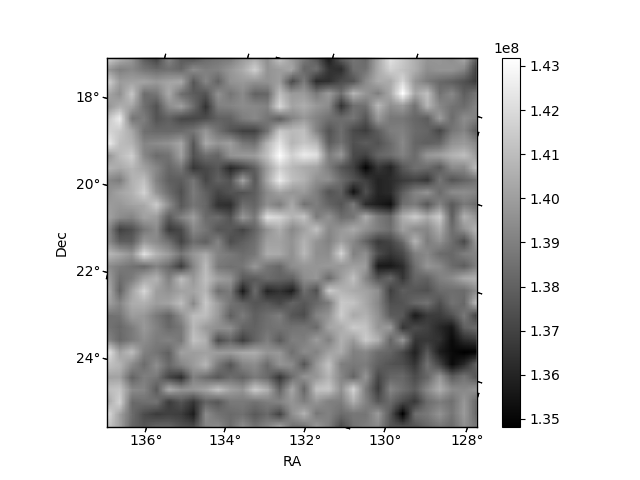
| Quadrant D | 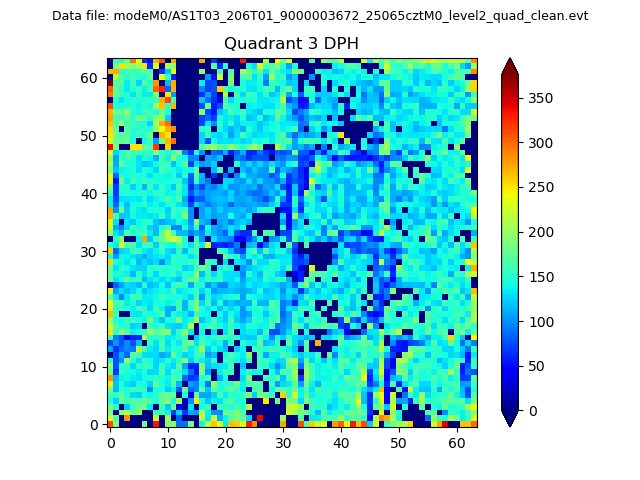 |
 |
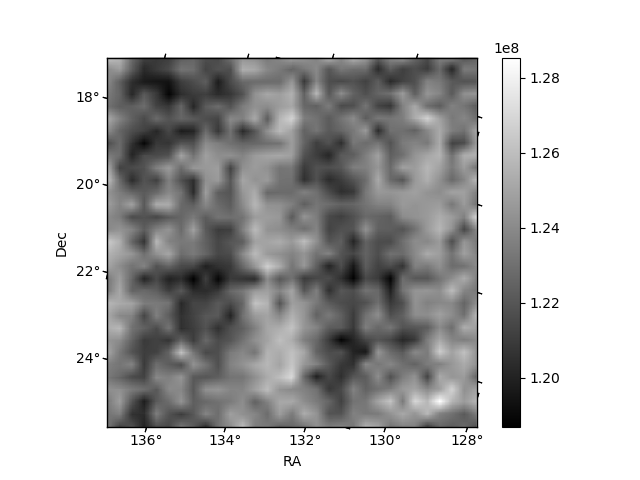
Quadrant C |
| Plot type | Count rate plots | Images |
|---|---|---|
| Comparison with Poisson distribution Blue bars denote a histogram of data divided into 1 sec bins. Red curve is a Poisson curve with rate = median count rate of data. |
 |
 |
| Quadrant-wise count rates Data is divided into 100 sec bins |
 |
|
| Module-wise count rates for Quadrant A Data is divided into 100 sec bins |
 |
 |
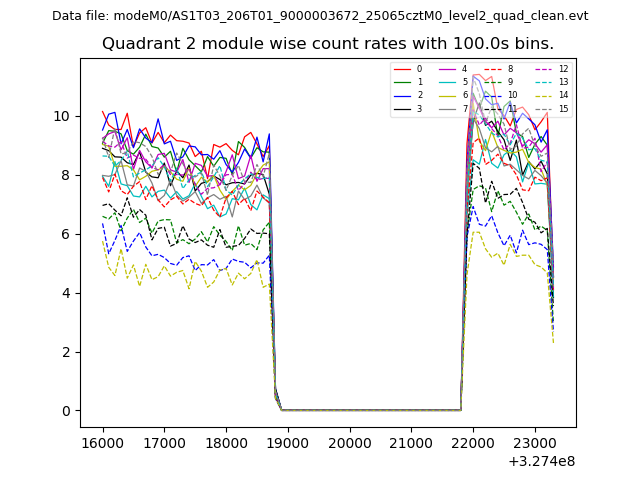
| Module-wise count rates for Quadrant B Data is divided into 100 sec bins |
 |
 |
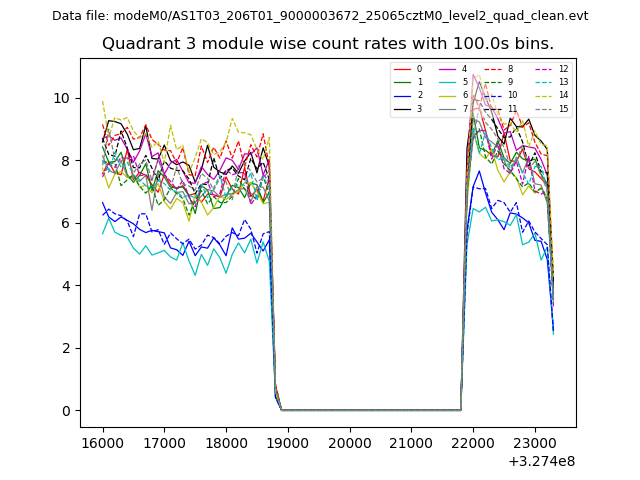
| Module-wise count rates for Quadrant C Data is divided into 100 sec bins |
 |
 |
| Module-wise count rates for Quadrant D Data is divided into 100 sec bins |
 |
 |
| Parameter | Plot |
|---|---|
| CZT HV Monitor |  |
| D_VDD | 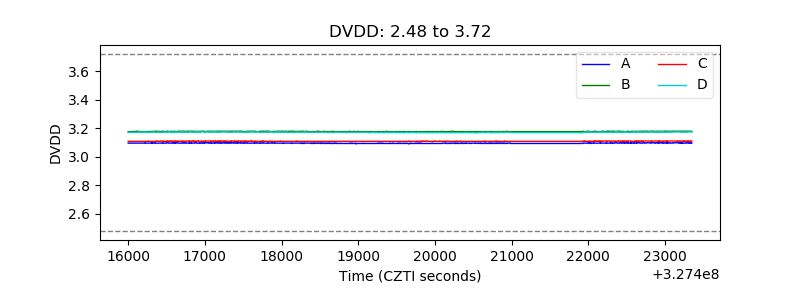 |
| Temperature 1 | 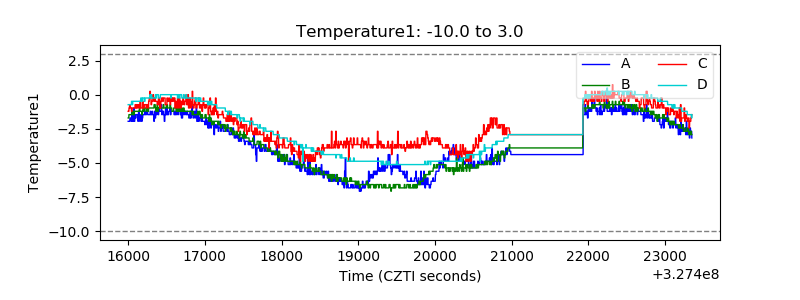 |
| Veto HV Monitor |  |
| Veto LLD | 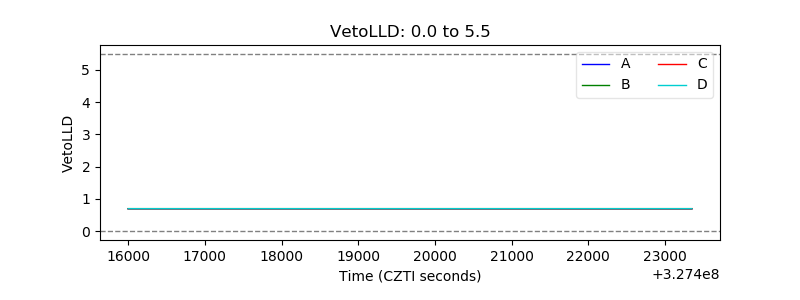 |
| Alpha Counter | 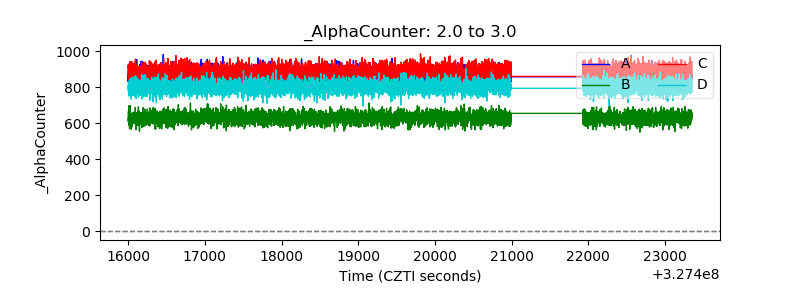 |
| _CPM_Rate | 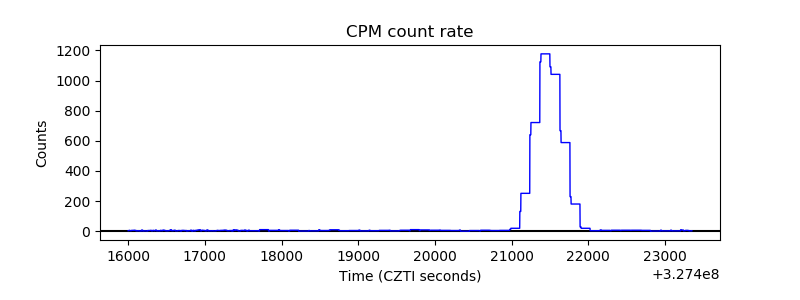 |
| CZT Counter | 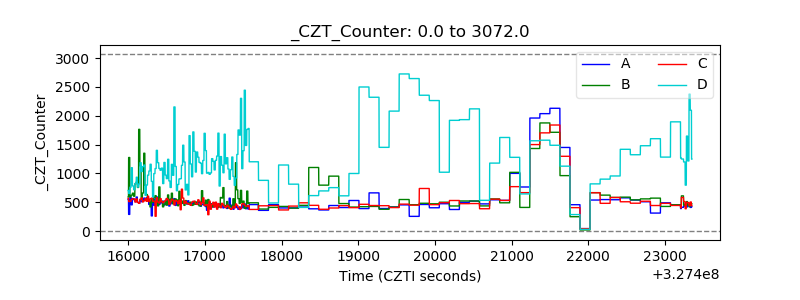 |
| +2.5 Volts monitor |  |
| +5 Volts monitor |  |
| _ROLL_ROT | 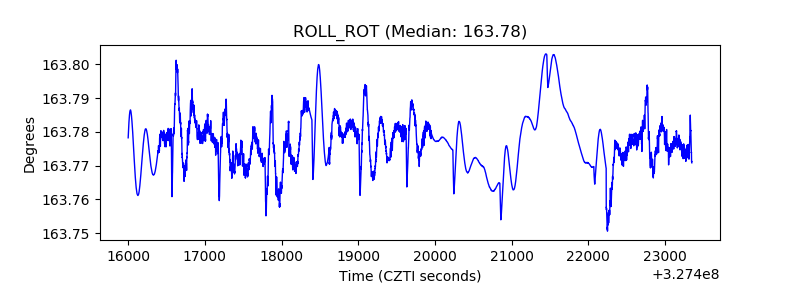 |
| _Roll_DEC | 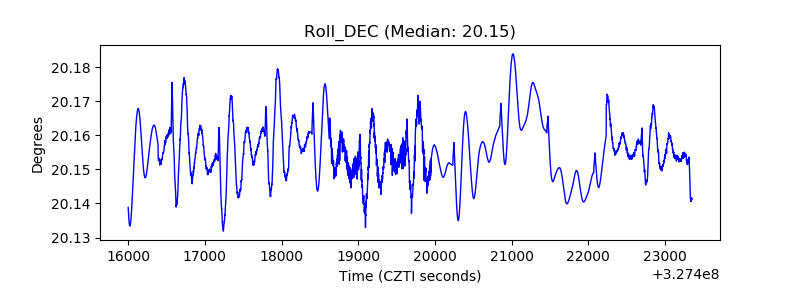 |
| _Roll_RA | 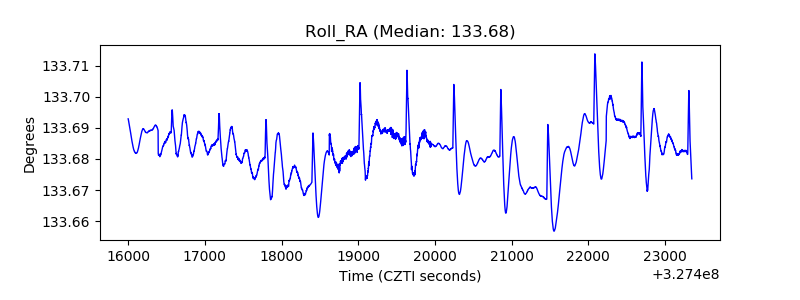 |
| Veto Counter | 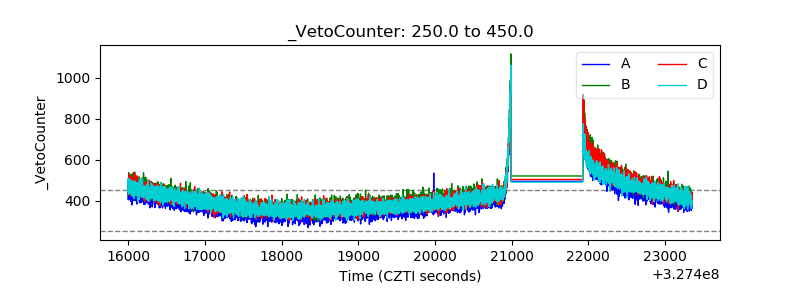 |