| Param | Original file | Final file |
|---|---|---|
| Filename | modeM0/AS1T03_206T01_9000003672_25067cztM0_level2.evt | modeM0/AS1T03_206T01_9000003672_25067cztM0_level2_quad_clean.evt |
| Size (bytes) | 548,608,320 | 87,076,800 |
| Size | 523.2 MB | 83.0 MB |
| Events in quadrant A | 3,012,647 | 572,070 |
| Events in quadrant B | 3,294,112 | 580,180 |
| Events in quadrant C | 3,178,121 | 543,926 |
| Events in quadrant D | 6,703,098 | 500,945 |
| Mode M9 | |||
|---|---|---|---|
| Quadrant | BADHDUFLAG | Total packets | Discarded packets |
| A | 0 | 11 | 0 |
| B | 0 | 11 | 0 |
| C | 0 | 11 | 0 |
| D | 0 | 11 | 0 |
| Mode SS | |||
|---|---|---|---|
| Quadrant | BADHDUFLAG | Total packets | Discarded packets |
| A | 0 | 128 | 0 |
| B | 0 | 128 | 0 |
| C | 0 | 128 | 0 |
| D | 0 | 128 | 0 |
| Mode M0 | |||
|---|---|---|---|
| Quadrant | BADHDUFLAG | Total packets | Discarded packets |
| A | 0 | 13095 | 1 |
| B | 0 | 13840 | 1 |
| C | 0 | 13448 | 1 |
| D | 0 | 24407 | 1 |
| Quadrant | Total seconds | Saturated seconds | Saturation percentage |
|---|---|---|---|
| A | 6299 | 21 | 0.333386% |
| B | 6300 | 43 | 0.682540% |
| C | 6300 | 66 | 1.047619% |
| D | 6300 | 549 | 8.714286% |
Noise dominated data is calculated using 1-second bins in cleaned event files. If a bin has >2000 counts, and if more than 50% of those come from <1% of pixels, then it is considered to be noise-dominated and hence unusable.
| Quadrant | # 1 sec bins | Bins with >0 counts | Bins with >2000 counts | High rate bins dominated by noise | Noise dominated (total time) | Noise dominated (detector-on time) | Marked lightcurve |
|---|---|---|---|---|---|---|---|
| A | 7409 | 6300 | 0 | 0 | 0.00% | 0.00% |  |
| B | 7410 | 6301 | 12 | 12 | 0.16% | 0.19% |  |
| C | 7410 | 6301 | 11 | 11 | 0.15% | 0.17% |  |
| D | 7410 | 6301 | 441 | 441 | 5.95% | 7.00% |  |
Top three noisy pixels from each quadrant. If the there are fewer than three noisy pixels in the level2.evt file, extra rows are filled as -1
| Pixel properties | Quadrant properties | ||||||
|---|---|---|---|---|---|---|---|
| Quadrant | DetID | PixID | Counts | Sigma | Mean | Median | Sigma |
| A | 13 | 254 | 11077 | 65.74 | 779 | 763 | 156.9 |
| A | 0 | 226 | 6870 | 38.92 | 779 | 763 | 156.9 |
| A | 3 | 137 | 6782 | 38.36 | 779 | 763 | 156.9 |
| B | 5 | 172 | 91918 | 621.51 | 779 | 758 | 146.7 |
| B | 0 | 190 | 76165 | 514.1 | 779 | 758 | 146.7 |
| B | 3 | 64 | 28268 | 187.55 | 779 | 758 | 146.7 |
| C | 14 | 238 | 117523 | 667.75 | 748 | 754 | 174.9 |
| C | 7 | 247 | 58832 | 332.12 | 748 | 754 | 174.9 |
| C | 0 | 207 | 47323 | 266.31 | 748 | 754 | 174.9 |
| D | 8 | 195 | 1595623 | 8918.52 | 739 | 719 | 178.8 |
| D | 1 | 52 | 1062978 | 5940.03 | 739 | 719 | 178.8 |
| D | 9 | 35 | 458177 | 2558.05 | 739 | 719 | 178.8 |
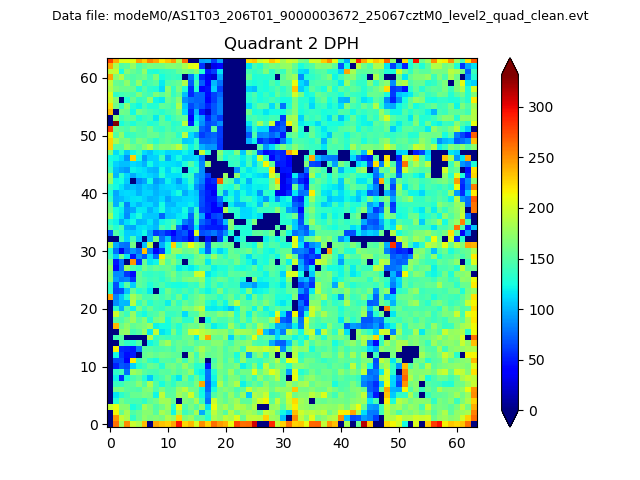
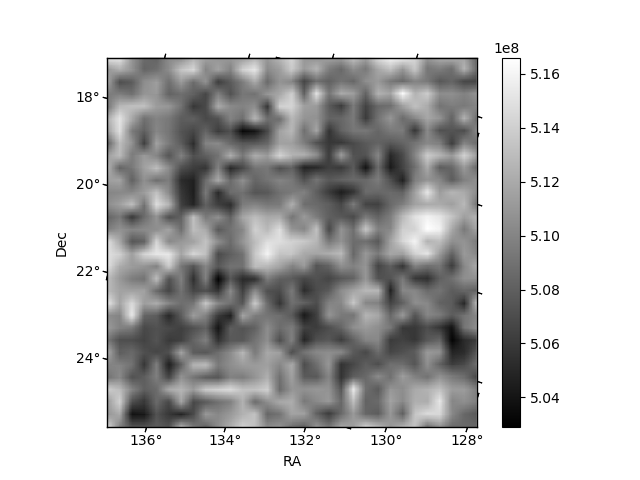
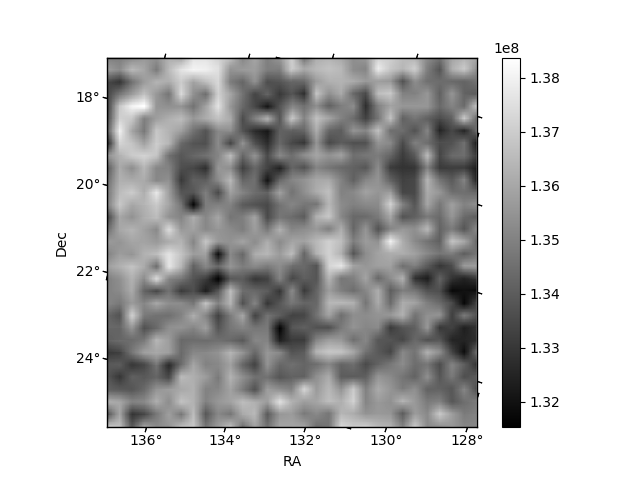
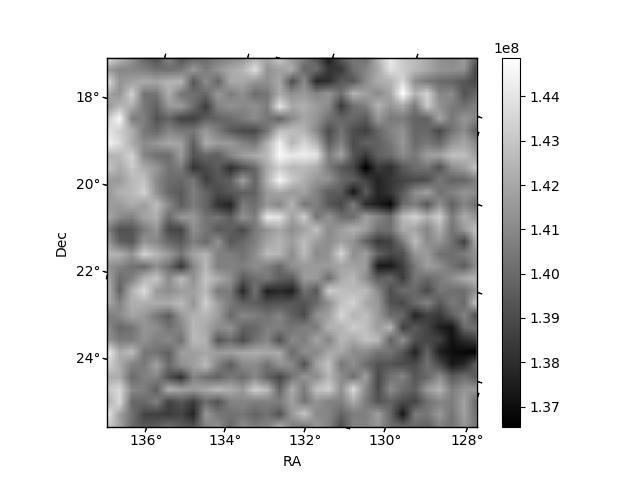
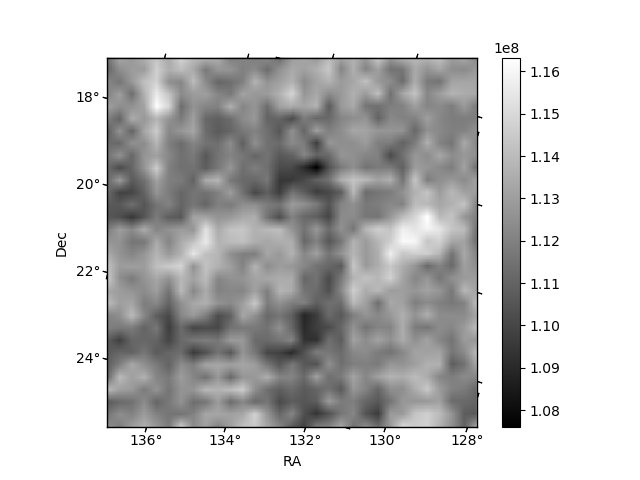
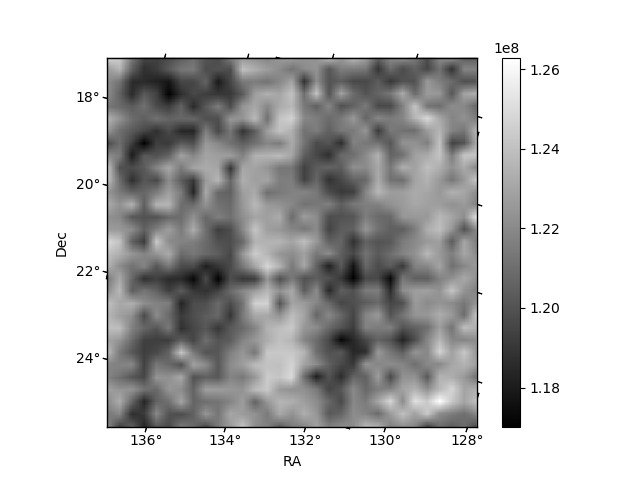
Histogram calculated using DETX and DETY for each event in the final _common_clean file
| Quadrant A | 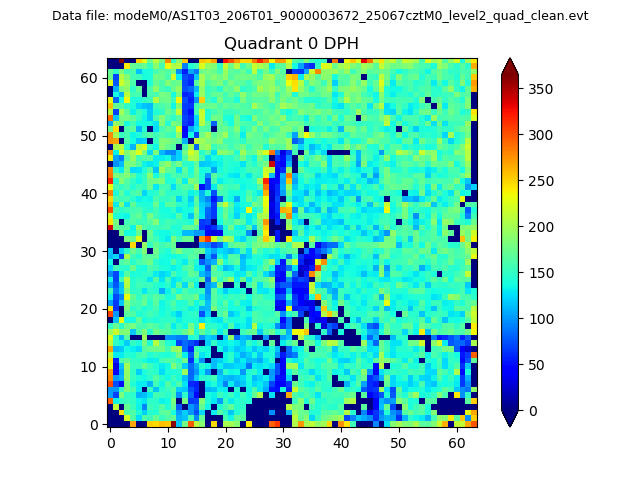 |
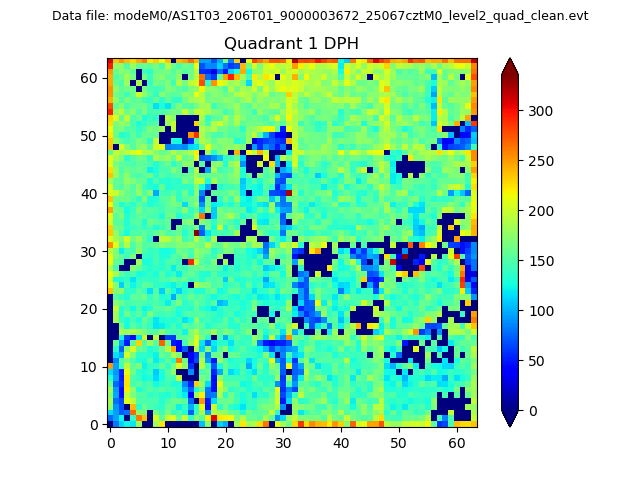 |
Quadrant B |
|---|---|---|---|
| Quadrant D | 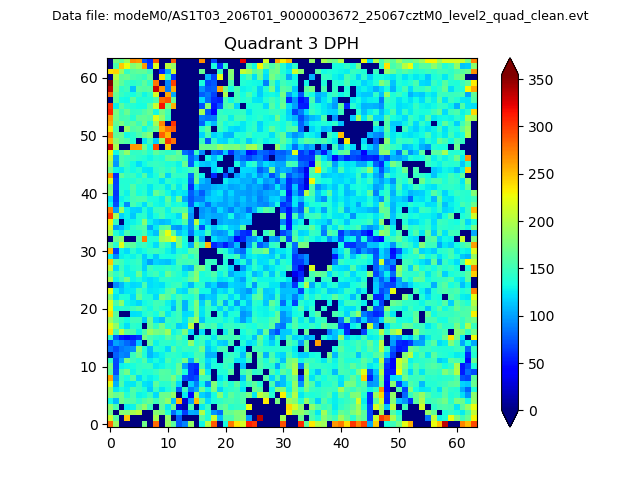 |
 |
Quadrant C |
| Plot type | Count rate plots | Images |
|---|---|---|
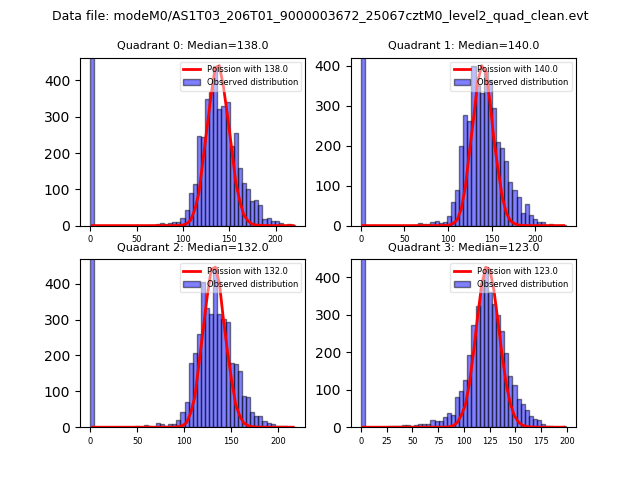
| Comparison with Poisson distribution Blue bars denote a histogram of data divided into 1 sec bins. Red curve is a Poisson curve with rate = median count rate of data. |
 |
 |
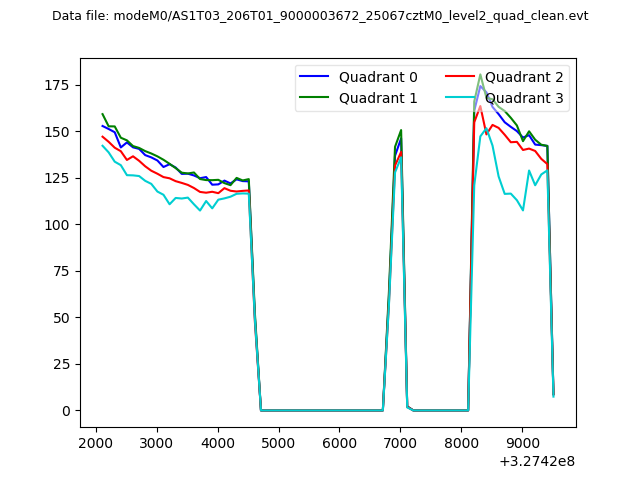
| Quadrant-wise count rates Data is divided into 100 sec bins |
 |
|
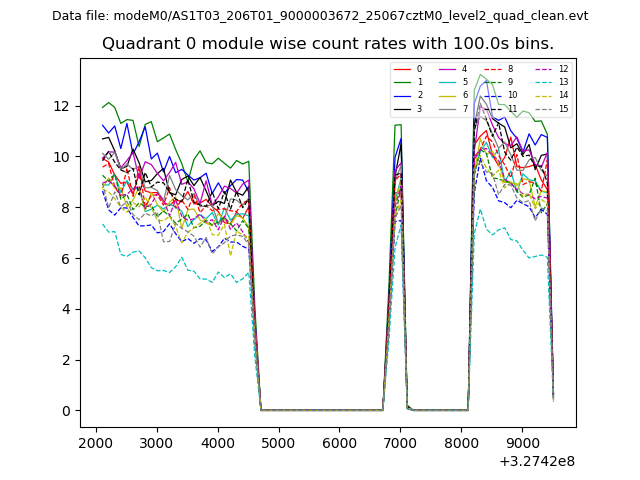
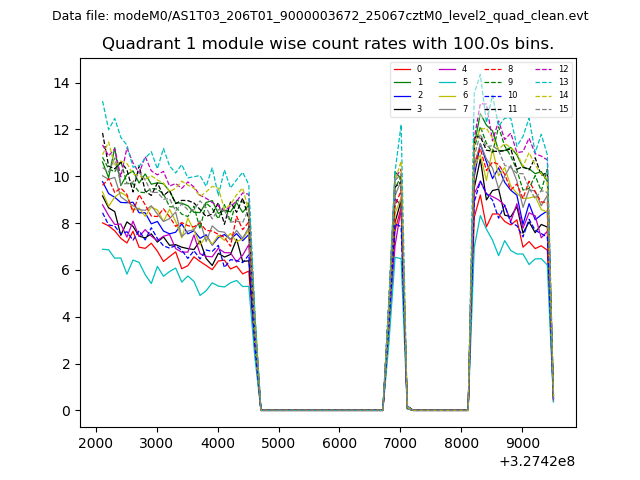
| Module-wise count rates for Quadrant A Data is divided into 100 sec bins |
 |
 |
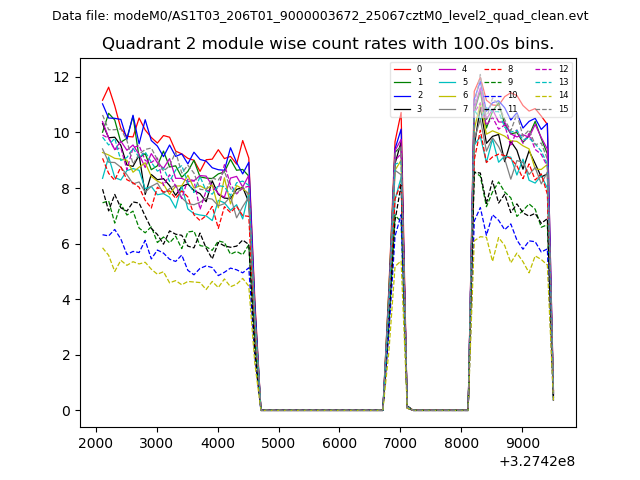
| Module-wise count rates for Quadrant B Data is divided into 100 sec bins |
 |
 |
| Module-wise count rates for Quadrant C Data is divided into 100 sec bins |
 |
 |
| Module-wise count rates for Quadrant D Data is divided into 100 sec bins |
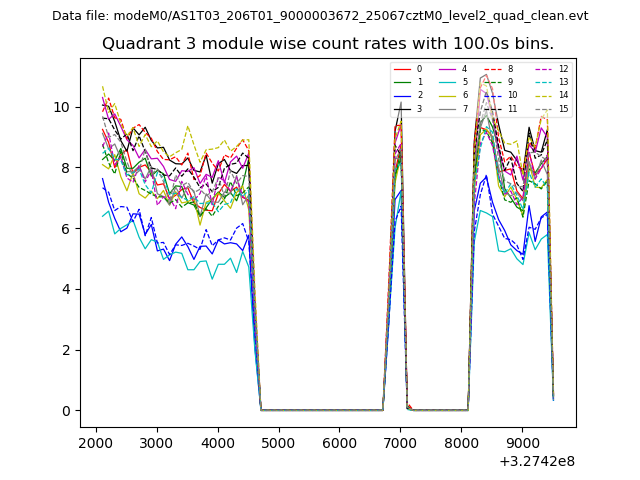 |
 |
| Parameter | Plot |
|---|---|
| CZT HV Monitor | 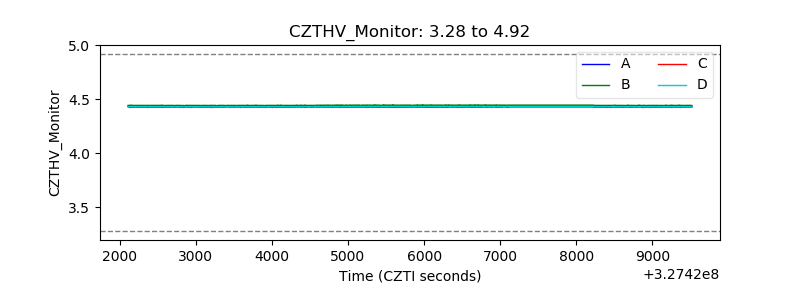 |
| D_VDD | 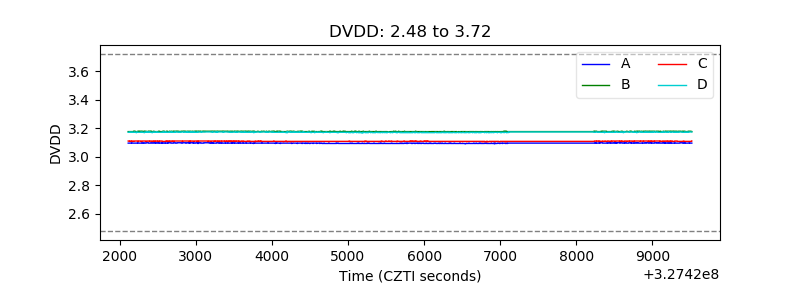 |
| Temperature 1 | 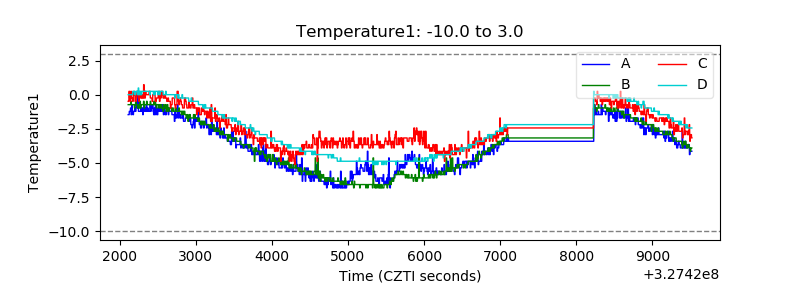 |
| Veto HV Monitor | 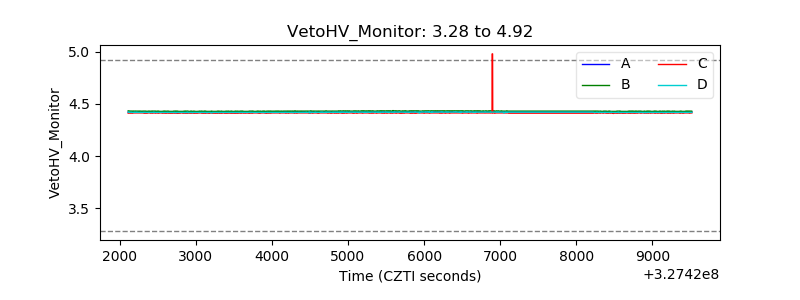 |
| Veto LLD | 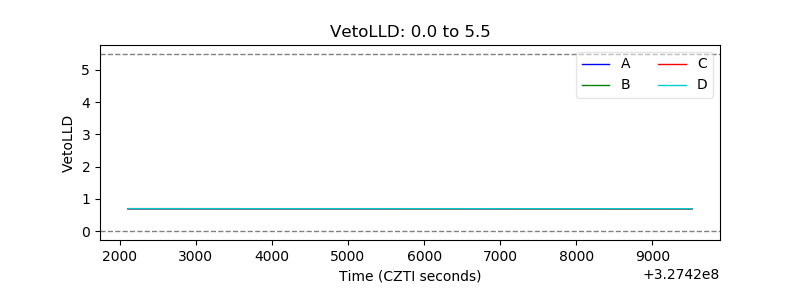 |
| Alpha Counter | 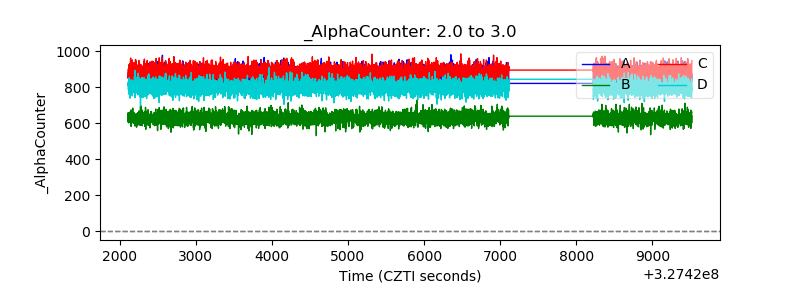 |
| _CPM_Rate | 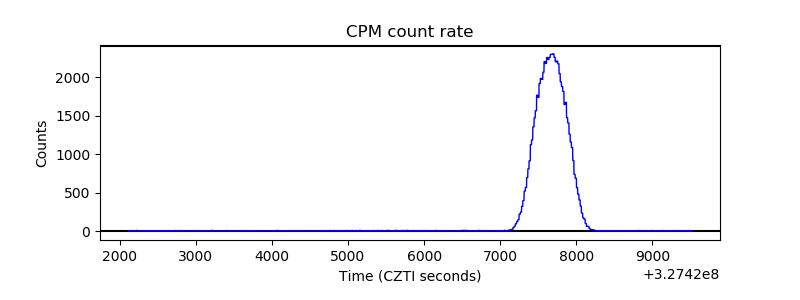 |
| CZT Counter | 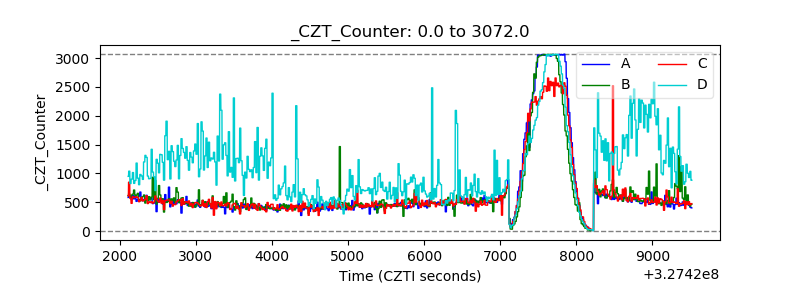 |
| +2.5 Volts monitor |  |
| +5 Volts monitor |  |
| _ROLL_ROT | 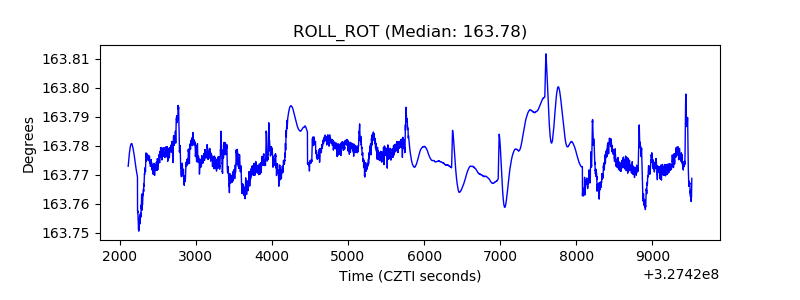 |
| _Roll_DEC | 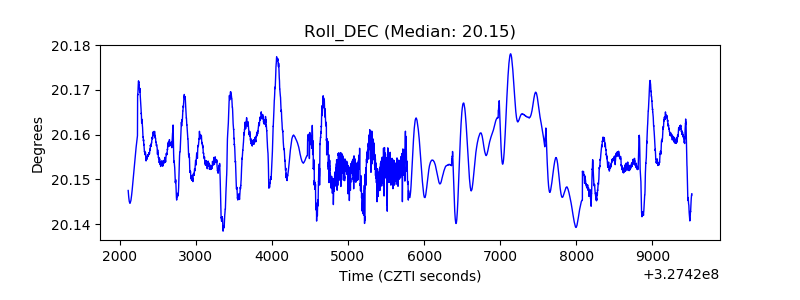 |
| _Roll_RA | 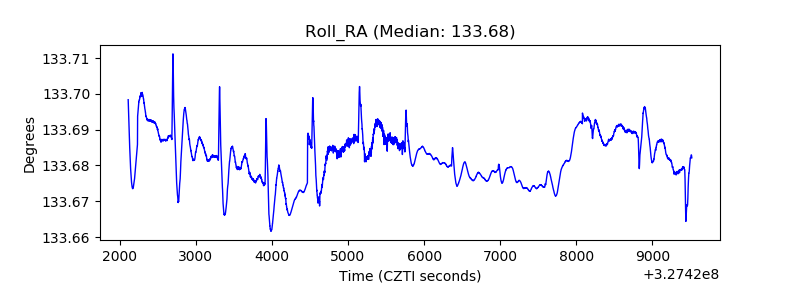 |
| Veto Counter | 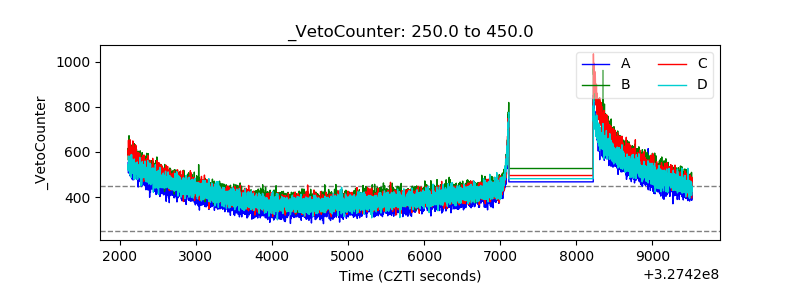 |