| Param | Original file | Final file |
|---|---|---|
| Filename | modeM0/AS1T03_206T01_9000003672_25070cztM0_level2.evt | modeM0/AS1T03_206T01_9000003672_25070cztM0_level2_quad_clean.evt |
| Size (bytes) | 489,787,200 | 90,639,360 |
| Size | 467.1 MB | 86.4 MB |
| Events in quadrant A | 3,119,338 | 599,786 |
| Events in quadrant B | 3,323,243 | 621,900 |
| Events in quadrant C | 3,284,754 | 570,275 |
| Events in quadrant D | 4,697,529 | 532,158 |
| Mode M9 | |||
|---|---|---|---|
| Quadrant | BADHDUFLAG | Total packets | Discarded packets |
| A | 0 | 18 | 0 |
| B | 0 | 19 | 0 |
| C | 0 | 19 | 0 |
| D | 0 | 19 | 0 |
| Mode SS | |||
|---|---|---|---|
| Quadrant | BADHDUFLAG | Total packets | Discarded packets |
| A | 0 | 122 | 0 |
| B | 0 | 122 | 0 |
| C | 0 | 122 | 0 |
| D | 0 | 122 | 0 |
| Mode M0 | |||
|---|---|---|---|
| Quadrant | BADHDUFLAG | Total packets | Discarded packets |
| A | 0 | 12839 | 2 |
| B | 0 | 13456 | 2 |
| C | 0 | 13404 | 2 |
| D | 0 | 18195 | 2 |
| Quadrant | Total seconds | Saturated seconds | Saturation percentage |
|---|---|---|---|
| A | 6027 | 14 | 0.232288% |
| B | 6027 | 44 | 0.730048% |
| C | 6027 | 58 | 0.962336% |
| D | 6027 | 121 | 2.007632% |
Noise dominated data is calculated using 1-second bins in cleaned event files. If a bin has >2000 counts, and if more than 50% of those come from <1% of pixels, then it is considered to be noise-dominated and hence unusable.
| Quadrant | # 1 sec bins | Bins with >0 counts | Bins with >2000 counts | High rate bins dominated by noise | Noise dominated (total time) | Noise dominated (detector-on time) | Marked lightcurve |
|---|---|---|---|---|---|---|---|
| A | 7437 | 6028 | 0 | 0 | 0.00% | 0.00% | 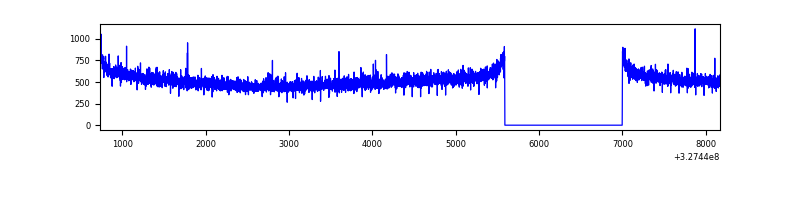 |
| B | 7437 | 6028 | 9 | 9 | 0.12% | 0.15% | 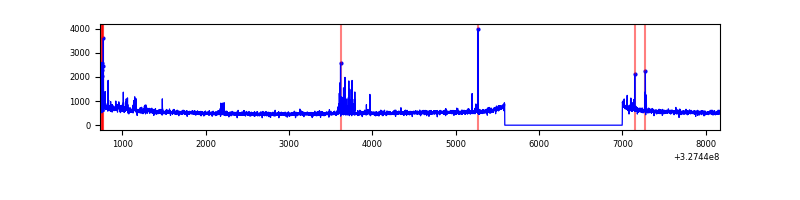 |
| C | 7437 | 6028 | 0 | 0 | 0.00% | 0.00% | 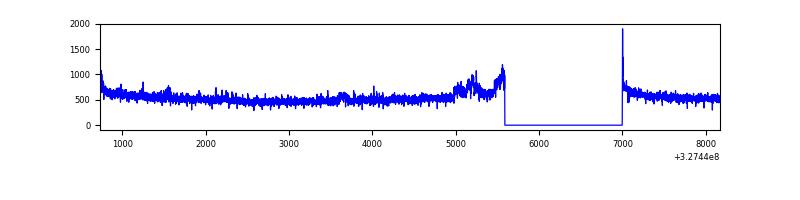 |
| D | 7437 | 6028 | 98 | 98 | 1.32% | 1.63% | 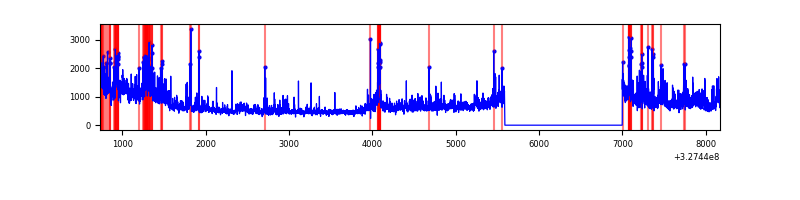 |
Top three noisy pixels from each quadrant. If the there are fewer than three noisy pixels in the level2.evt file, extra rows are filled as -1
| Pixel properties | Quadrant properties | ||||||
|---|---|---|---|---|---|---|---|
| Quadrant | DetID | PixID | Counts | Sigma | Mean | Median | Sigma |
| A | 13 | 254 | 10698 | 61.24 | 808 | 795 | 161.7 |
| A | 0 | 226 | 6914 | 37.84 | 808 | 795 | 161.7 |
| A | 3 | 137 | 6636 | 36.12 | 808 | 795 | 161.7 |
| B | 0 | 229 | 62139 | 402.14 | 815 | 799 | 152.5 |
| B | 4 | 80 | 47463 | 305.92 | 815 | 799 | 152.5 |
| B | 0 | 190 | 23166 | 146.63 | 815 | 799 | 152.5 |
| C | 14 | 238 | 125677 | 693.72 | 770 | 775 | 180.0 |
| C | 7 | 247 | 119969 | 662.01 | 770 | 775 | 180.0 |
| C | 3 | 233 | 18819 | 100.22 | 770 | 775 | 180.0 |
| D | 8 | 195 | 875186 | 4727.68 | 764 | 745 | 185.0 |
| D | 1 | 52 | 391879 | 2114.67 | 764 | 745 | 185.0 |
| D | 9 | 35 | 186409 | 1003.8 | 764 | 745 | 185.0 |
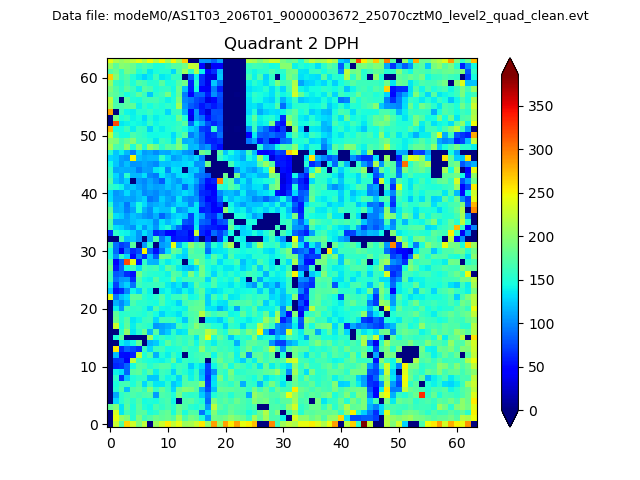
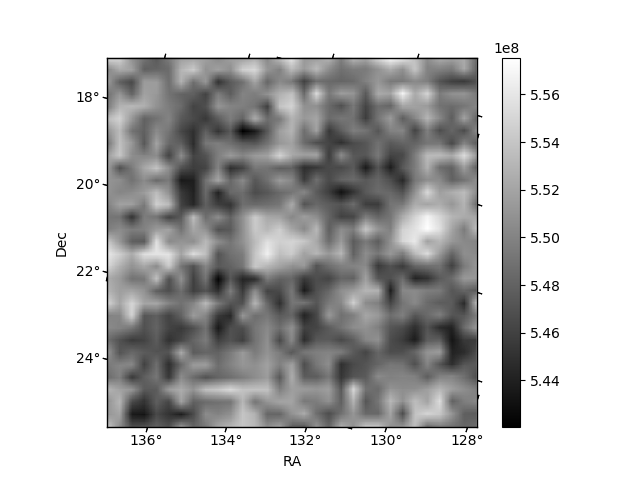
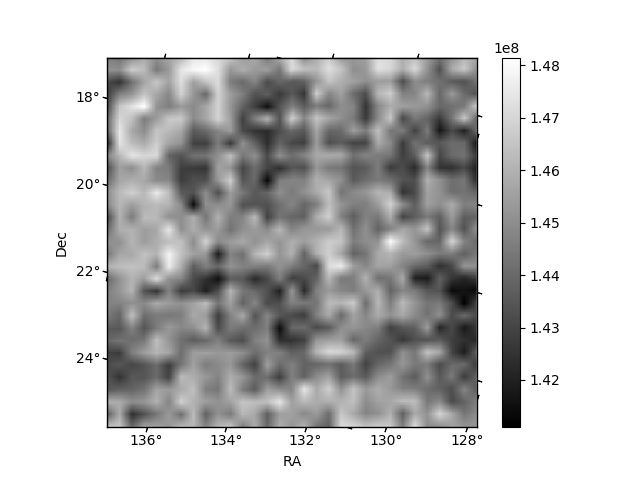
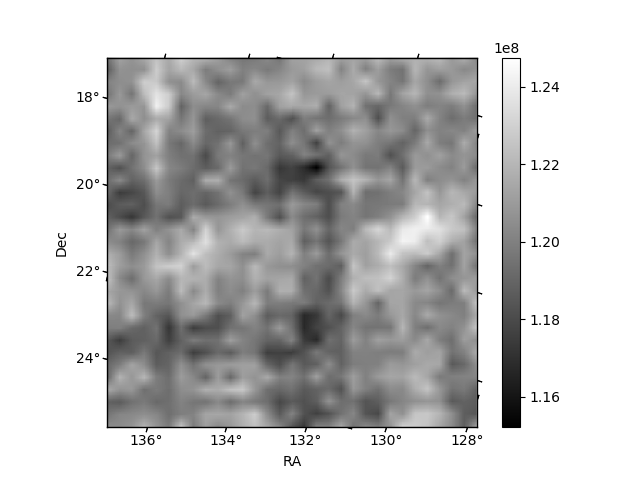
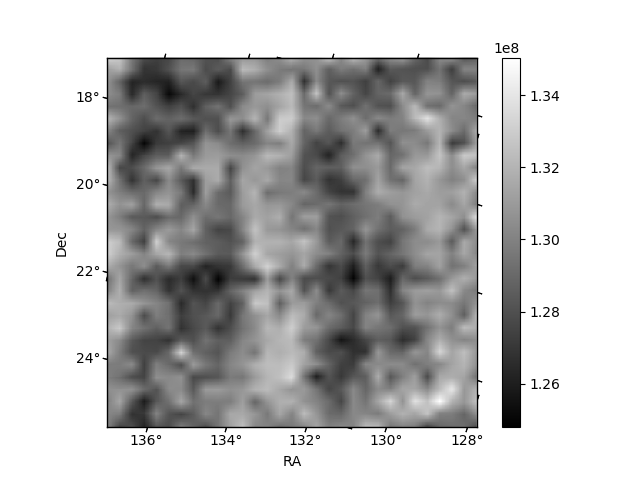
Histogram calculated using DETX and DETY for each event in the final _common_clean file
| Quadrant A | 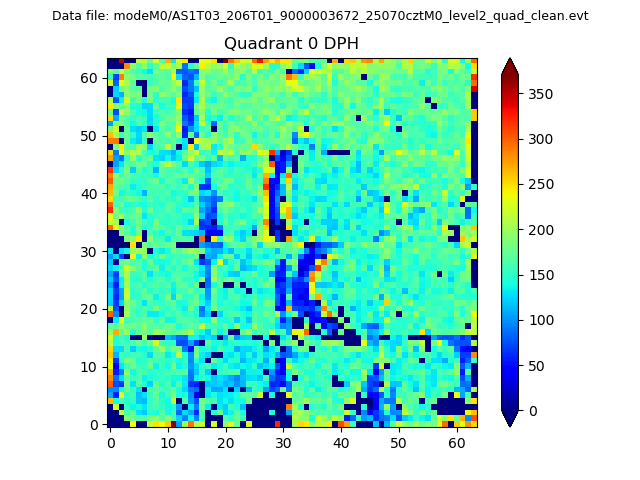 |
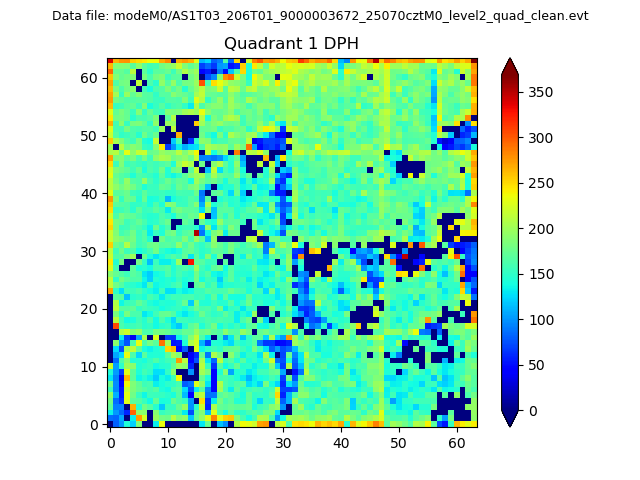 |
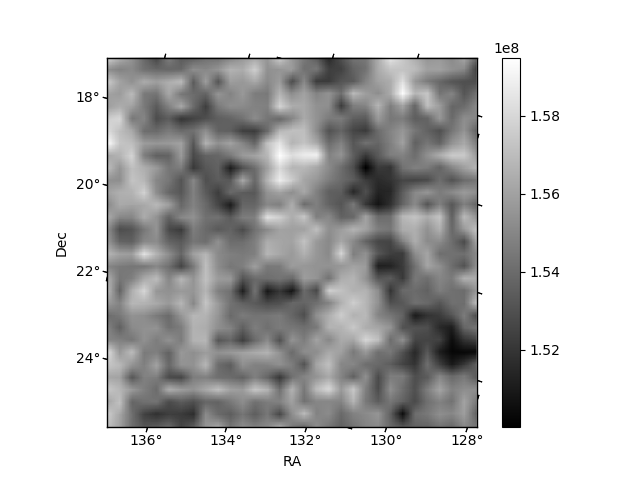
Quadrant B |
|---|---|---|---|
| Quadrant D | 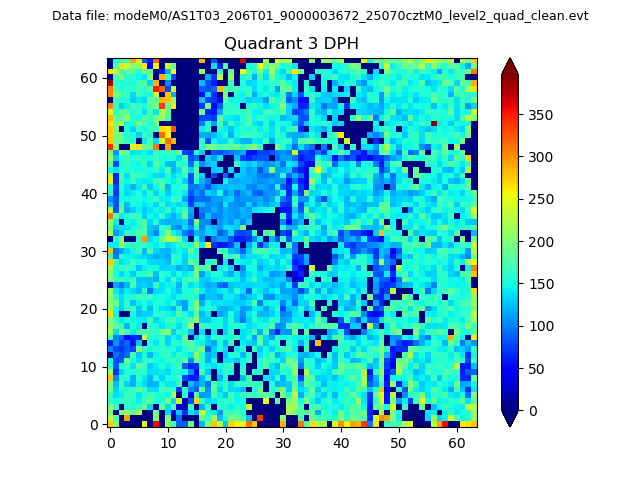 |
 |
Quadrant C |
| Plot type | Count rate plots | Images |
|---|---|---|
| Comparison with Poisson distribution Blue bars denote a histogram of data divided into 1 sec bins. Red curve is a Poisson curve with rate = median count rate of data. |
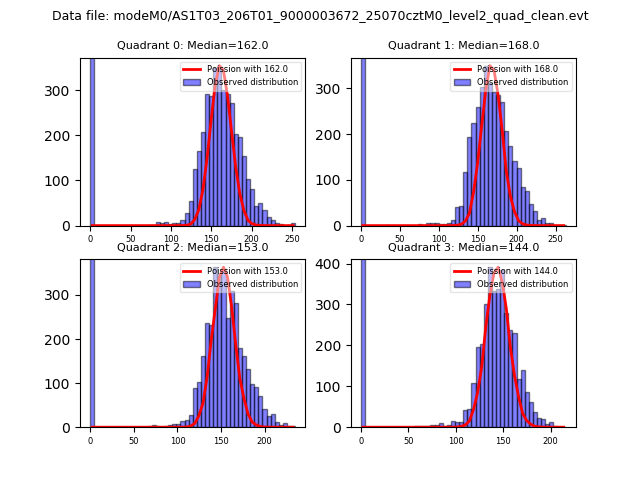 |
 |
| Quadrant-wise count rates Data is divided into 100 sec bins |
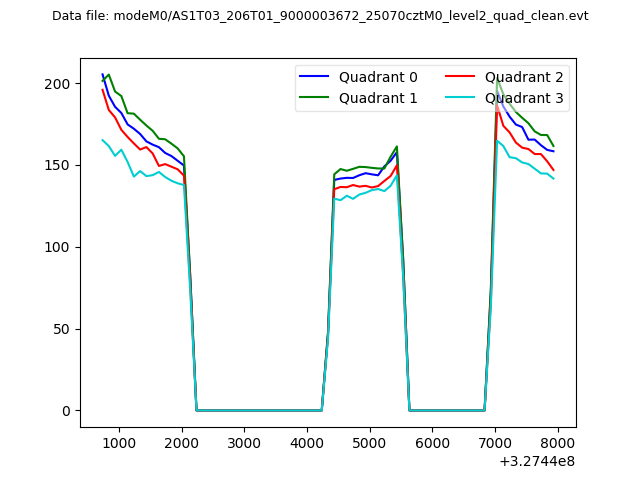 |
|
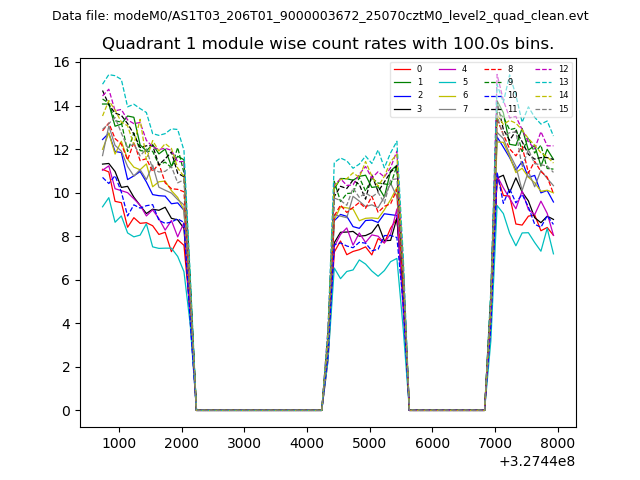
| Module-wise count rates for Quadrant A Data is divided into 100 sec bins |
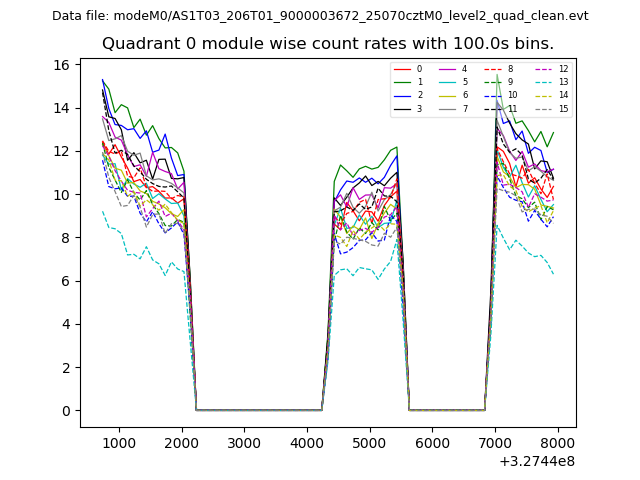 |
 |
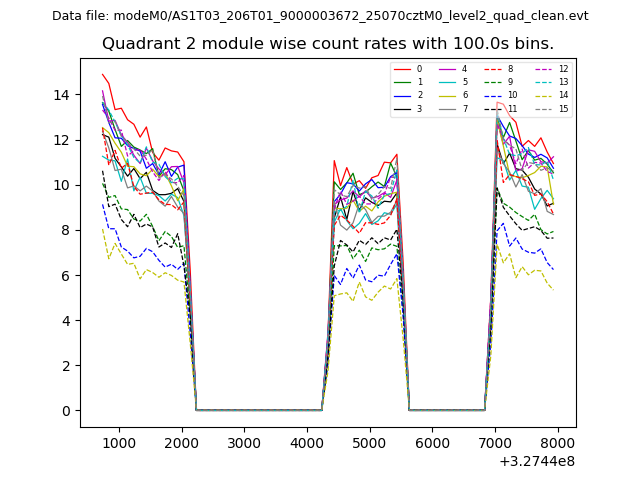
| Module-wise count rates for Quadrant B Data is divided into 100 sec bins |
 |
 |
| Module-wise count rates for Quadrant C Data is divided into 100 sec bins |
 |
 |
| Module-wise count rates for Quadrant D Data is divided into 100 sec bins |
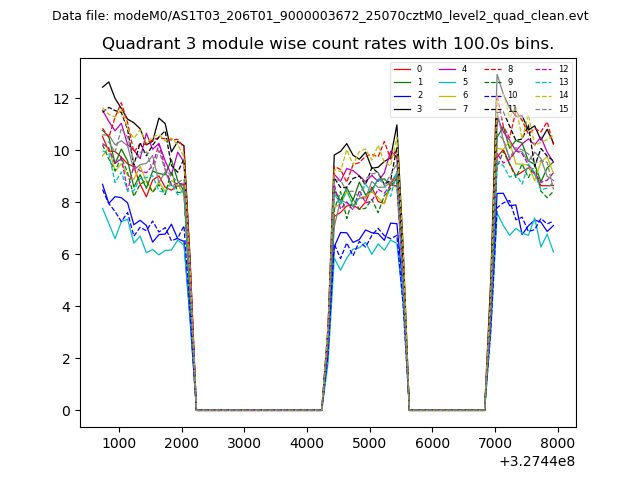 |
 |
| Parameter | Plot |
|---|---|
| CZT HV Monitor | 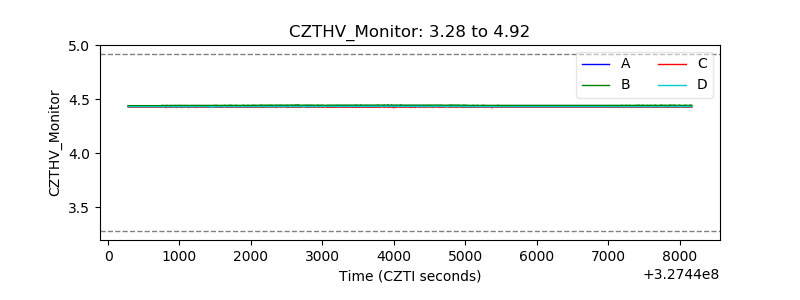 |
| D_VDD | 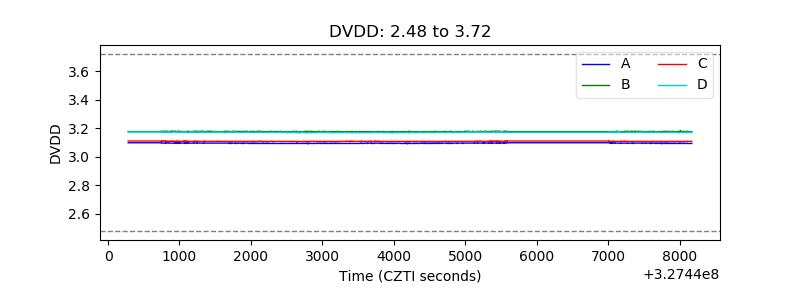 |
| Temperature 1 |  |
| Veto HV Monitor | 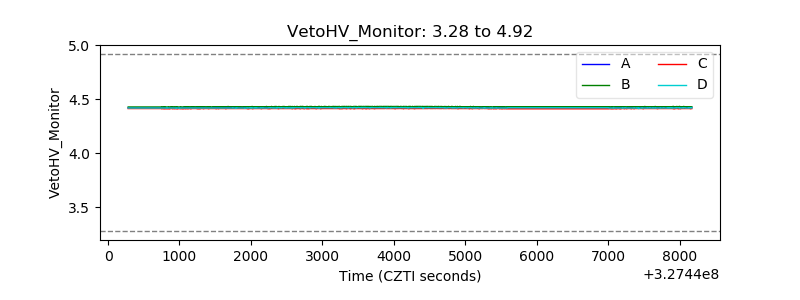 |
| Veto LLD | 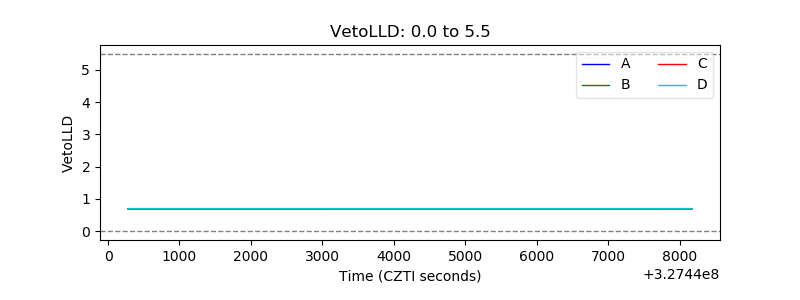 |
| Alpha Counter | 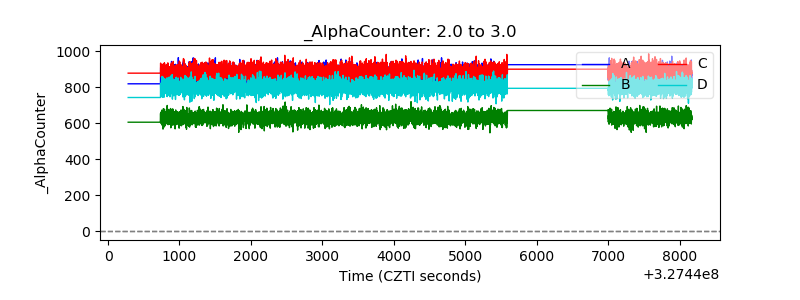 |
| _CPM_Rate | 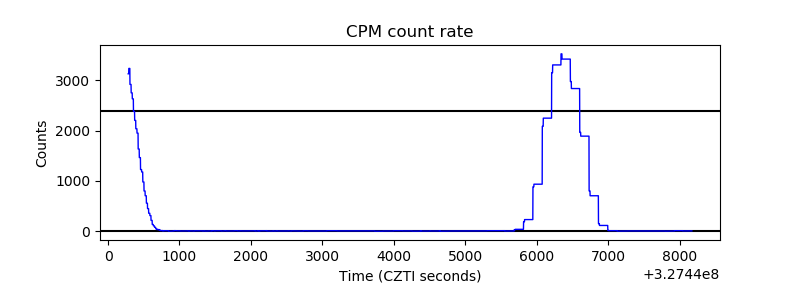 |
| CZT Counter | 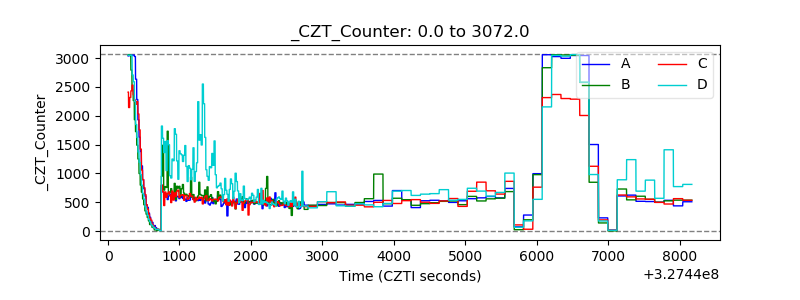 |
| +2.5 Volts monitor |  |
| +5 Volts monitor | 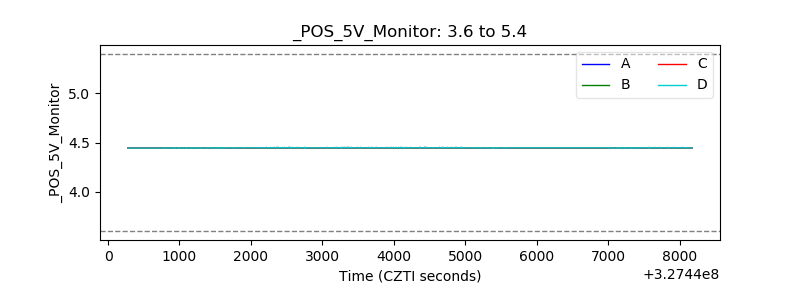 |
| _ROLL_ROT | 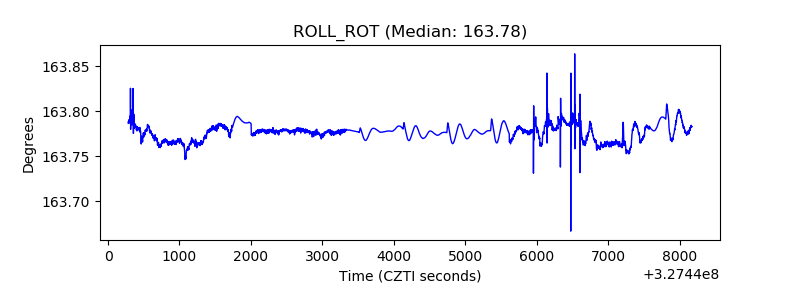 |
| _Roll_DEC | 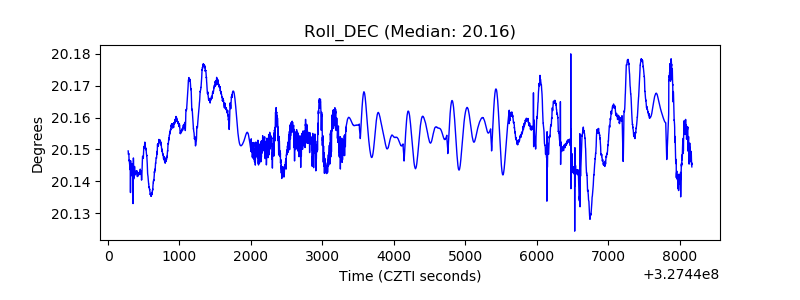 |
| _Roll_RA | 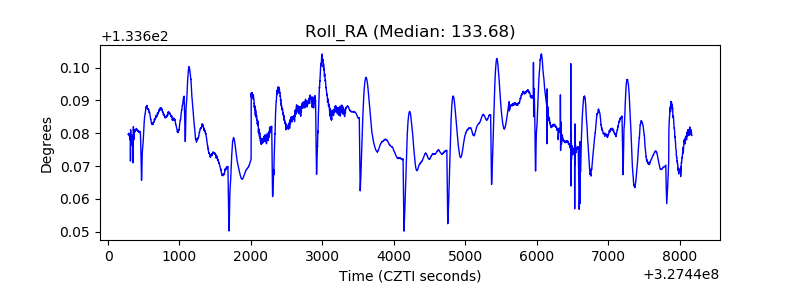 |
| Veto Counter | 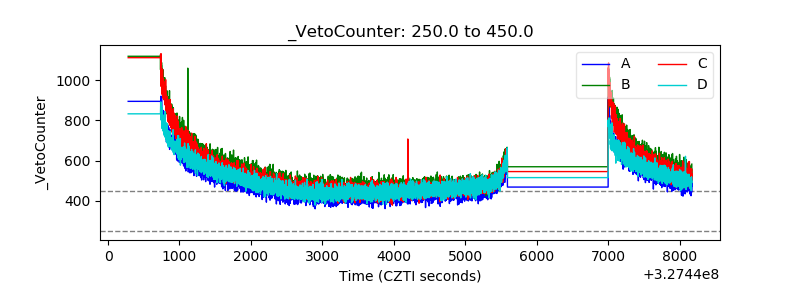 |