| Param | Original file | Final file |
|---|---|---|
| Filename | modeM0/AS1T03_206T01_9000003672_25071cztM0_level2.evt | modeM0/AS1T03_206T01_9000003672_25071cztM0_level2_quad_clean.evt |
| Size (bytes) | 502,859,520 | 81,092,160 |
| Size | 479.6 MB | 77.3 MB |
| Events in quadrant A | 3,127,396 | 525,066 |
| Events in quadrant B | 3,322,969 | 542,626 |
| Events in quadrant C | 3,212,081 | 496,376 |
| Events in quadrant D | 5,155,962 | 468,302 |
| Mode M9 | |||
|---|---|---|---|
| Quadrant | BADHDUFLAG | Total packets | Discarded packets |
| A | 0 | 17 | 0 |
| B | 0 | 18 | 0 |
| C | 0 | 18 | 0 |
| D | 0 | 18 | 0 |
| Mode SS | |||
|---|---|---|---|
| Quadrant | BADHDUFLAG | Total packets | Discarded packets |
| A | 0 | 124 | 0 |
| B | 0 | 124 | 0 |
| C | 0 | 124 | 0 |
| D | 0 | 124 | 0 |
| Mode M0 | |||
|---|---|---|---|
| Quadrant | BADHDUFLAG | Total packets | Discarded packets |
| A | 0 | 12787 | 2 |
| B | 0 | 13327 | 2 |
| C | 0 | 13026 | 2 |
| D | 0 | 19701 | 2 |
| Quadrant | Total seconds | Saturated seconds | Saturation percentage |
|---|---|---|---|
| A | 6059 | 26 | 0.429114% |
| B | 6058 | 82 | 1.353582% |
| C | 6058 | 72 | 1.188511% |
| D | 6058 | 137 | 2.261472% |
Noise dominated data is calculated using 1-second bins in cleaned event files. If a bin has >2000 counts, and if more than 50% of those come from <1% of pixels, then it is considered to be noise-dominated and hence unusable.
| Quadrant | # 1 sec bins | Bins with >0 counts | Bins with >2000 counts | High rate bins dominated by noise | Noise dominated (total time) | Noise dominated (detector-on time) | Marked lightcurve |
|---|---|---|---|---|---|---|---|
| A | 7419 | 6060 | 0 | 0 | 0.00% | 0.00% | 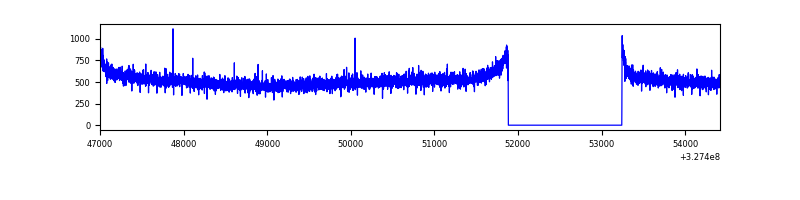 |
| B | 7418 | 6059 | 12 | 12 | 0.16% | 0.20% | 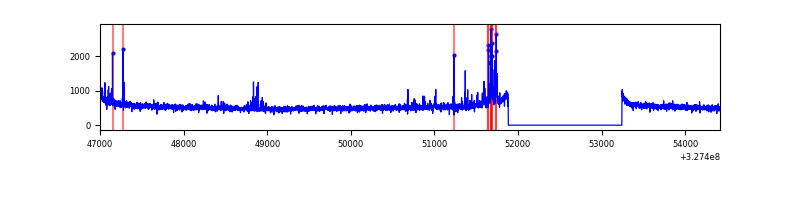 |
| C | 7418 | 6059 | 0 | 0 | 0.00% | 0.00% | 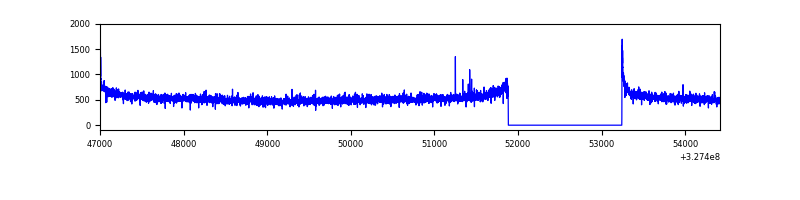 |
| D | 7418 | 6059 | 67 | 67 | 0.90% | 1.11% | 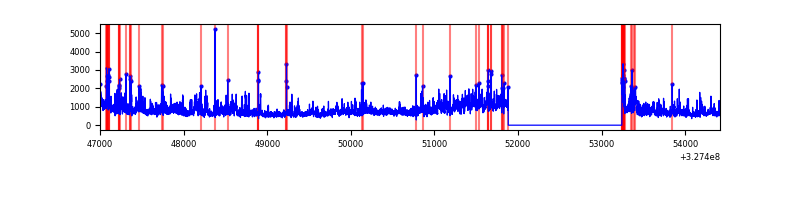 |
Top three noisy pixels from each quadrant. If the there are fewer than three noisy pixels in the level2.evt file, extra rows are filled as -1
| Pixel properties | Quadrant properties | ||||||
|---|---|---|---|---|---|---|---|
| Quadrant | DetID | PixID | Counts | Sigma | Mean | Median | Sigma |
| A | 13 | 254 | 10376 | 59.63 | 811 | 796 | 160.7 |
| A | 0 | 226 | 7058 | 38.97 | 811 | 796 | 160.7 |
| A | 3 | 137 | 6801 | 37.37 | 811 | 796 | 160.7 |
| B | 0 | 229 | 44801 | 287.8 | 817 | 801 | 152.9 |
| B | 5 | 172 | 40176 | 257.54 | 817 | 801 | 152.9 |
| B | 0 | 190 | 32454 | 207.04 | 817 | 801 | 152.9 |
| C | 14 | 238 | 123595 | 685.23 | 769 | 774 | 179.2 |
| C | 3 | 233 | 36413 | 198.83 | 769 | 774 | 179.2 |
| C | 7 | 247 | 28741 | 156.03 | 769 | 774 | 179.2 |
| D | 1 | 52 | 1014593 | 5506.61 | 763 | 742 | 184.1 |
| D | 8 | 195 | 808206 | 4385.64 | 763 | 742 | 184.1 |
| D | 9 | 35 | 158416 | 856.39 | 763 | 742 | 184.1 |
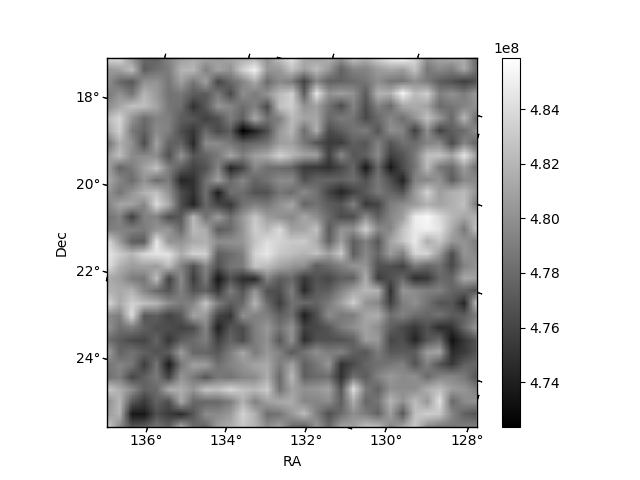
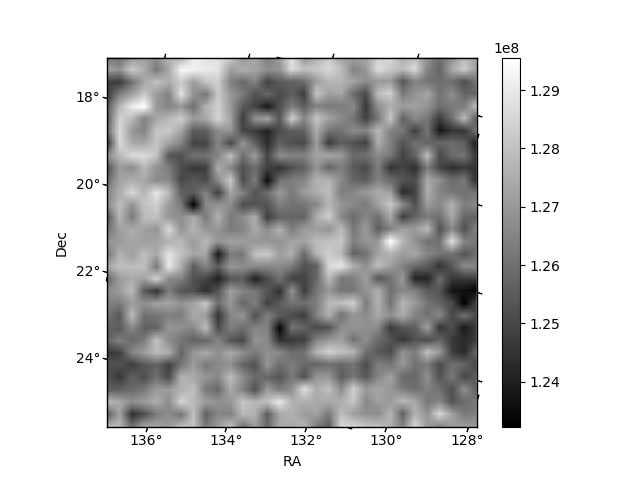
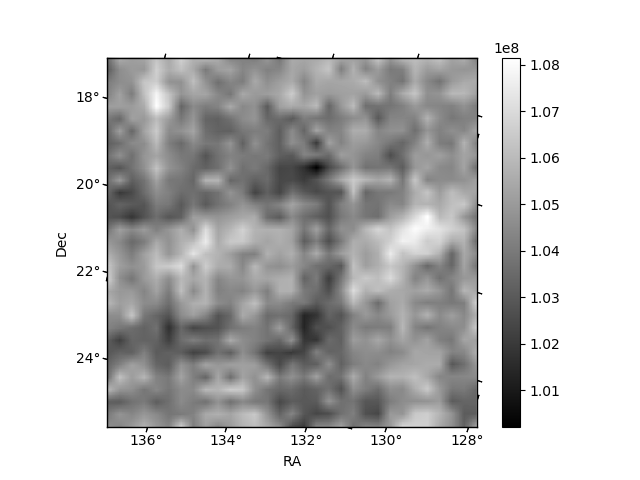
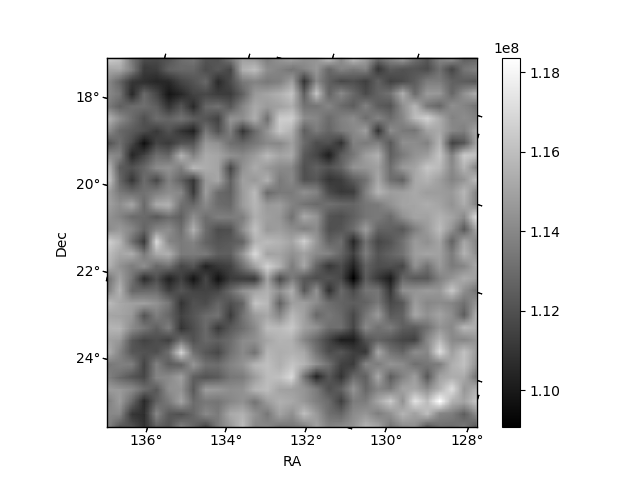
Histogram calculated using DETX and DETY for each event in the final _common_clean file
| Quadrant A | 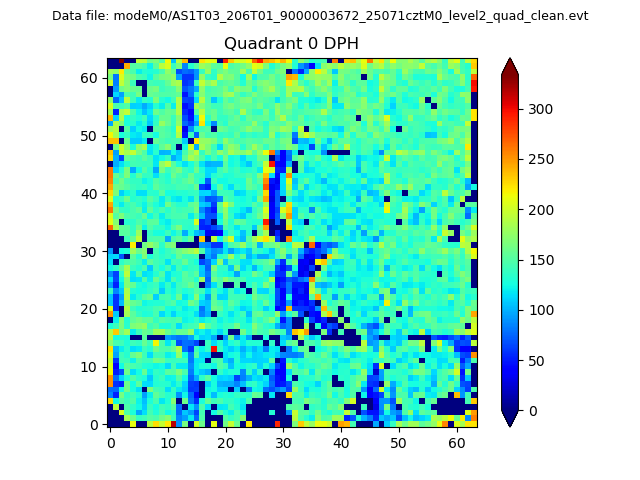 |
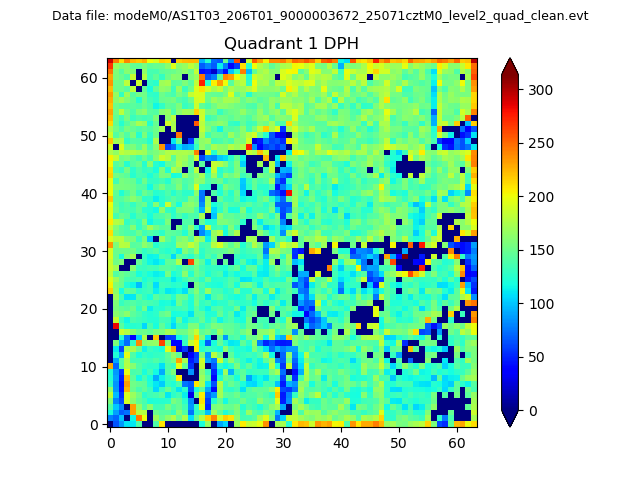 |
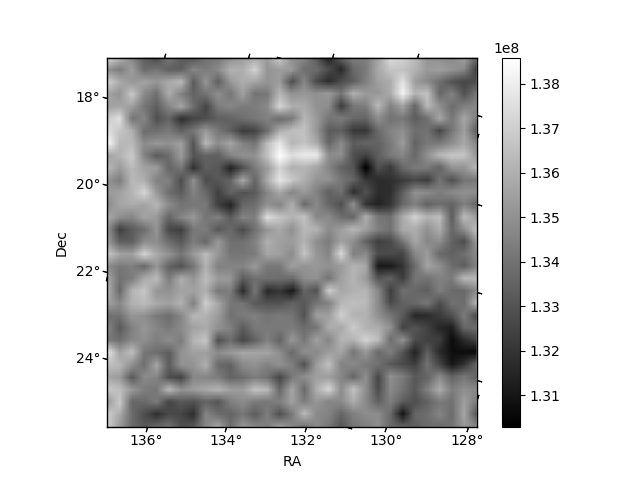
Quadrant B |
|---|---|---|---|
| Quadrant D | 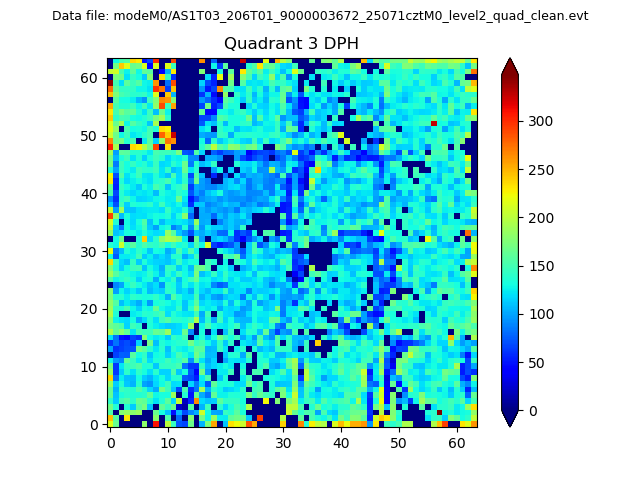 |
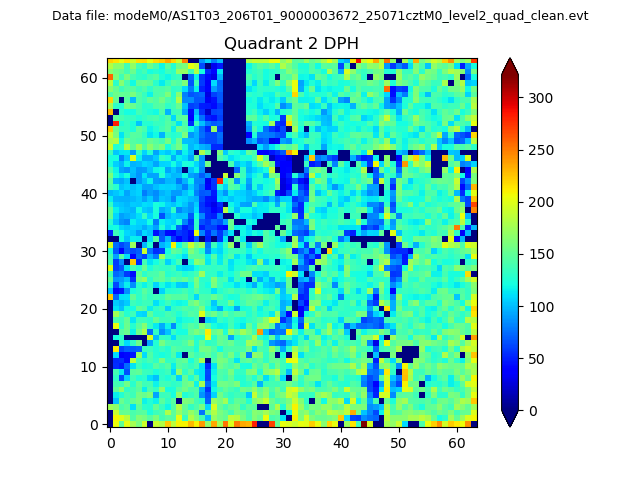 |
Quadrant C |
| Plot type | Count rate plots | Images |
|---|---|---|
| Comparison with Poisson distribution Blue bars denote a histogram of data divided into 1 sec bins. Red curve is a Poisson curve with rate = median count rate of data. |
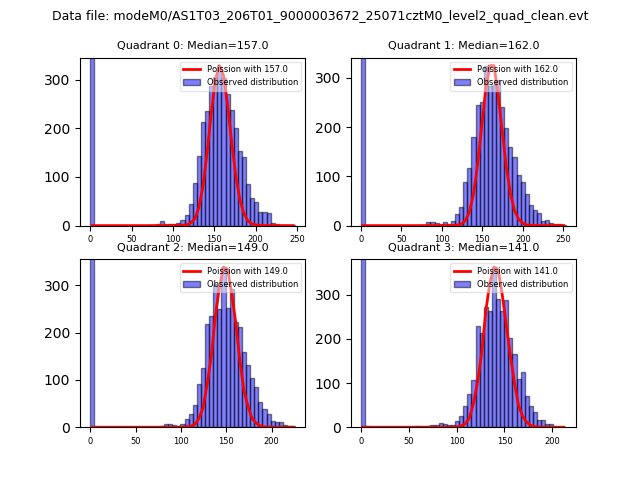 |
 |
| Quadrant-wise count rates Data is divided into 100 sec bins |
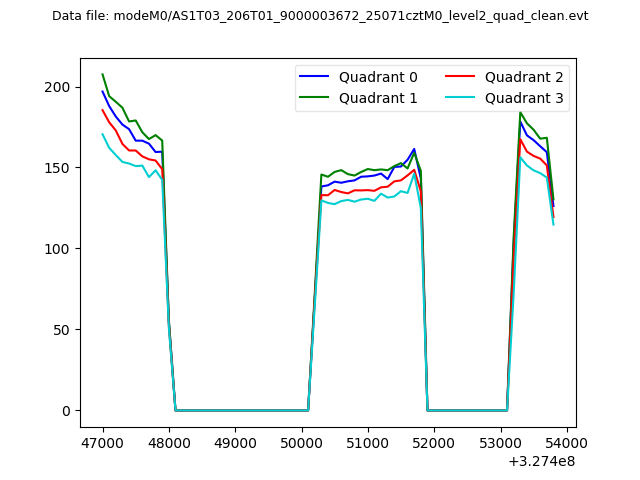 |
|
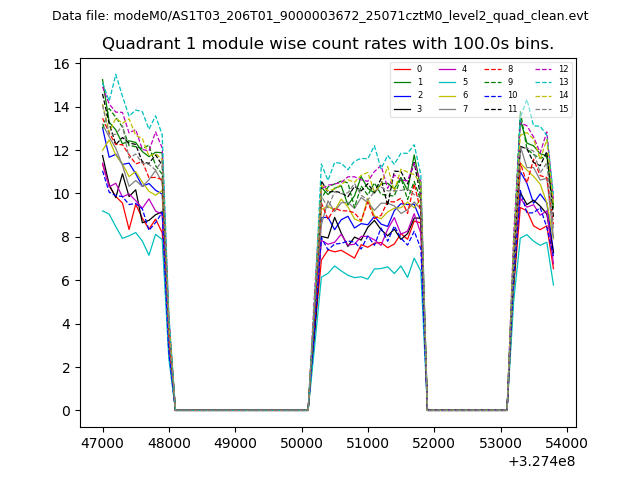
| Module-wise count rates for Quadrant A Data is divided into 100 sec bins |
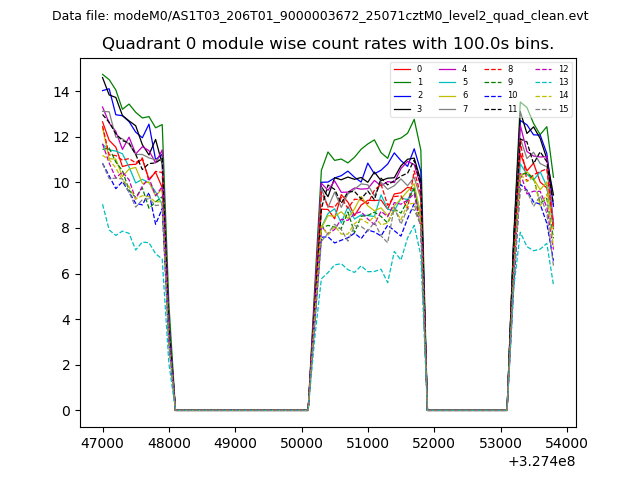 |
 |
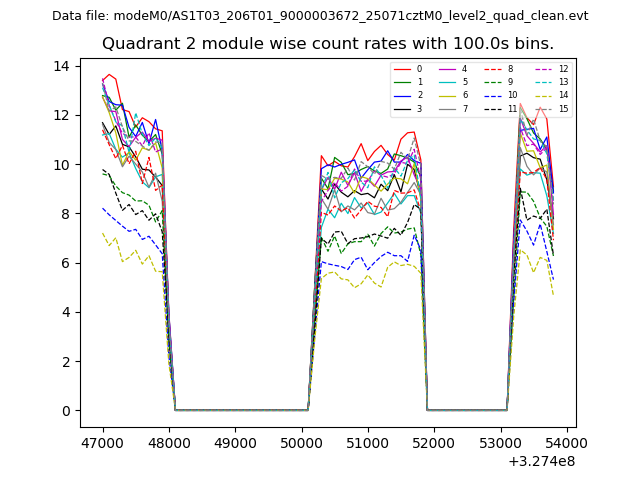
| Module-wise count rates for Quadrant B Data is divided into 100 sec bins |
 |
 |
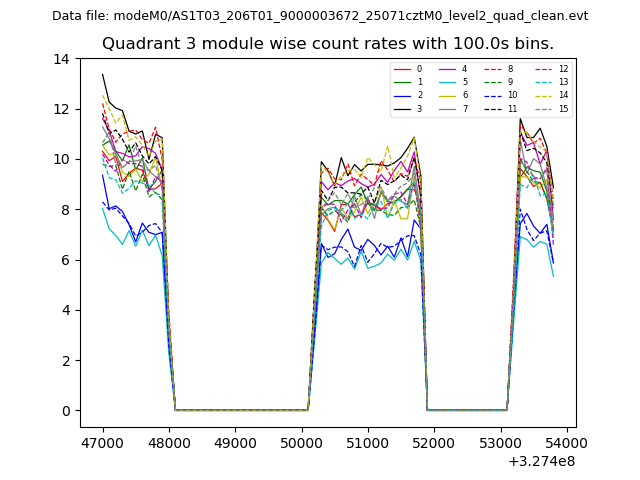
| Module-wise count rates for Quadrant C Data is divided into 100 sec bins |
 |
 |
| Module-wise count rates for Quadrant D Data is divided into 100 sec bins |
 |
 |
| Parameter | Plot |
|---|---|
| CZT HV Monitor | 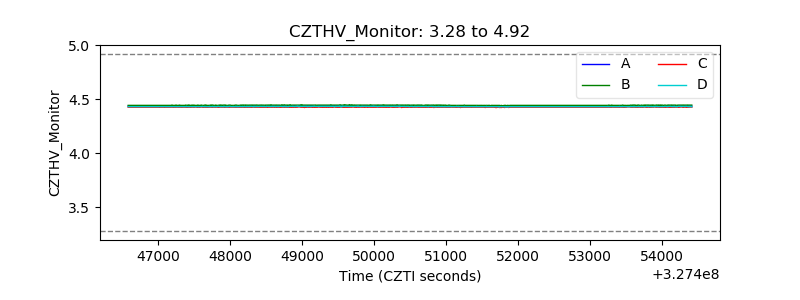 |
| D_VDD | 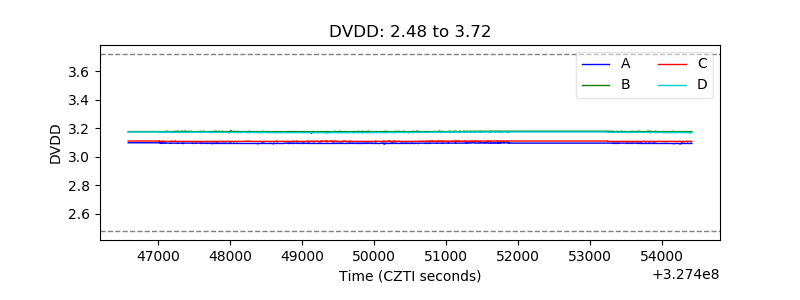 |
| Temperature 1 | 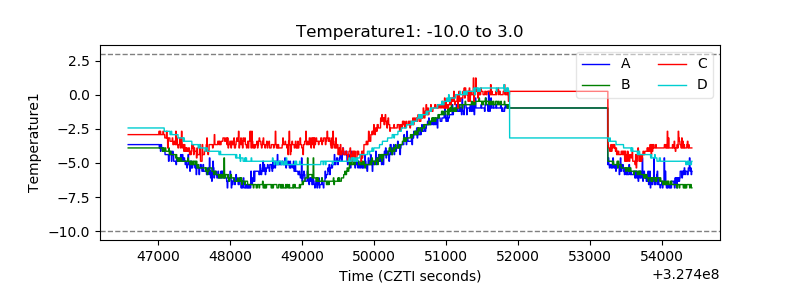 |
| Veto HV Monitor | 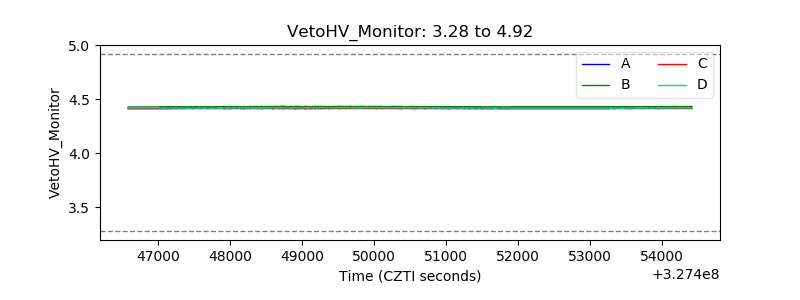 |
| Veto LLD | 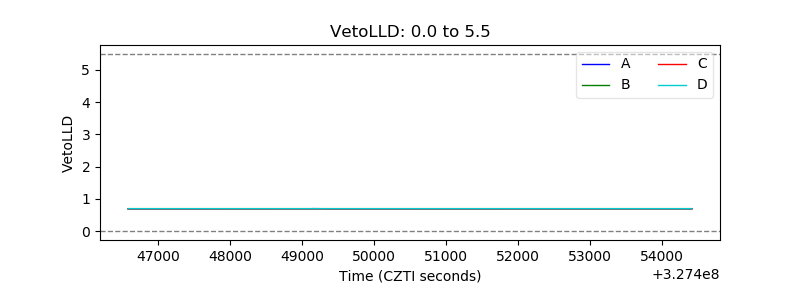 |
| Alpha Counter | 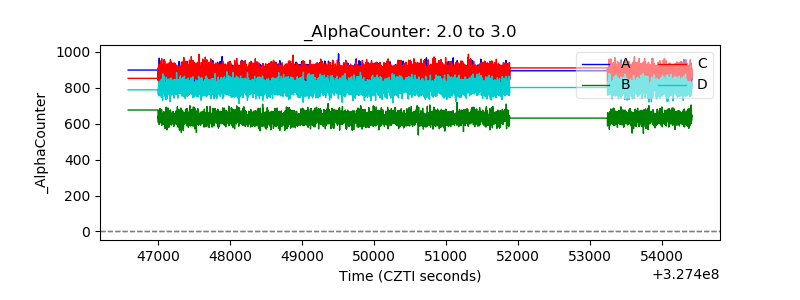 |
| _CPM_Rate | 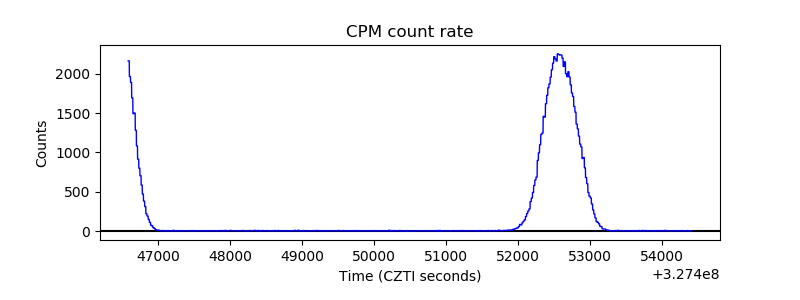 |
| CZT Counter | 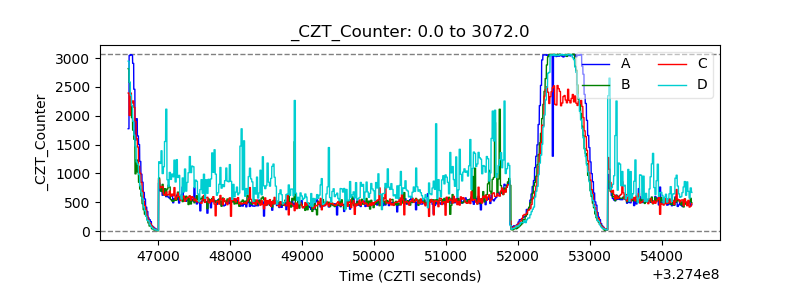 |
| +2.5 Volts monitor |  |
| +5 Volts monitor |  |
| _ROLL_ROT | 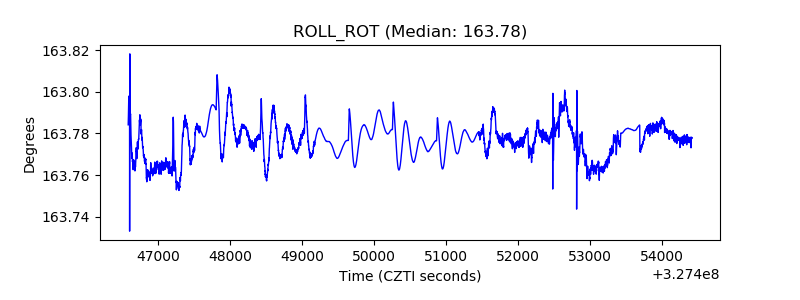 |
| _Roll_DEC | 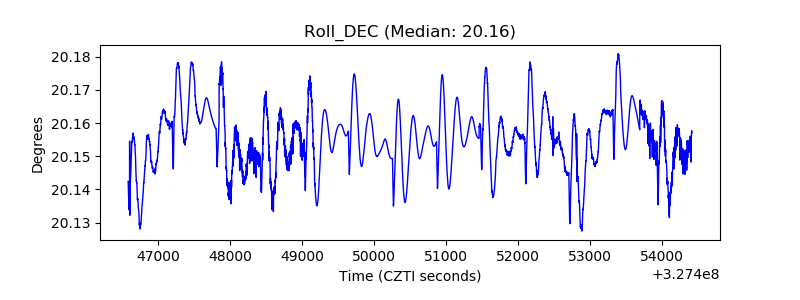 |
| _Roll_RA | 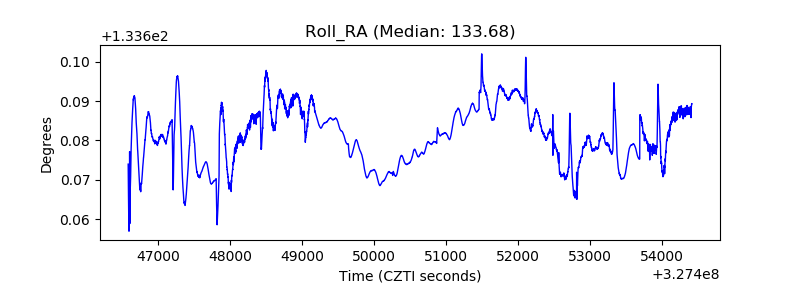 |
| Veto Counter | 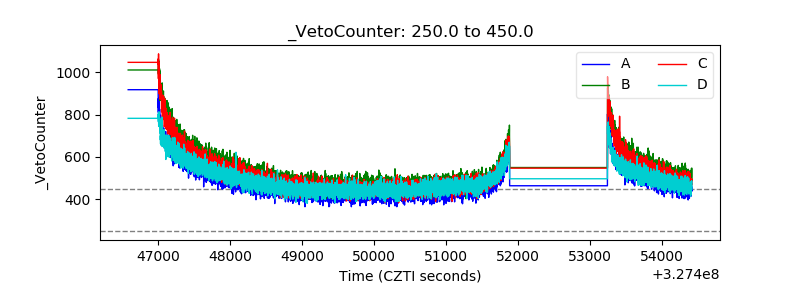 |