| Param | Original file | Final file |
|---|---|---|
| Filename | modeM0/AS1T03_206T01_9000003672_25072cztM0_level2.evt | modeM0/AS1T03_206T01_9000003672_25072cztM0_level2_quad_clean.evt |
| Size (bytes) | 546,595,200 | 72,843,840 |
| Size | 521.3 MB | 69.5 MB |
| Events in quadrant A | 3,318,231 | 454,083 |
| Events in quadrant B | 3,456,003 | 466,313 |
| Events in quadrant C | 3,390,523 | 432,269 |
| Events in quadrant D | 5,940,431 | 391,178 |
| Mode M9 | |||
|---|---|---|---|
| Quadrant | BADHDUFLAG | Total packets | Discarded packets |
| A | 0 | 16 | 0 |
| B | 0 | 17 | 0 |
| C | 0 | 17 | 0 |
| D | 0 | 17 | 0 |
| Mode SS | |||
|---|---|---|---|
| Quadrant | BADHDUFLAG | Total packets | Discarded packets |
| A | 0 | 134 | 0 |
| B | 0 | 134 | 0 |
| C | 0 | 134 | 0 |
| D | 0 | 134 | 0 |
| Mode M0 | |||
|---|---|---|---|
| Quadrant | BADHDUFLAG | Total packets | Discarded packets |
| A | 0 | 13738 | 2 |
| B | 0 | 14040 | 2 |
| C | 0 | 13924 | 2 |
| D | 0 | 22316 | 2 |
| Quadrant | Total seconds | Saturated seconds | Saturation percentage |
|---|---|---|---|
| A | 6618 | 21 | 0.317316% |
| B | 6618 | 41 | 0.619523% |
| C | 6618 | 55 | 0.831067% |
| D | 6618 | 529 | 7.993351% |
Noise dominated data is calculated using 1-second bins in cleaned event files. If a bin has >2000 counts, and if more than 50% of those come from <1% of pixels, then it is considered to be noise-dominated and hence unusable.
| Quadrant | # 1 sec bins | Bins with >0 counts | Bins with >2000 counts | High rate bins dominated by noise | Noise dominated (total time) | Noise dominated (detector-on time) | Marked lightcurve |
|---|---|---|---|---|---|---|---|
| A | 7843 | 6619 | 0 | 0 | 0.00% | 0.00% | 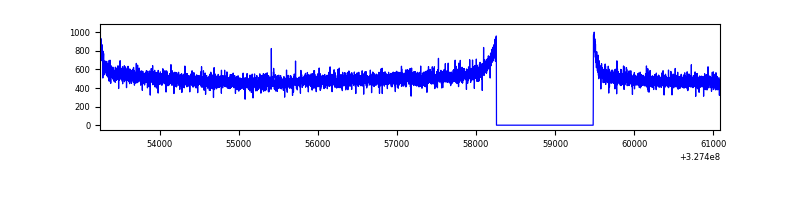 |
| B | 7843 | 6619 | 0 | 0 | 0.00% | 0.00% | 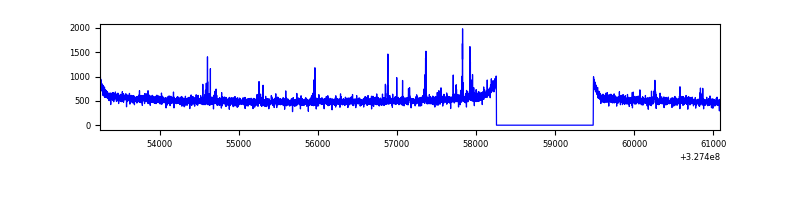 |
| C | 7843 | 6619 | 0 | 0 | 0.00% | 0.00% | 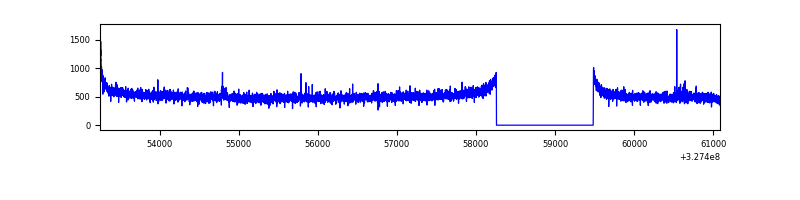 |
| D | 7843 | 6619 | 294 | 294 | 3.75% | 4.44% | 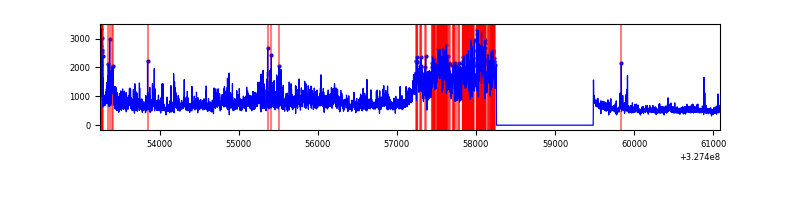 |
Top three noisy pixels from each quadrant. If the there are fewer than three noisy pixels in the level2.evt file, extra rows are filled as -1
| Pixel properties | Quadrant properties | ||||||
|---|---|---|---|---|---|---|---|
| Quadrant | DetID | PixID | Counts | Sigma | Mean | Median | Sigma |
| A | 13 | 254 | 11177 | 60.17 | 860 | 843 | 171.7 |
| A | 3 | 137 | 7450 | 38.47 | 860 | 843 | 171.7 |
| A | 0 | 226 | 7326 | 37.75 | 860 | 843 | 171.7 |
| B | 10 | 249 | 25398 | 150.38 | 866 | 848 | 163.3 |
| B | 12 | 111 | 19413 | 113.72 | 866 | 848 | 163.3 |
| B | 0 | 229 | 17223 | 100.3 | 866 | 848 | 163.3 |
| C | 14 | 238 | 131800 | 688.28 | 818 | 824 | 190.3 |
| C | 7 | 247 | 25045 | 127.28 | 818 | 824 | 190.3 |
| C | 2 | 16 | 23943 | 121.49 | 818 | 824 | 190.3 |
| D | 9 | 35 | 1365081 | 7103.47 | 797 | 776 | 192.1 |
| D | 8 | 195 | 641418 | 3335.6 | 797 | 776 | 192.1 |
| D | 1 | 52 | 505118 | 2625.94 | 797 | 776 | 192.1 |
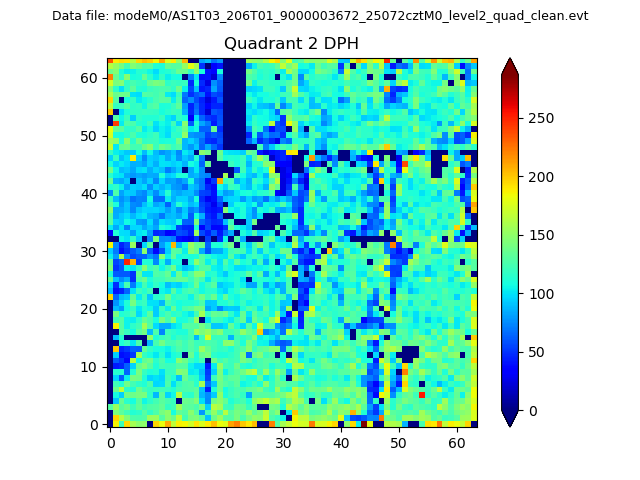
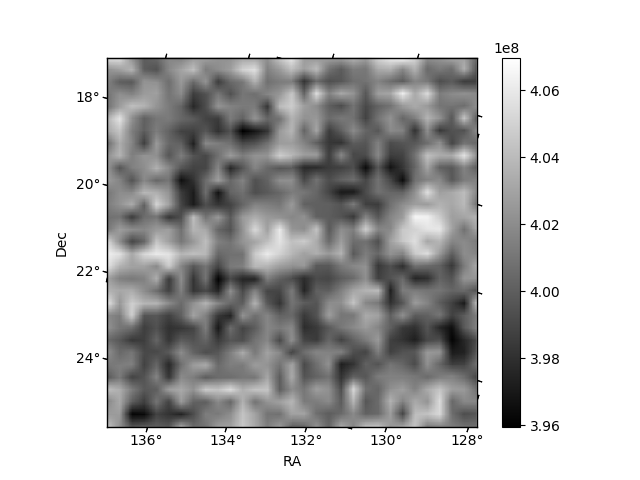
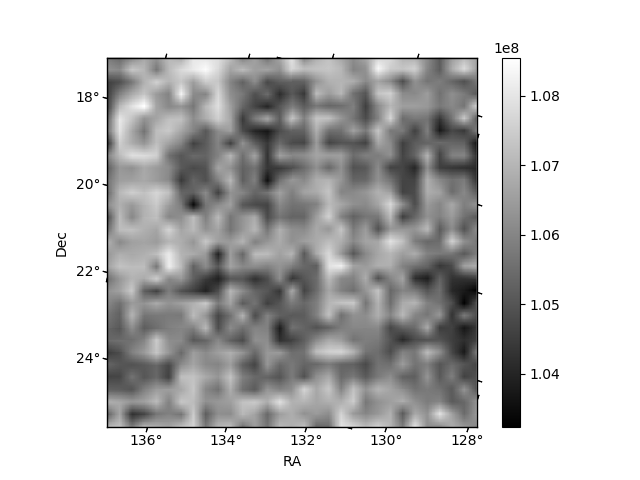
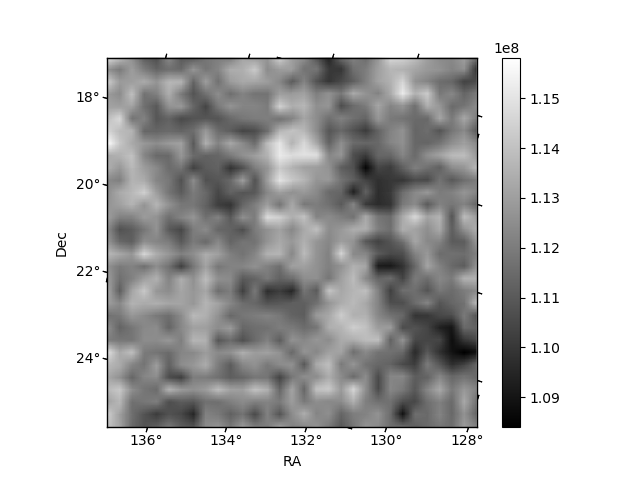
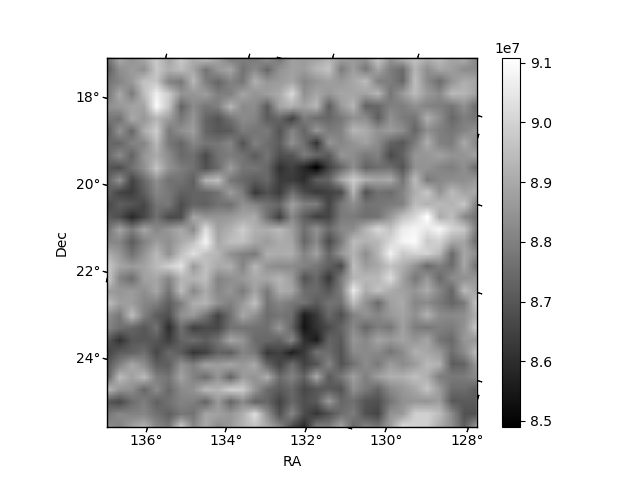
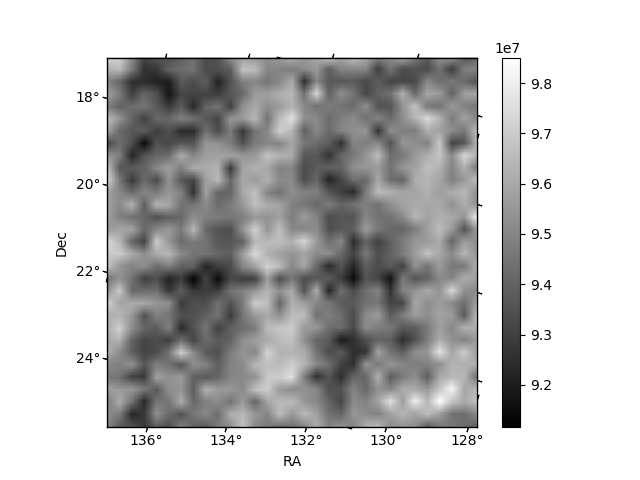
Histogram calculated using DETX and DETY for each event in the final _common_clean file
| Quadrant A | 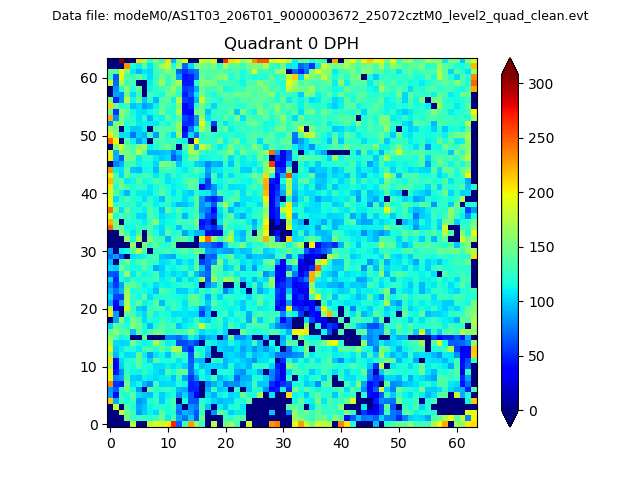 |
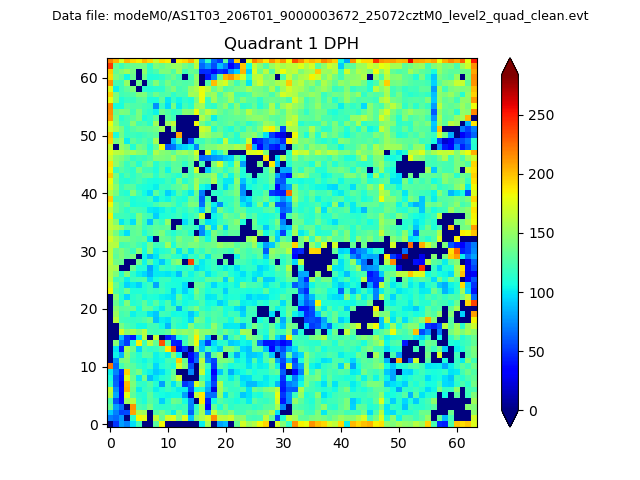 |
Quadrant B |
|---|---|---|---|
| Quadrant D | 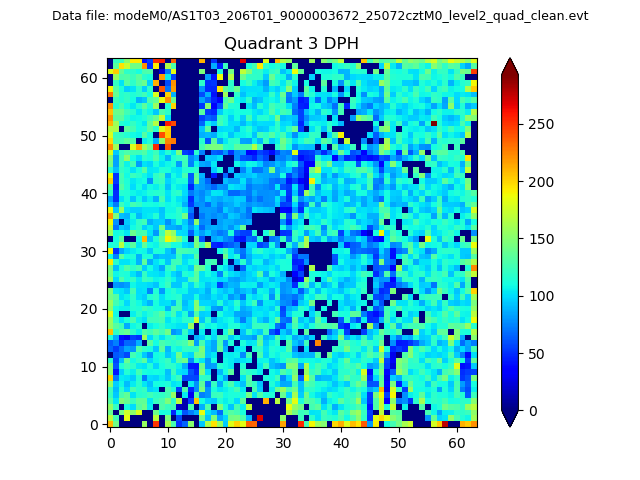 |
 |
Quadrant C |
| Plot type | Count rate plots | Images |
|---|---|---|
| Comparison with Poisson distribution Blue bars denote a histogram of data divided into 1 sec bins. Red curve is a Poisson curve with rate = median count rate of data. |
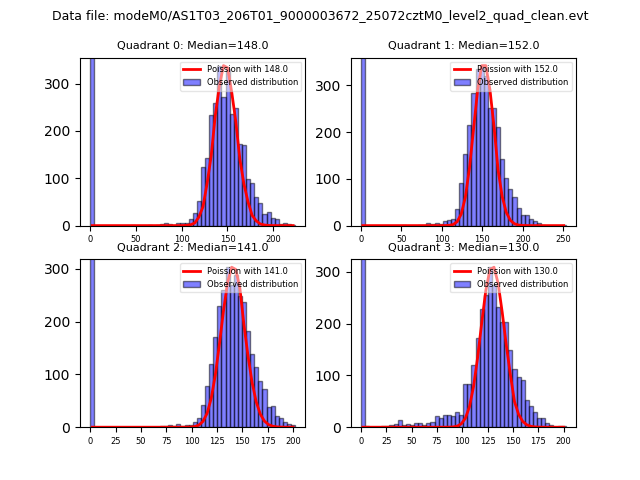 |
 |
| Quadrant-wise count rates Data is divided into 100 sec bins |
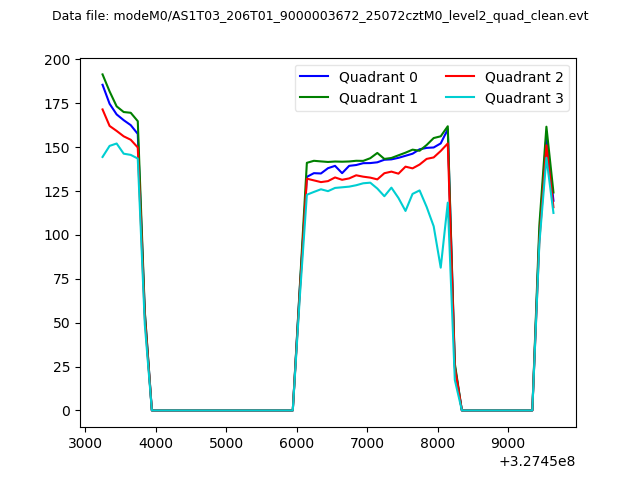 |
|
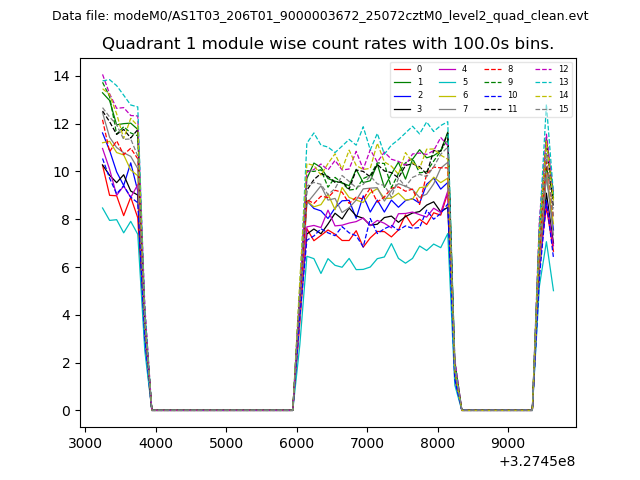
| Module-wise count rates for Quadrant A Data is divided into 100 sec bins |
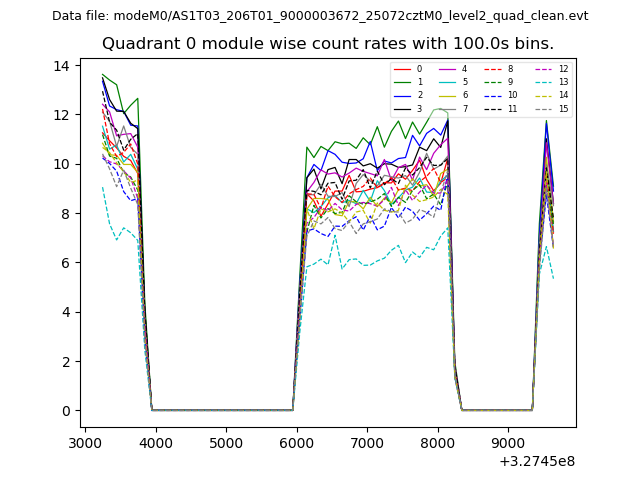 |
 |
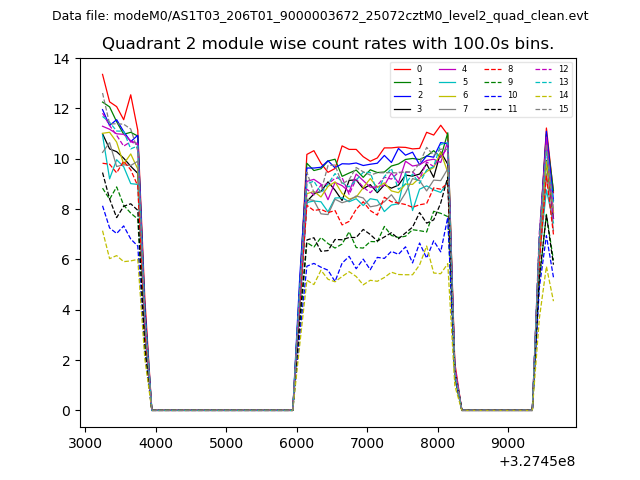
| Module-wise count rates for Quadrant B Data is divided into 100 sec bins |
 |
 |
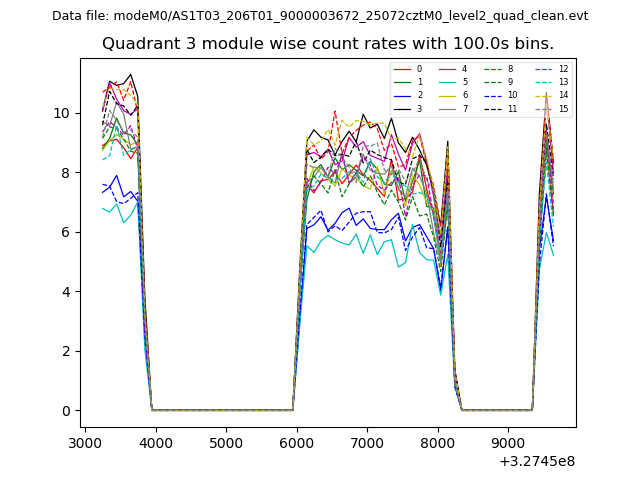
| Module-wise count rates for Quadrant C Data is divided into 100 sec bins |
 |
 |
| Module-wise count rates for Quadrant D Data is divided into 100 sec bins |
 |
 |
| Parameter | Plot |
|---|---|
| CZT HV Monitor | 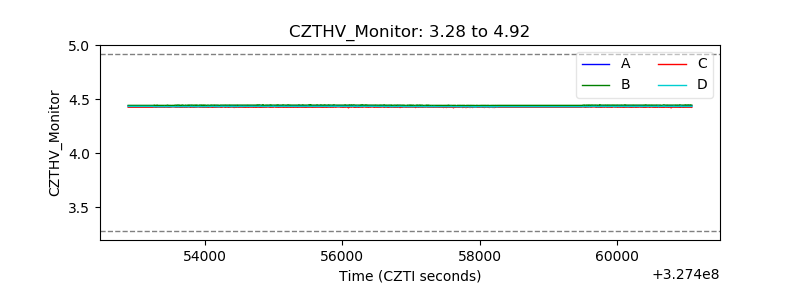 |
| D_VDD | 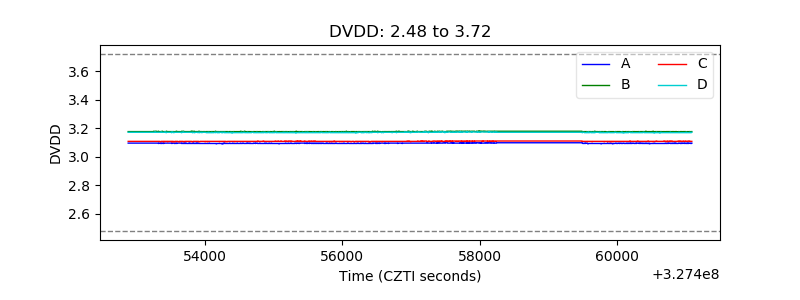 |
| Temperature 1 | 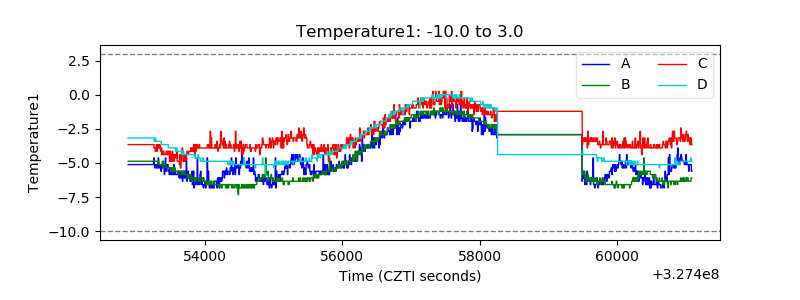 |
| Veto HV Monitor | 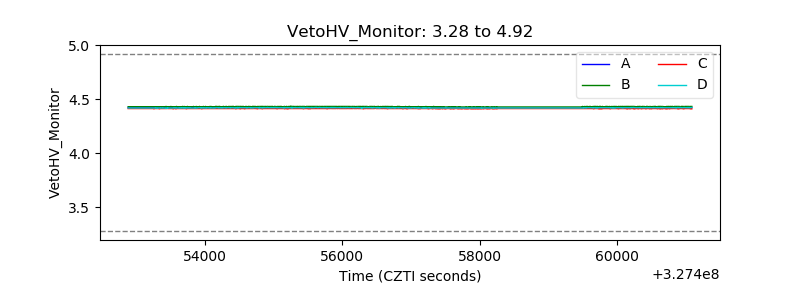 |
| Veto LLD | 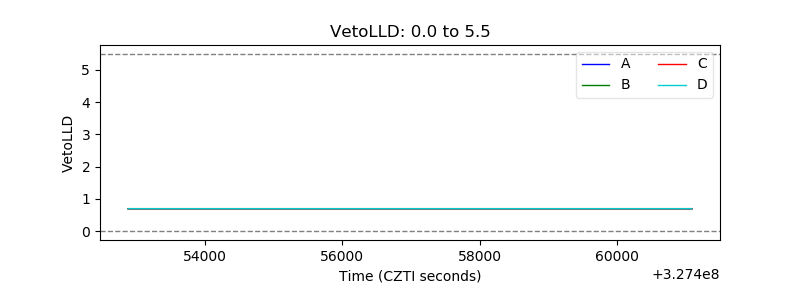 |
| Alpha Counter | 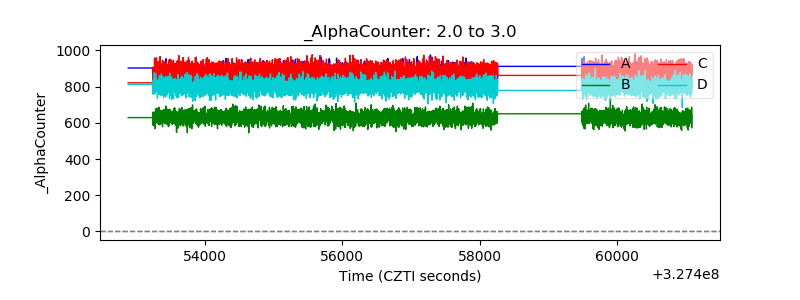 |
| _CPM_Rate | 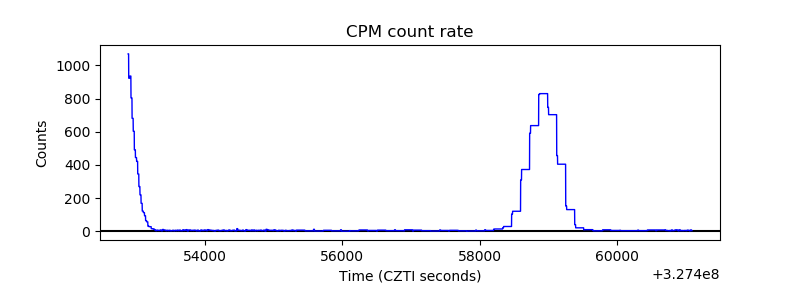 |
| CZT Counter | 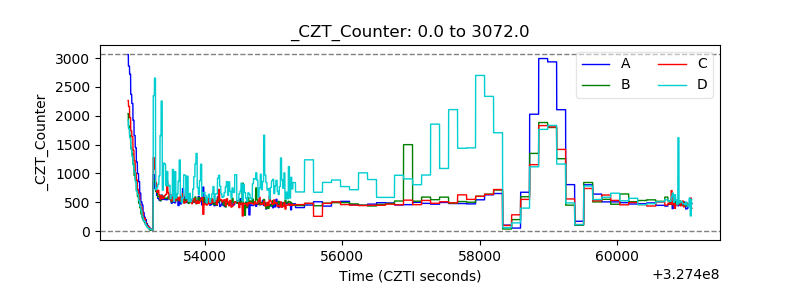 |
| +2.5 Volts monitor |  |
| +5 Volts monitor |  |
| _ROLL_ROT | 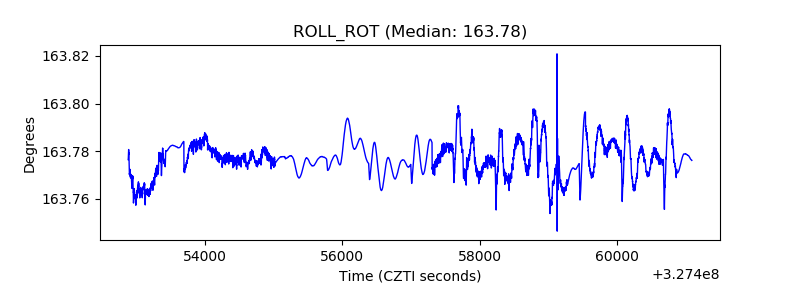 |
| _Roll_DEC | 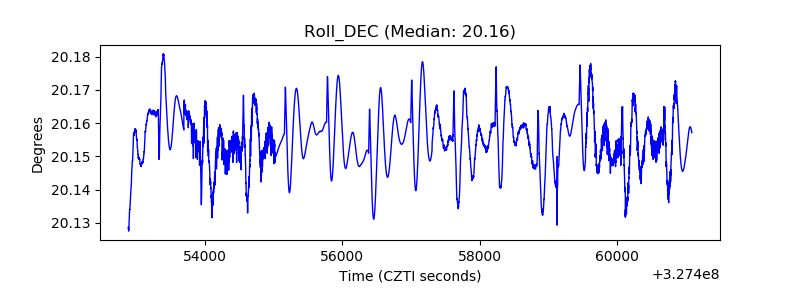 |
| _Roll_RA | 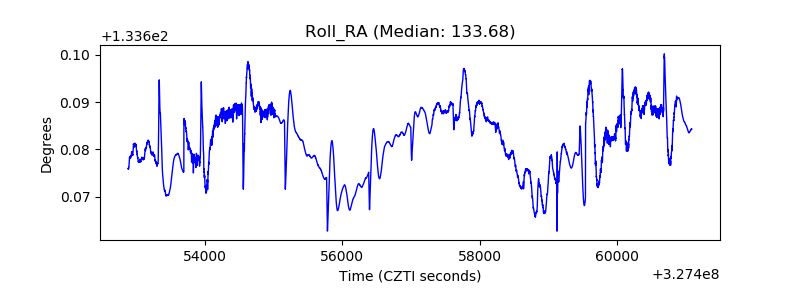 |
| Veto Counter | 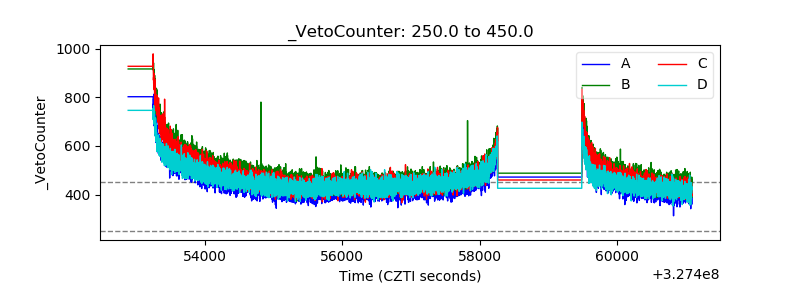 |