| Param | Original file | Final file |
|---|---|---|
| Filename | modeM0/AS1T03_206T01_9000003672_25073cztM0_level2.evt | modeM0/AS1T03_206T01_9000003672_25073cztM0_level2_quad_clean.evt |
| Size (bytes) | 611,144,640 | 71,645,760 |
| Size | 582.8 MB | 68.3 MB |
| Events in quadrant A | 3,430,565 | 437,060 |
| Events in quadrant B | 3,616,658 | 442,929 |
| Events in quadrant C | 3,471,547 | 416,585 |
| Events in quadrant D | 7,518,382 | 387,671 |
| Mode M9 | |||
|---|---|---|---|
| Quadrant | BADHDUFLAG | Total packets | Discarded packets |
| A | 0 | 11 | 0 |
| B | 0 | 12 | 0 |
| C | 0 | 12 | 0 |
| D | 0 | 12 | 0 |
| Mode SS | |||
|---|---|---|---|
| Quadrant | BADHDUFLAG | Total packets | Discarded packets |
| A | 0 | 140 | 0 |
| B | 0 | 140 | 0 |
| C | 0 | 140 | 0 |
| D | 0 | 140 | 0 |
| Mode M0 | |||
|---|---|---|---|
| Quadrant | BADHDUFLAG | Total packets | Discarded packets |
| A | 0 | 14421 | 2 |
| B | 0 | 14839 | 2 |
| C | 0 | 14468 | 3 |
| D | 0 | 26950 | 2 |
| Quadrant | Total seconds | Saturated seconds | Saturation percentage |
|---|---|---|---|
| A | 6965 | 95 | 1.363963% |
| B | 6965 | 149 | 2.139268% |
| C | 6964 | 110 | 1.579552% |
| D | 6964 | 1036 | 14.876508% |
Noise dominated data is calculated using 1-second bins in cleaned event files. If a bin has >2000 counts, and if more than 50% of those come from <1% of pixels, then it is considered to be noise-dominated and hence unusable.
| Quadrant | # 1 sec bins | Bins with >0 counts | Bins with >2000 counts | High rate bins dominated by noise | Noise dominated (total time) | Noise dominated (detector-on time) | Marked lightcurve |
|---|---|---|---|---|---|---|---|
| A | 7785 | 6966 | 0 | 0 | 0.00% | 0.00% | 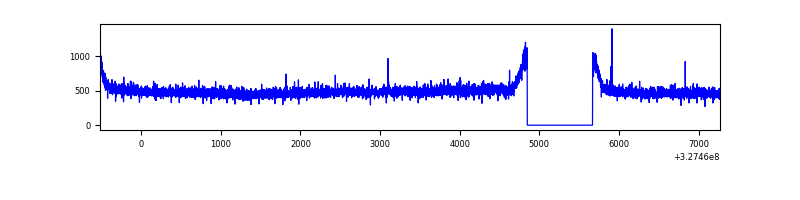 |
| B | 7785 | 6966 | 18 | 18 | 0.23% | 0.26% | 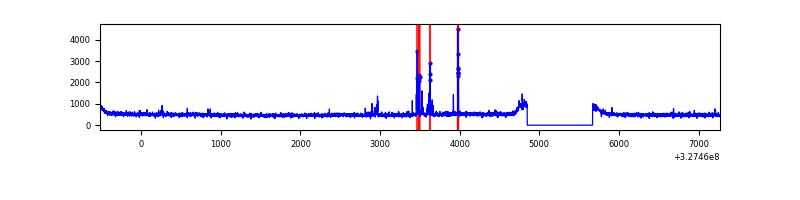 |
| C | 7784 | 6965 | 0 | 0 | 0.00% | 0.00% |  |
| D | 7784 | 6965 | 1034 | 1034 | 13.28% | 14.85% | 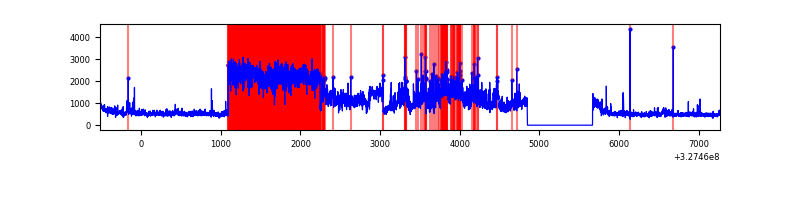 |
Top three noisy pixels from each quadrant. If the there are fewer than three noisy pixels in the level2.evt file, extra rows are filled as -1
| Pixel properties | Quadrant properties | ||||||
|---|---|---|---|---|---|---|---|
| Quadrant | DetID | PixID | Counts | Sigma | Mean | Median | Sigma |
| A | 13 | 254 | 11270 | 58.49 | 887 | 869 | 177.8 |
| A | 3 | 137 | 8069 | 40.49 | 887 | 869 | 177.8 |
| A | 0 | 226 | 7666 | 38.23 | 887 | 869 | 177.8 |
| B | 10 | 249 | 54327 | 312.55 | 885 | 863 | 171.1 |
| B | 3 | 64 | 48496 | 278.46 | 885 | 863 | 171.1 |
| B | 5 | 172 | 27609 | 156.36 | 885 | 863 | 171.1 |
| C | 14 | 238 | 135311 | 672.77 | 845 | 851 | 199.9 |
| C | 7 | 247 | 15879 | 75.19 | 845 | 851 | 199.9 |
| C | 2 | 16 | 13272 | 62.15 | 845 | 851 | 199.9 |
| D | 9 | 35 | 3086598 | 15282.35 | 829 | 804 | 201.9 |
| D | 8 | 195 | 787328 | 3895.25 | 829 | 804 | 201.9 |
| D | 1 | 52 | 251795 | 1243.03 | 829 | 804 | 201.9 |
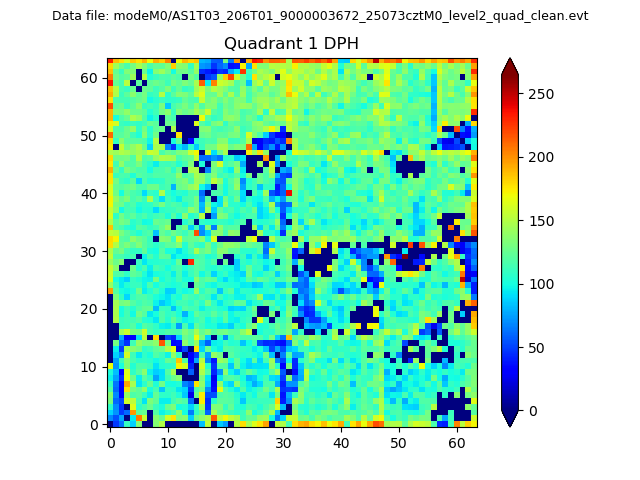
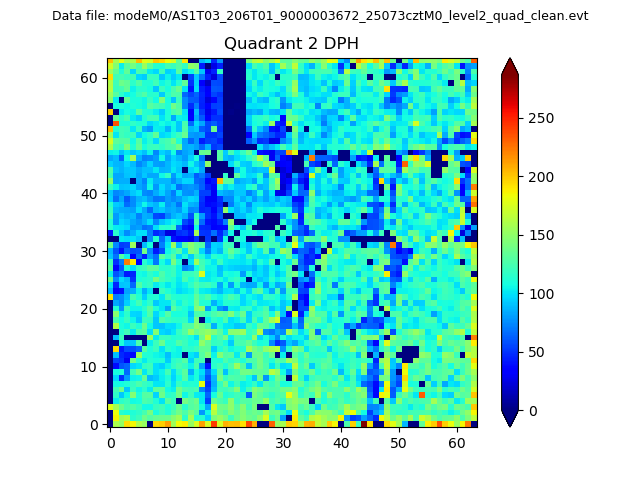
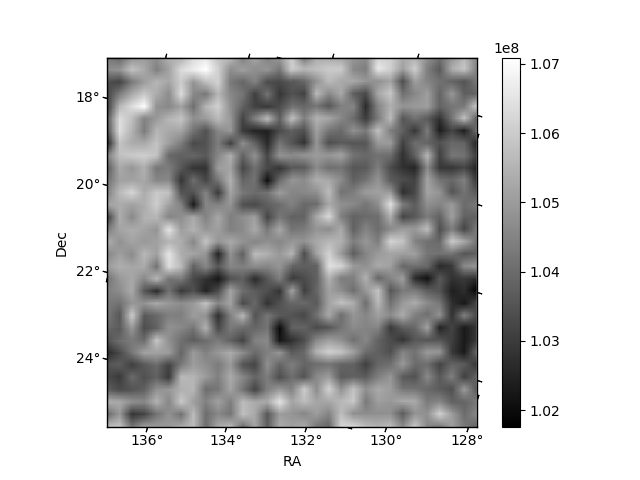
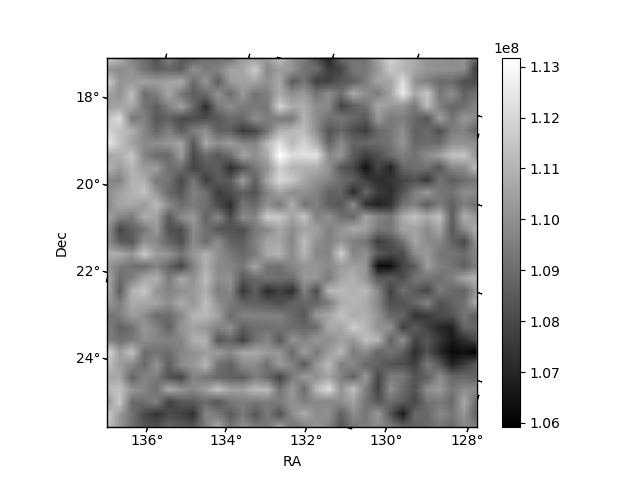
Histogram calculated using DETX and DETY for each event in the final _common_clean file
| Quadrant A | 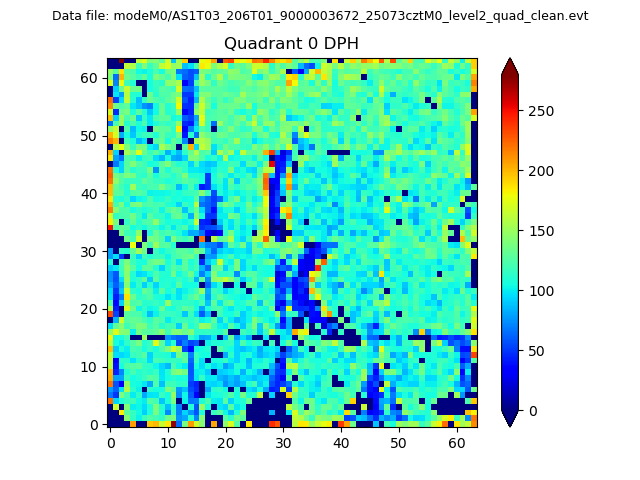 |
 |
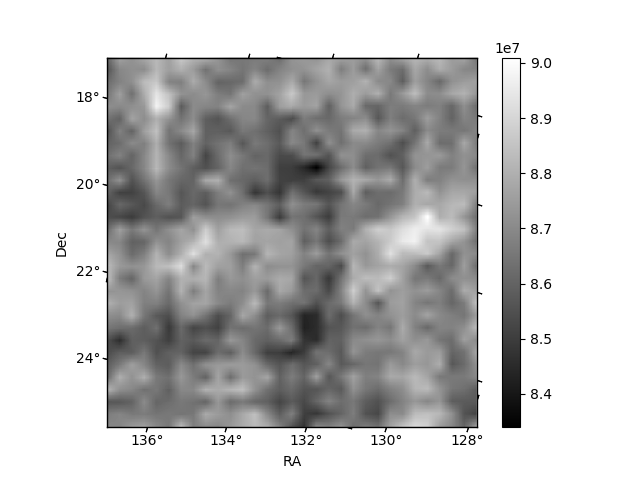
Quadrant B |
|---|---|---|---|
| Quadrant D |  |
 |
Quadrant C |
| Plot type | Count rate plots | Images |
|---|---|---|
| Comparison with Poisson distribution Blue bars denote a histogram of data divided into 1 sec bins. Red curve is a Poisson curve with rate = median count rate of data. |
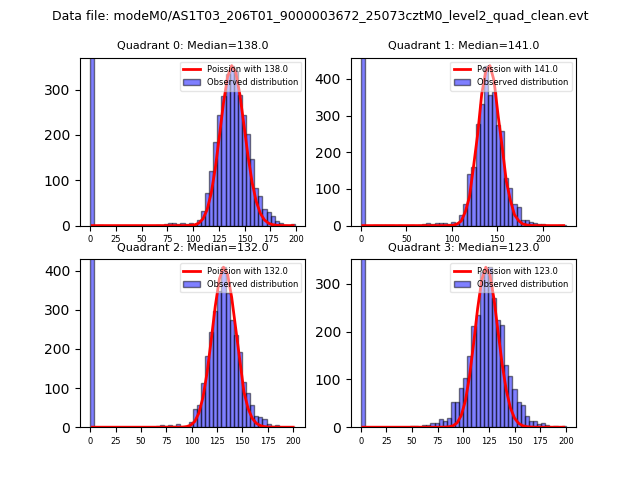 |
 |
| Quadrant-wise count rates Data is divided into 100 sec bins |
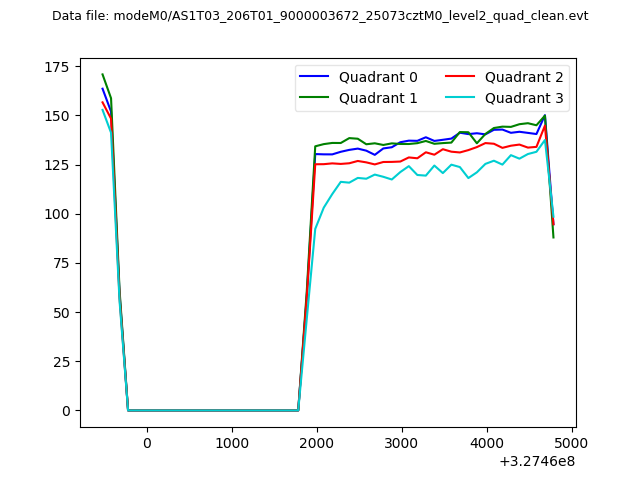 |
|
| Module-wise count rates for Quadrant A Data is divided into 100 sec bins |
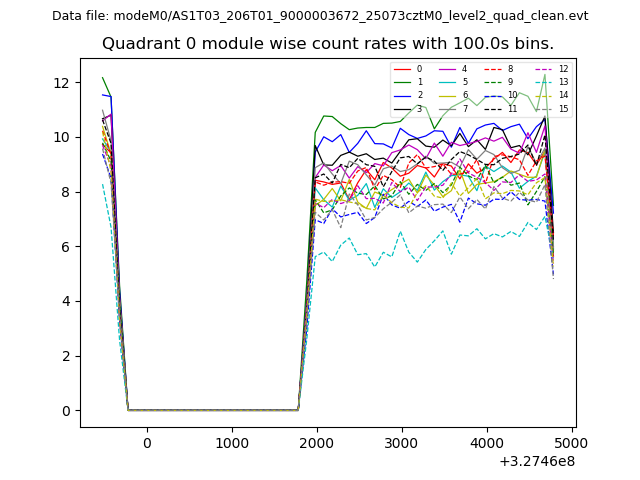 |
 |
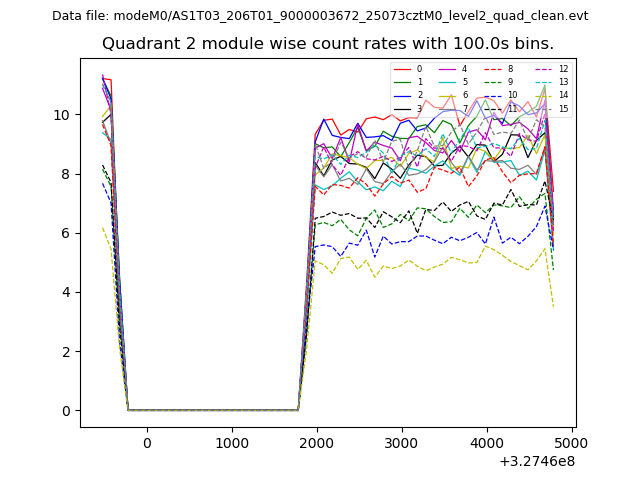
| Module-wise count rates for Quadrant B Data is divided into 100 sec bins |
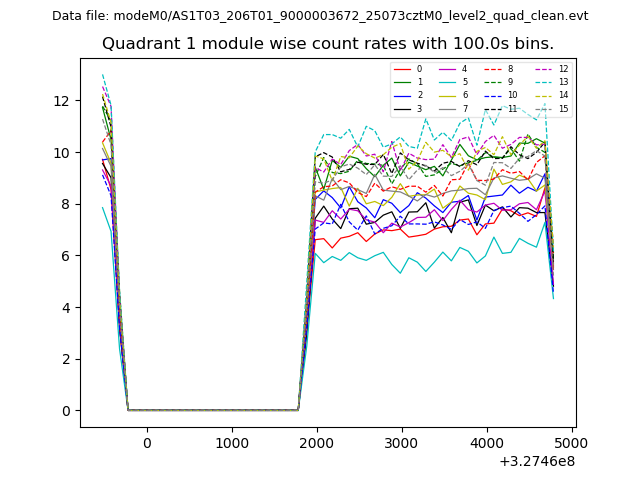 |
 |
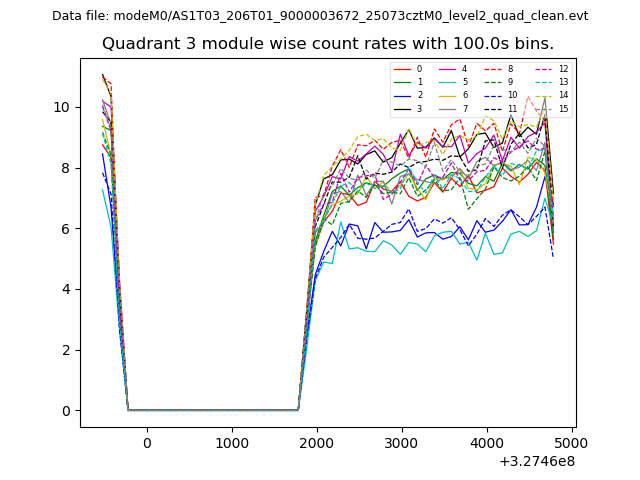
| Module-wise count rates for Quadrant C Data is divided into 100 sec bins |
 |
 |
| Module-wise count rates for Quadrant D Data is divided into 100 sec bins |
 |
 |
| Parameter | Plot |
|---|---|
| CZT HV Monitor | 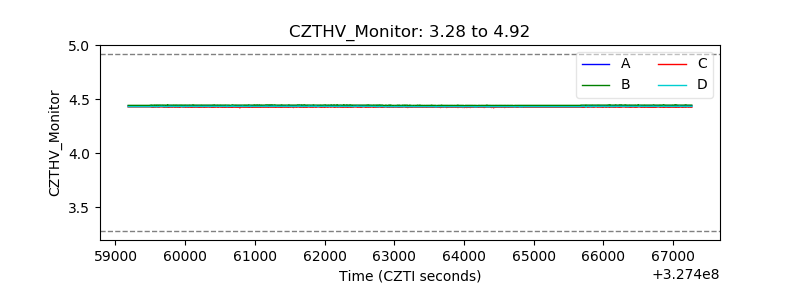 |
| D_VDD | 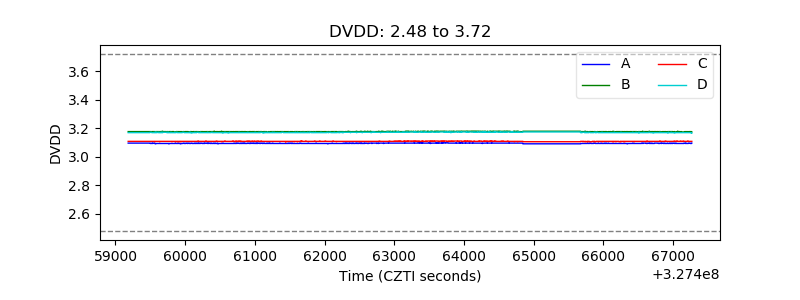 |
| Temperature 1 | 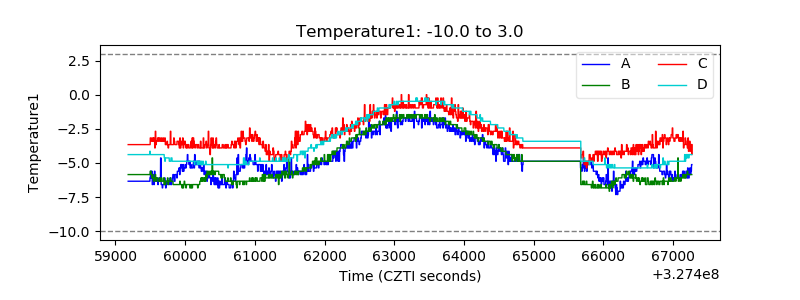 |
| Veto HV Monitor | 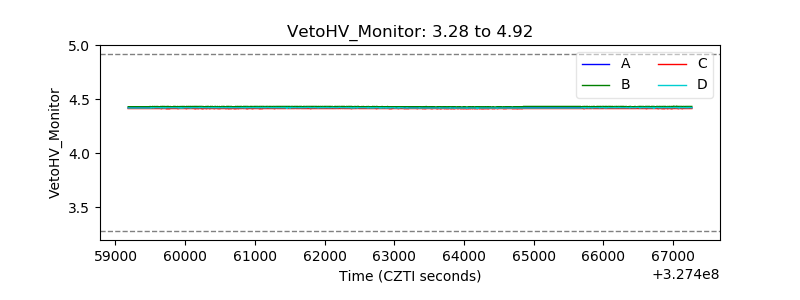 |
| Veto LLD | 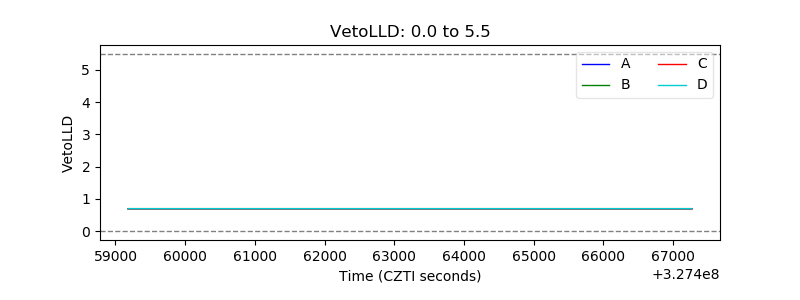 |
| Alpha Counter | 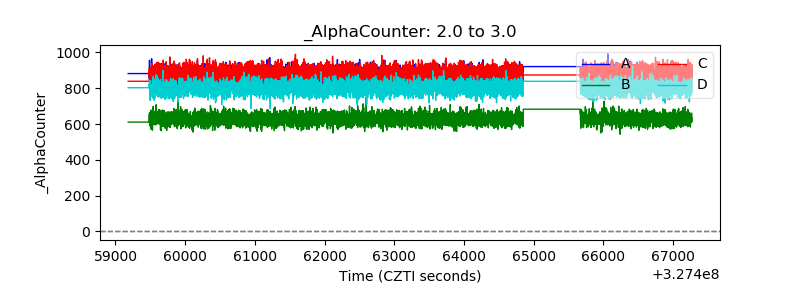 |
| _CPM_Rate | 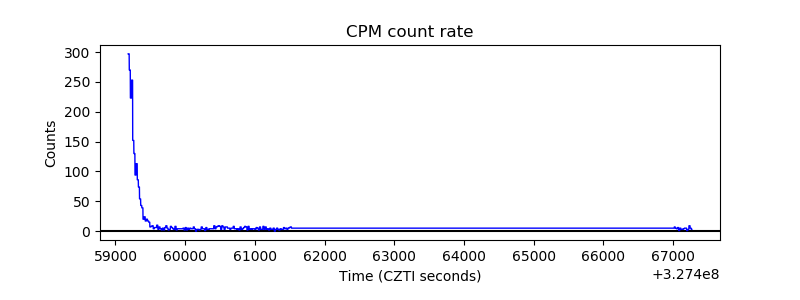 |
| CZT Counter |  |
| +2.5 Volts monitor | 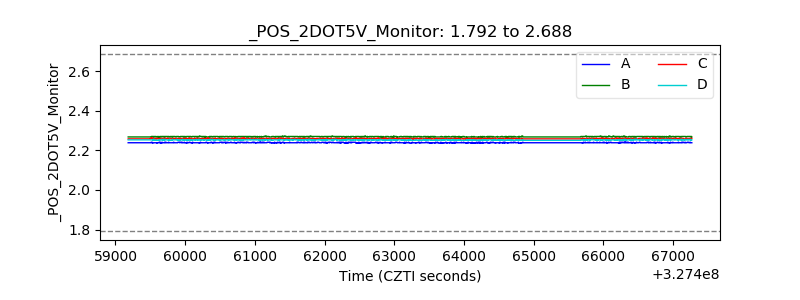 |
| +5 Volts monitor |  |
| _ROLL_ROT | 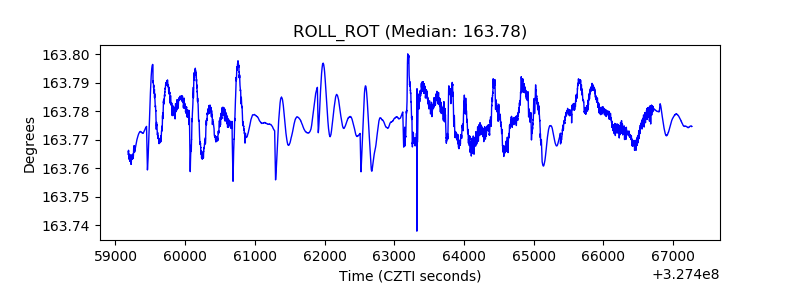 |
| _Roll_DEC | 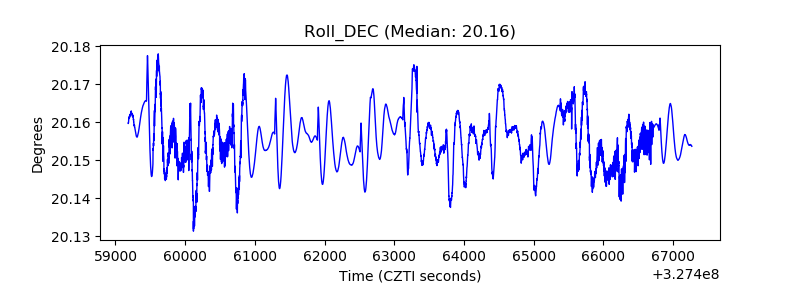 |
| _Roll_RA |  |
| Veto Counter | 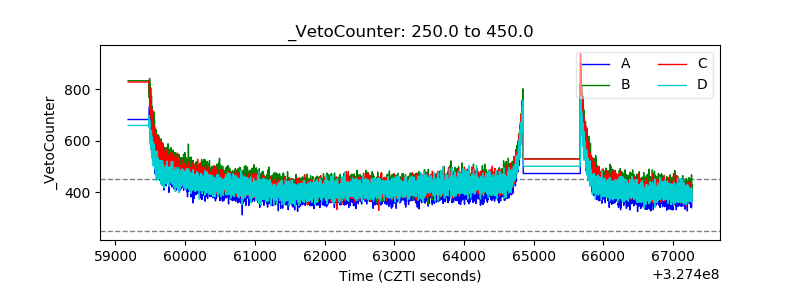 |