| Param | Original file | Final file |
|---|---|---|
| Filename | modeM0/AS1T03_206T01_9000003672_25074cztM0_level2.evt | modeM0/AS1T03_206T01_9000003672_25074cztM0_level2_quad_clean.evt |
| Size (bytes) | 578,767,680 | 77,924,160 |
| Size | 552.0 MB | 74.3 MB |
| Events in quadrant A | 3,586,355 | 476,095 |
| Events in quadrant B | 3,676,253 | 483,876 |
| Events in quadrant C | 3,630,482 | 456,343 |
| Events in quadrant D | 6,132,054 | 427,272 |
| Mode M9 | |||
|---|---|---|---|
| Quadrant | BADHDUFLAG | Total packets | Discarded packets |
| A | 0 | 8 | 0 |
| B | 0 | 9 | 0 |
| C | 0 | 9 | 0 |
| D | 0 | 9 | 0 |
| Mode SS | |||
|---|---|---|---|
| Quadrant | BADHDUFLAG | Total packets | Discarded packets |
| A | 0 | 150 | 0 |
| B | 0 | 150 | 0 |
| C | 0 | 150 | 0 |
| D | 0 | 150 | 0 |
| Mode M0 | |||
|---|---|---|---|
| Quadrant | BADHDUFLAG | Total packets | Discarded packets |
| A | 0 | 15326 | 2 |
| B | 0 | 15453 | 2 |
| C | 0 | 15368 | 2 |
| D | 0 | 23159 | 2 |
| Quadrant | Total seconds | Saturated seconds | Saturation percentage |
|---|---|---|---|
| A | 7411 | 169 | 2.280394% |
| B | 7411 | 222 | 2.995547% |
| C | 7411 | 186 | 2.509783% |
| D | 7411 | 748 | 10.093105% |
Noise dominated data is calculated using 1-second bins in cleaned event files. If a bin has >2000 counts, and if more than 50% of those come from <1% of pixels, then it is considered to be noise-dominated and hence unusable.
| Quadrant | # 1 sec bins | Bins with >0 counts | Bins with >2000 counts | High rate bins dominated by noise | Noise dominated (total time) | Noise dominated (detector-on time) | Marked lightcurve |
|---|---|---|---|---|---|---|---|
| A | 7806 | 7411 | 0 | 0 | 0.00% | 0.00% | 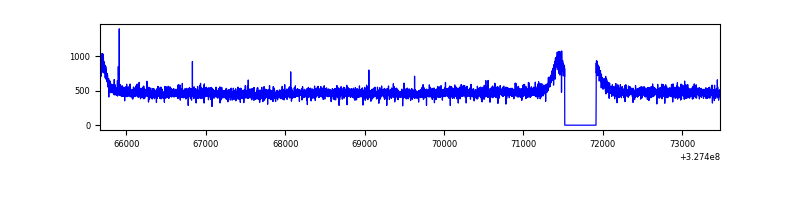 |
| B | 7806 | 7411 | 1 | 1 | 0.01% | 0.01% | 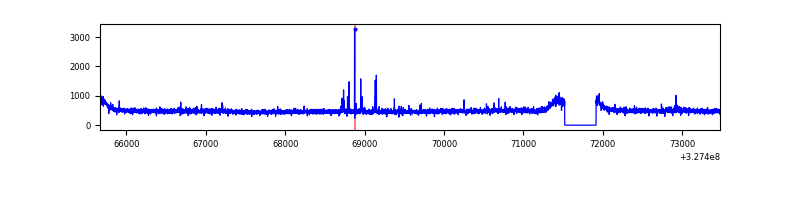 |
| C | 7806 | 7411 | 0 | 0 | 0.00% | 0.00% | 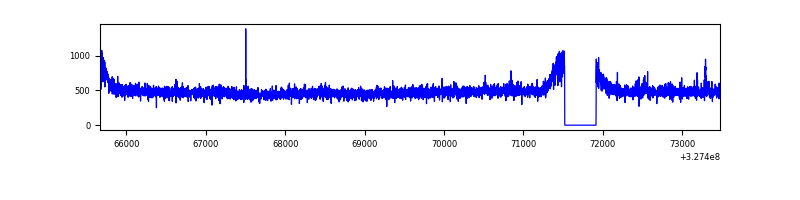 |
| D | 7806 | 7411 | 454 | 454 | 5.82% | 6.13% | 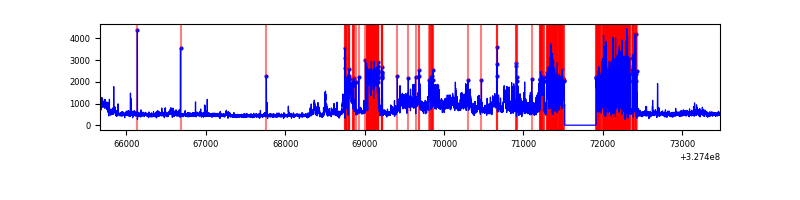 |
Top three noisy pixels from each quadrant. If the there are fewer than three noisy pixels in the level2.evt file, extra rows are filled as -1
| Pixel properties | Quadrant properties | ||||||
|---|---|---|---|---|---|---|---|
| Quadrant | DetID | PixID | Counts | Sigma | Mean | Median | Sigma |
| A | 13 | 254 | 11151 | 54.8 | 929 | 908 | 186.9 |
| A | 3 | 137 | 8747 | 41.94 | 929 | 908 | 186.9 |
| A | 0 | 226 | 7927 | 37.55 | 929 | 908 | 186.9 |
| B | 12 | 111 | 22027 | 117.09 | 926 | 902 | 180.4 |
| B | 11 | 111 | 19834 | 104.94 | 926 | 902 | 180.4 |
| B | 10 | 251 | 19141 | 101.1 | 926 | 902 | 180.4 |
| C | 14 | 238 | 139247 | 659.0 | 887 | 890 | 209.9 |
| C | 3 | 233 | 15524 | 69.7 | 887 | 890 | 209.9 |
| C | 7 | 247 | 14860 | 66.54 | 887 | 890 | 209.9 |
| D | 9 | 35 | 2170045 | 10294.45 | 861 | 836 | 210.7 |
| D | 8 | 195 | 305354 | 1445.16 | 861 | 836 | 210.7 |
| D | 1 | 52 | 261151 | 1235.38 | 861 | 836 | 210.7 |
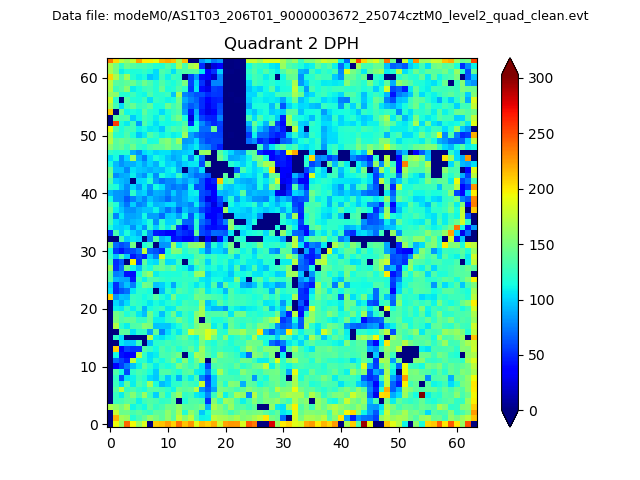
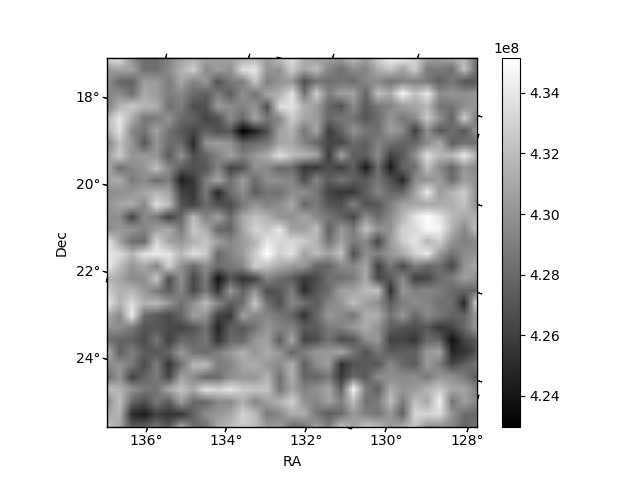
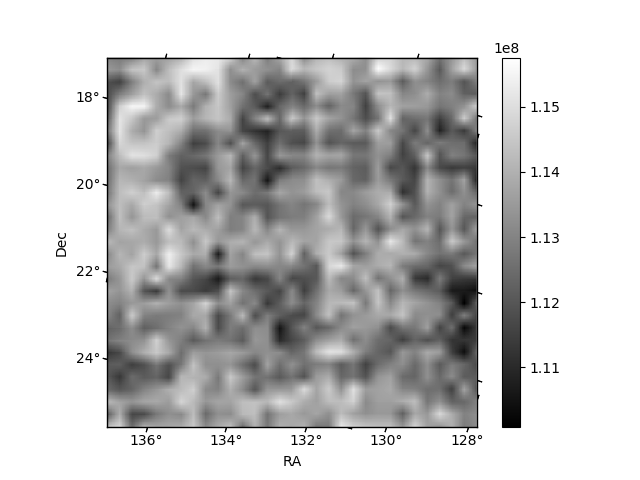
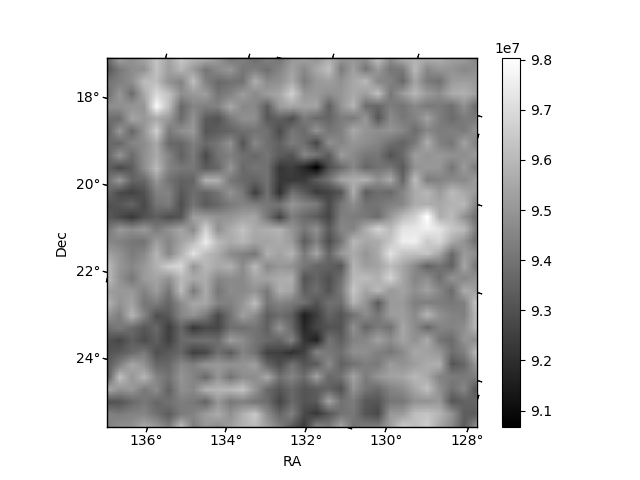
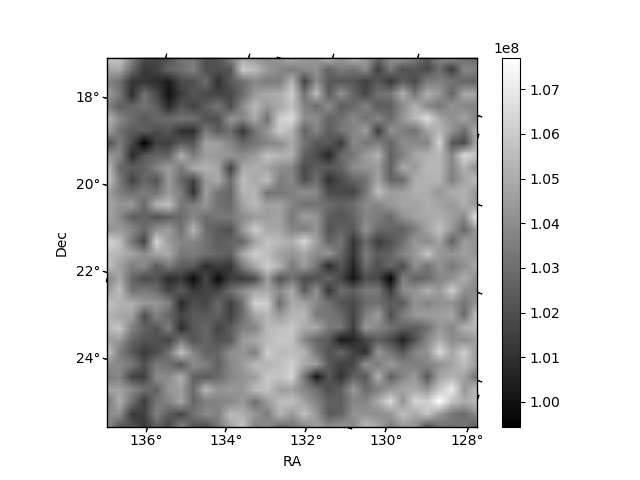
Histogram calculated using DETX and DETY for each event in the final _common_clean file
| Quadrant A | 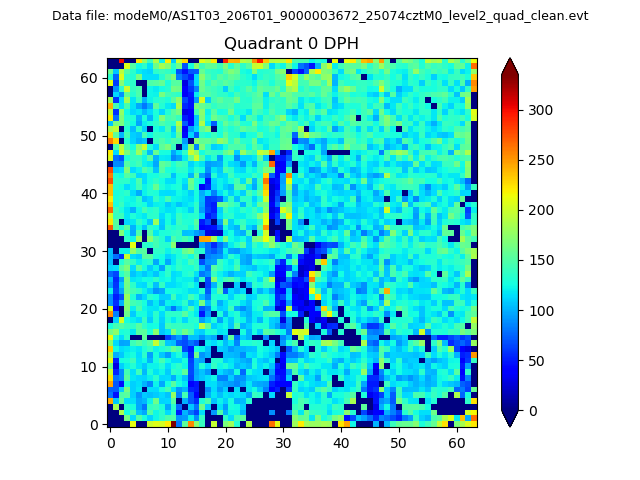 |
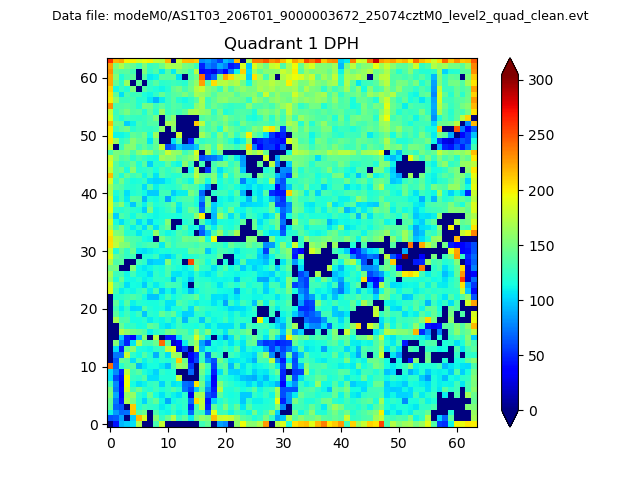 |
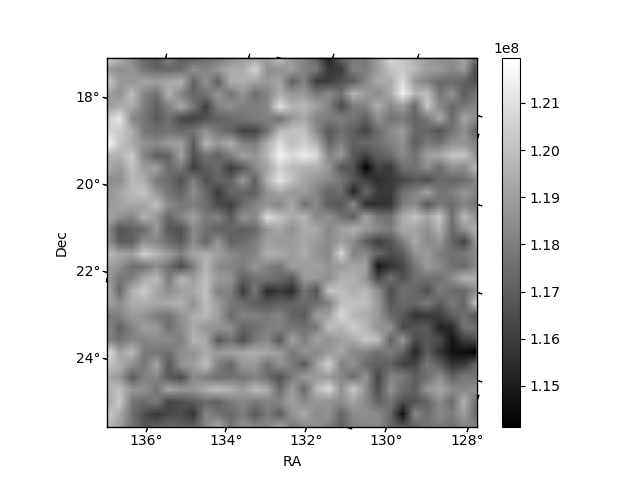
Quadrant B |
|---|---|---|---|
| Quadrant D | 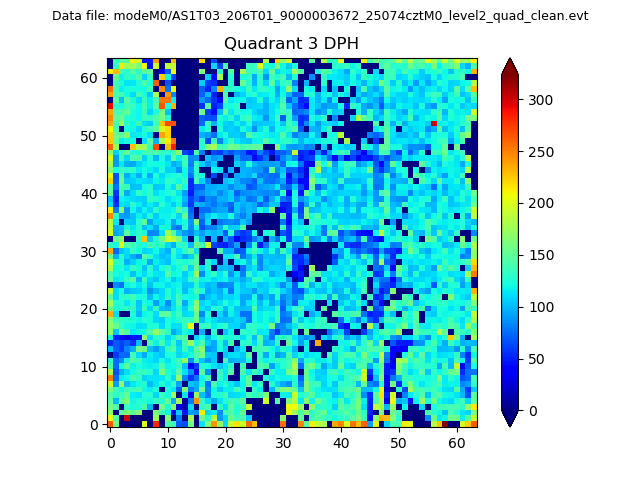 |
 |
Quadrant C |
| Plot type | Count rate plots | Images |
|---|---|---|
| Comparison with Poisson distribution Blue bars denote a histogram of data divided into 1 sec bins. Red curve is a Poisson curve with rate = median count rate of data. |
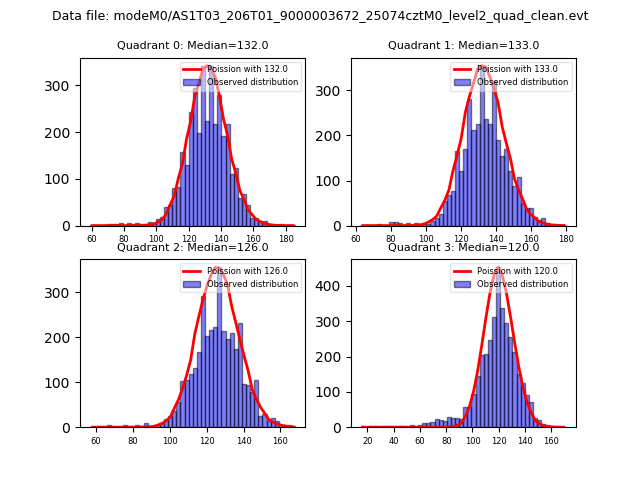 |
 |
| Quadrant-wise count rates Data is divided into 100 sec bins |
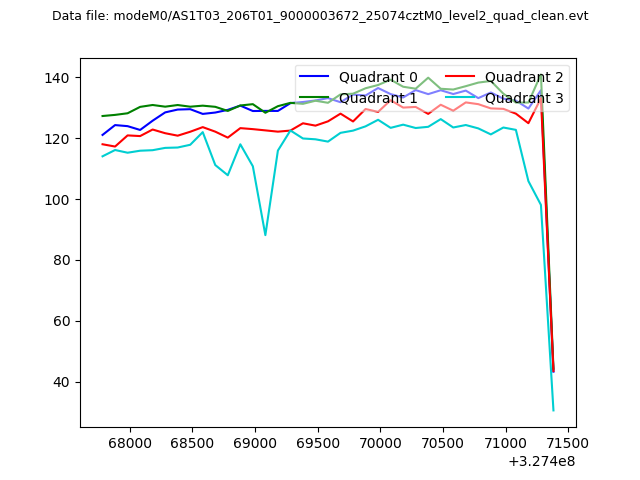 |
|
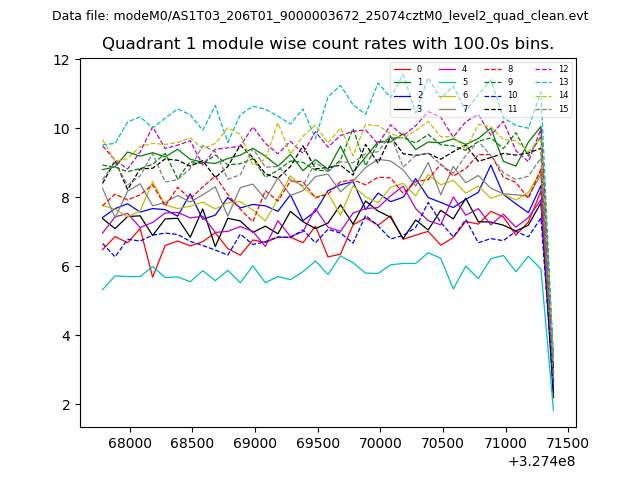
| Module-wise count rates for Quadrant A Data is divided into 100 sec bins |
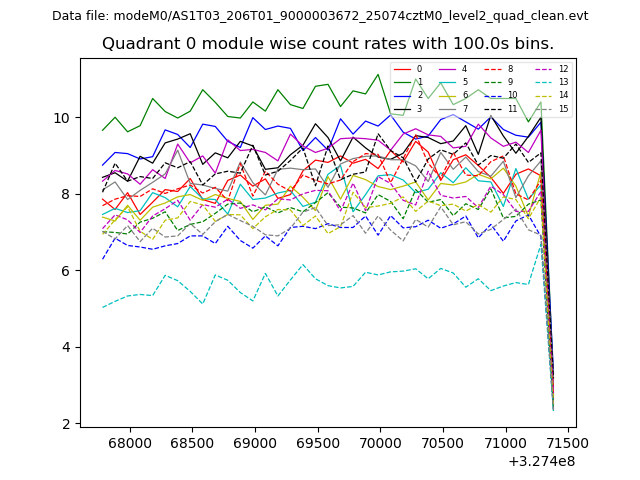 |
 |
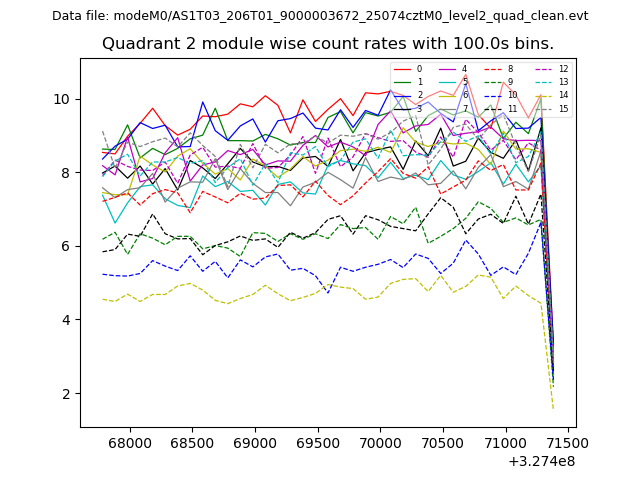
| Module-wise count rates for Quadrant B Data is divided into 100 sec bins |
 |
 |
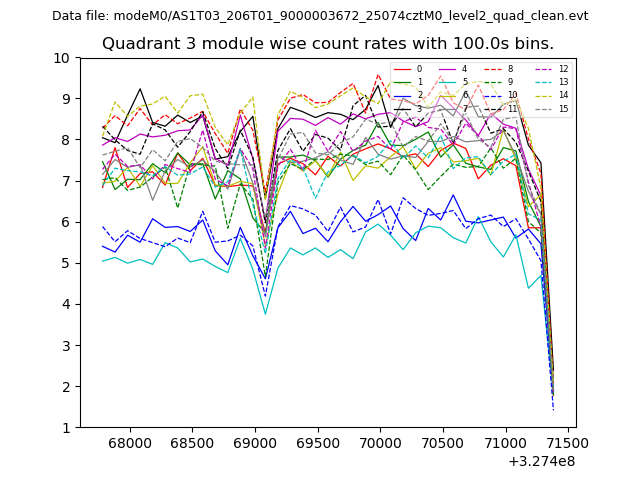
| Module-wise count rates for Quadrant C Data is divided into 100 sec bins |
 |
 |
| Module-wise count rates for Quadrant D Data is divided into 100 sec bins |
 |
 |
| Parameter | Plot |
|---|---|
| CZT HV Monitor | 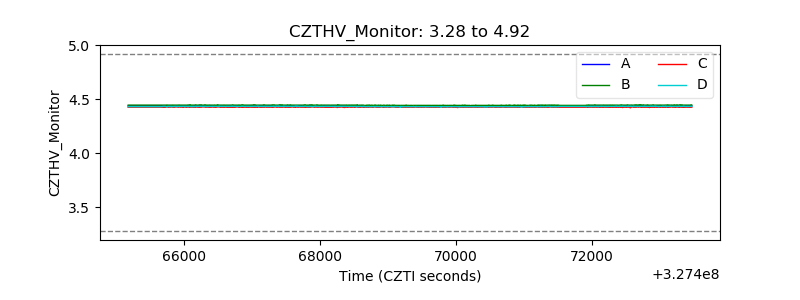 |
| D_VDD |  |
| Temperature 1 | 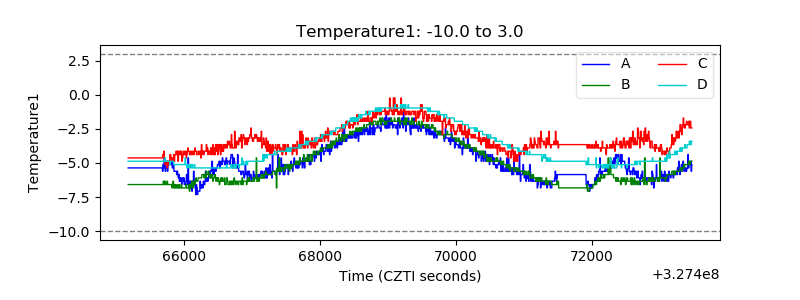 |
| Veto HV Monitor | 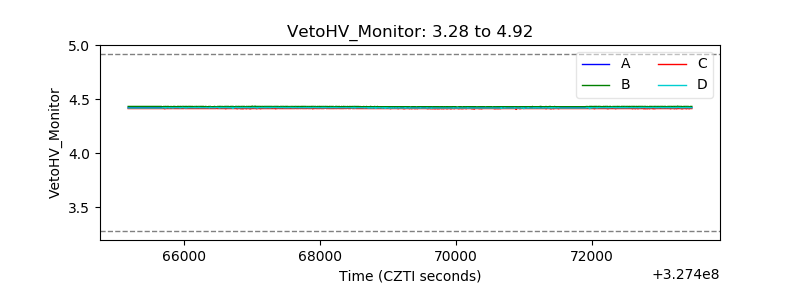 |
| Veto LLD | 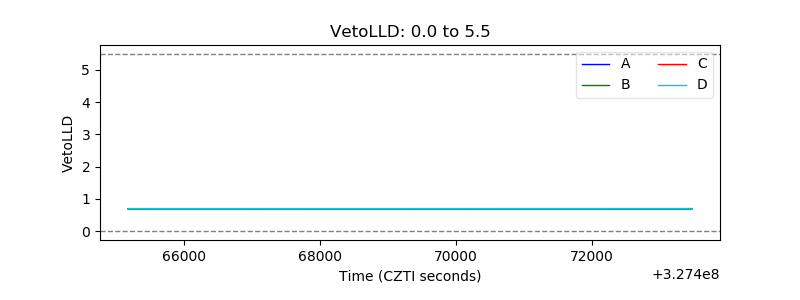 |
| Alpha Counter | 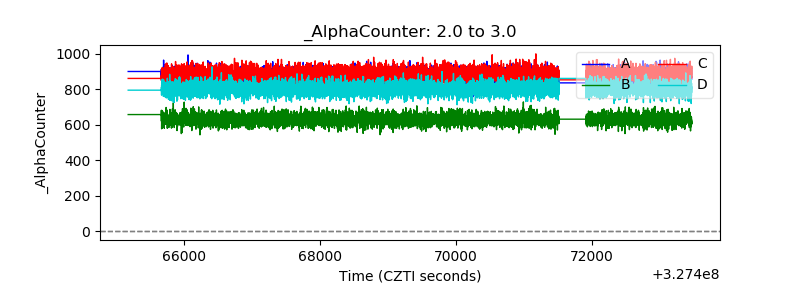 |
| _CPM_Rate | 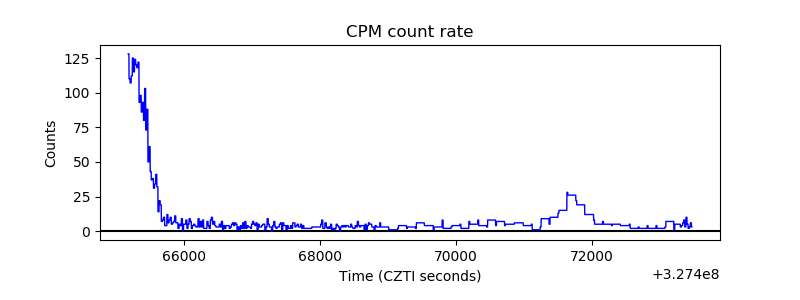 |
| CZT Counter | 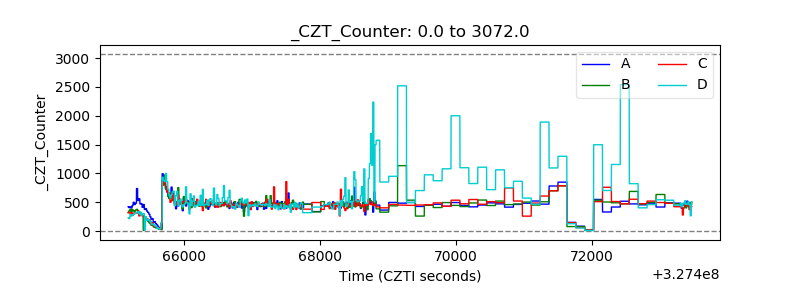 |
| +2.5 Volts monitor |  |
| +5 Volts monitor |  |
| _ROLL_ROT | 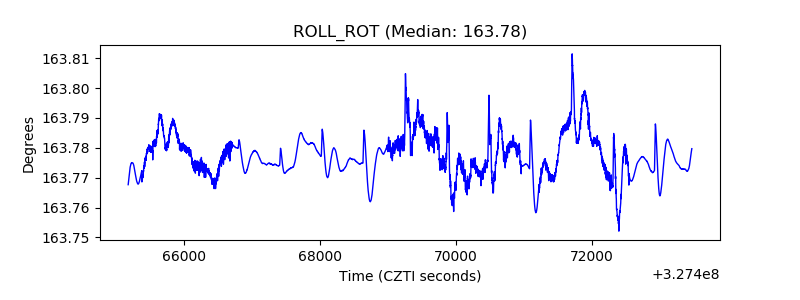 |
| _Roll_DEC | 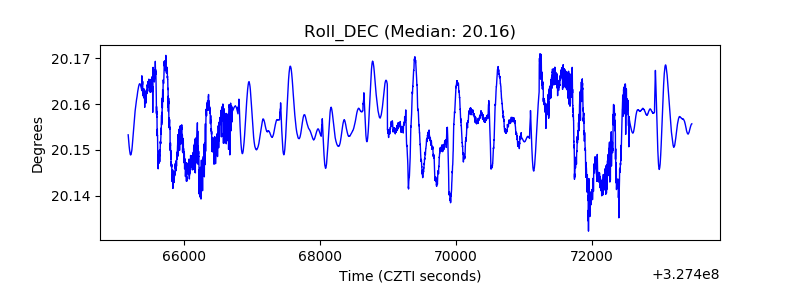 |
| _Roll_RA | 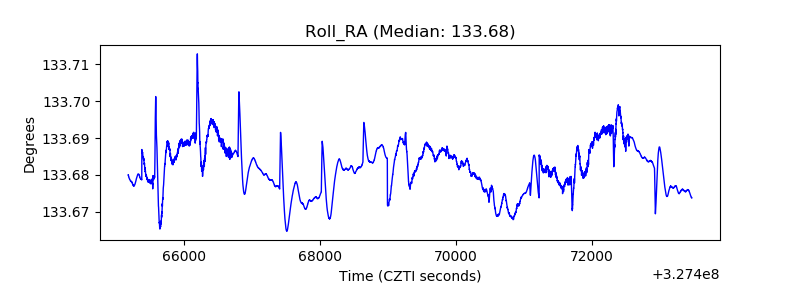 |
| Veto Counter | 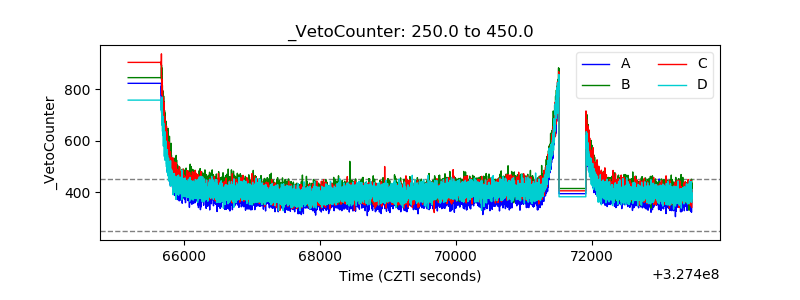 |