| Param | Original file | Final file |
|---|---|---|
| Filename | modeM0/AS1T03_206T01_9000003672_25075cztM0_level2.evt | modeM0/AS1T03_206T01_9000003672_25075cztM0_level2_quad_clean.evt |
| Size (bytes) | 620,003,520 | 82,903,680 |
| Size | 591.3 MB | 79.1 MB |
| Events in quadrant A | 3,842,817 | 504,482 |
| Events in quadrant B | 3,918,606 | 514,186 |
| Events in quadrant C | 3,894,453 | 484,626 |
| Events in quadrant D | 6,592,022 | 458,119 |
| Mode M9 | |||
|---|---|---|---|
| Quadrant | BADHDUFLAG | Total packets | Discarded packets |
| A | 0 | 6 | 0 |
| B | 0 | 6 | 0 |
| C | 0 | 6 | 0 |
| D | 0 | 6 | 0 |
| Mode SS | |||
|---|---|---|---|
| Quadrant | BADHDUFLAG | Total packets | Discarded packets |
| A | 0 | 162 | 0 |
| B | 0 | 162 | 0 |
| C | 0 | 162 | 0 |
| D | 0 | 162 | 0 |
| Mode M0 | |||
|---|---|---|---|
| Quadrant | BADHDUFLAG | Total packets | Discarded packets |
| A | 0 | 16456 | 3 |
| B | 0 | 16560 | 3 |
| C | 0 | 16514 | 3 |
| D | 0 | 24801 | 3 |
| Quadrant | Total seconds | Saturated seconds | Saturation percentage |
|---|---|---|---|
| A | 7900 | 385 | 4.873418% |
| B | 7901 | 425 | 5.379066% |
| C | 7901 | 426 | 5.391723% |
| D | 7900 | 880 | 11.139241% |
Noise dominated data is calculated using 1-second bins in cleaned event files. If a bin has >2000 counts, and if more than 50% of those come from <1% of pixels, then it is considered to be noise-dominated and hence unusable.
| Quadrant | # 1 sec bins | Bins with >0 counts | Bins with >2000 counts | High rate bins dominated by noise | Noise dominated (total time) | Noise dominated (detector-on time) | Marked lightcurve |
|---|---|---|---|---|---|---|---|
| A | 8375 | 7902 | 0 | 0 | 0.00% | 0.00% | 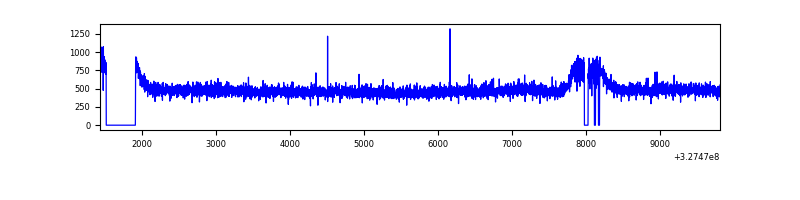 |
| B | 8376 | 7904 | 0 | 0 | 0.00% | 0.00% | 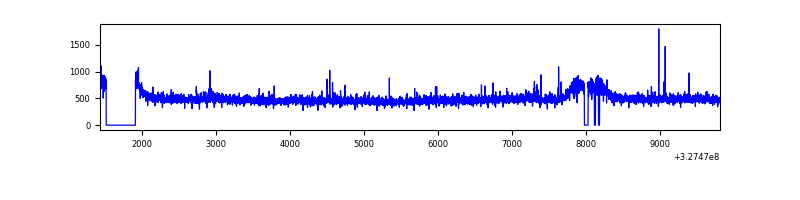 |
| C | 8376 | 7904 | 0 | 0 | 0.00% | 0.00% | 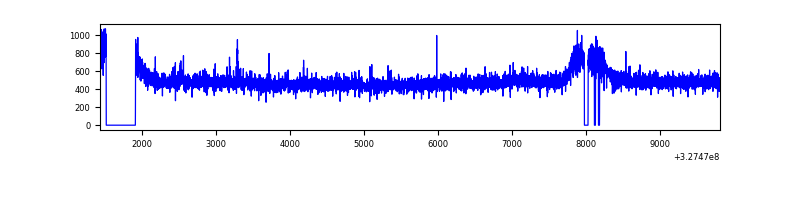 |
| D | 8375 | 7903 | 461 | 461 | 5.50% | 5.83% | 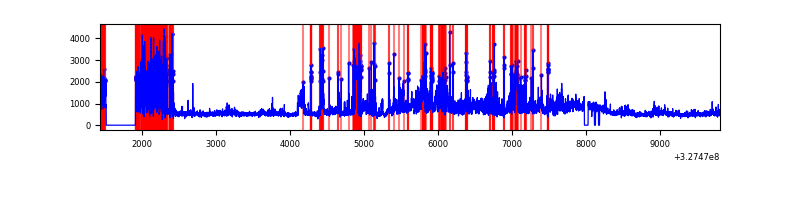 |
Top three noisy pixels from each quadrant. If the there are fewer than three noisy pixels in the level2.evt file, extra rows are filled as -1
| Pixel properties | Quadrant properties | ||||||
|---|---|---|---|---|---|---|---|
| Quadrant | DetID | PixID | Counts | Sigma | Mean | Median | Sigma |
| A | 13 | 254 | 12402 | 56.92 | 993 | 968 | 200.9 |
| A | 3 | 137 | 9705 | 43.49 | 993 | 968 | 200.9 |
| A | 0 | 226 | 8541 | 37.7 | 993 | 968 | 200.9 |
| B | 12 | 111 | 24204 | 121.14 | 990 | 962 | 191.9 |
| B | 11 | 111 | 21694 | 108.05 | 990 | 962 | 191.9 |
| B | 3 | 64 | 20589 | 102.29 | 990 | 962 | 191.9 |
| C | 14 | 238 | 150141 | 662.21 | 953 | 955 | 225.3 |
| C | 7 | 247 | 12464 | 51.09 | 953 | 955 | 225.3 |
| C | 3 | 233 | 10541 | 42.55 | 953 | 955 | 225.3 |
| D | 9 | 35 | 1984990 | 8722.67 | 931 | 902 | 227.5 |
| D | 8 | 195 | 475260 | 2085.43 | 931 | 902 | 227.5 |
| D | 1 | 52 | 399301 | 1751.49 | 931 | 902 | 227.5 |
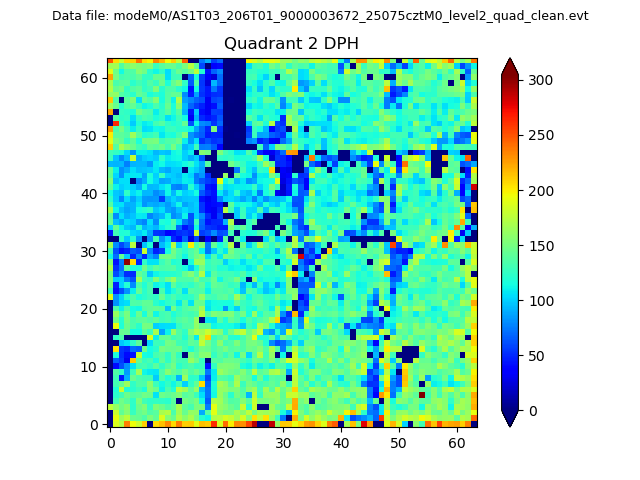
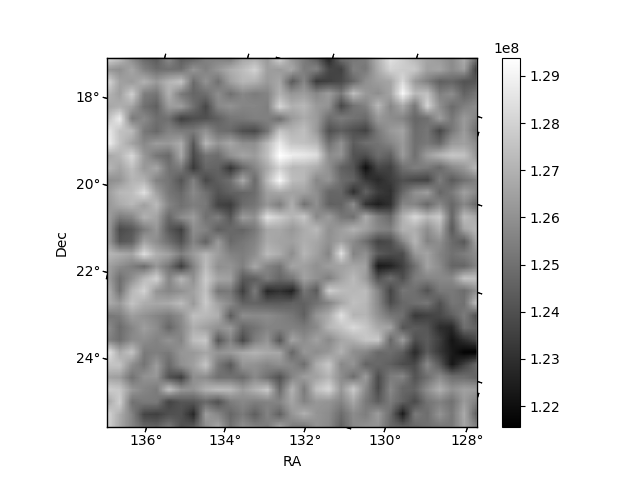
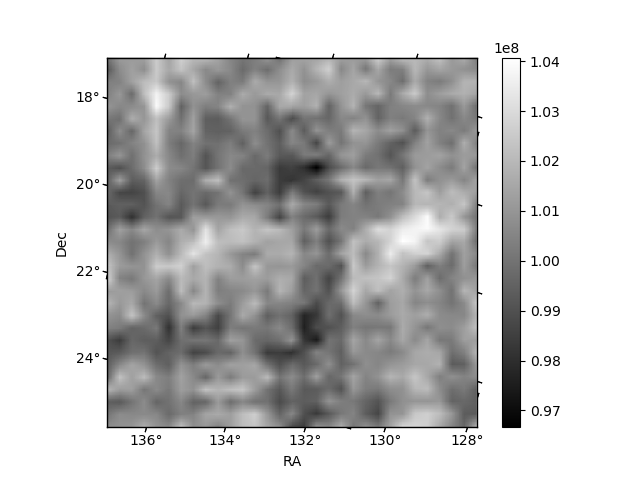
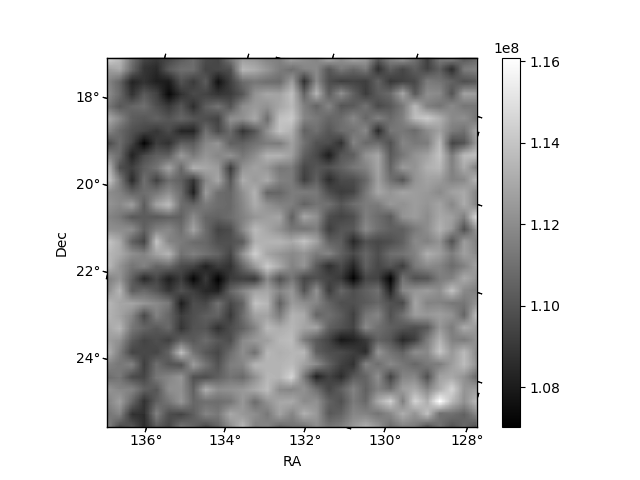
Histogram calculated using DETX and DETY for each event in the final _common_clean file
| Quadrant A | 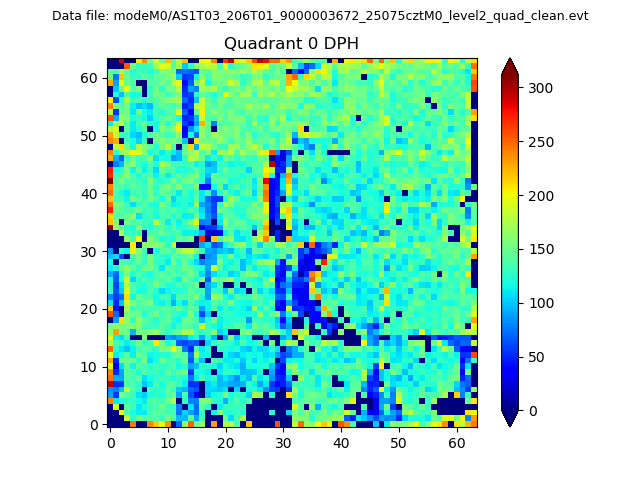 |
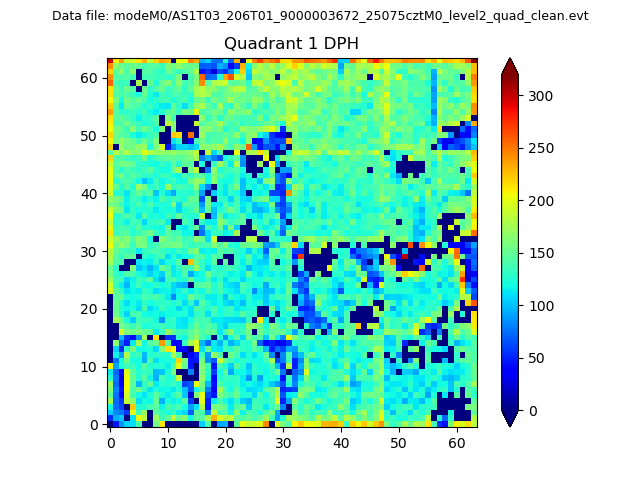 |
Quadrant B |
|---|---|---|---|
| Quadrant D | 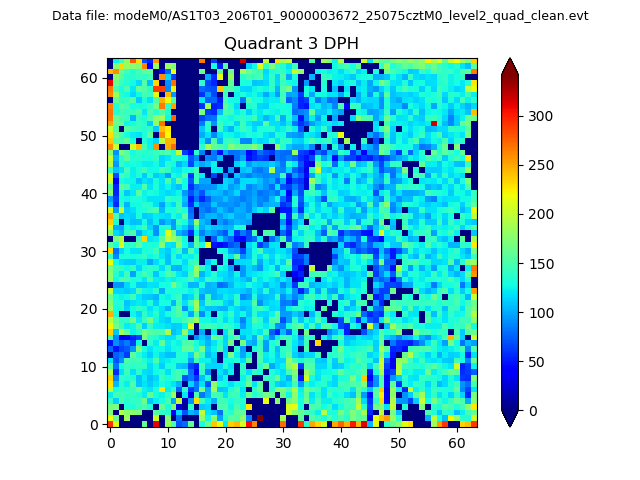 |
 |
Quadrant C |
| Plot type | Count rate plots | Images |
|---|---|---|
| Comparison with Poisson distribution Blue bars denote a histogram of data divided into 1 sec bins. Red curve is a Poisson curve with rate = median count rate of data. |
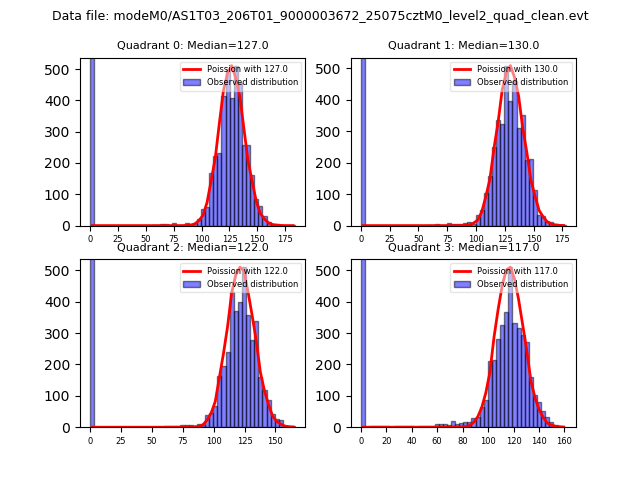 |
 |
| Quadrant-wise count rates Data is divided into 100 sec bins |
 |
|
| Module-wise count rates for Quadrant A Data is divided into 100 sec bins |
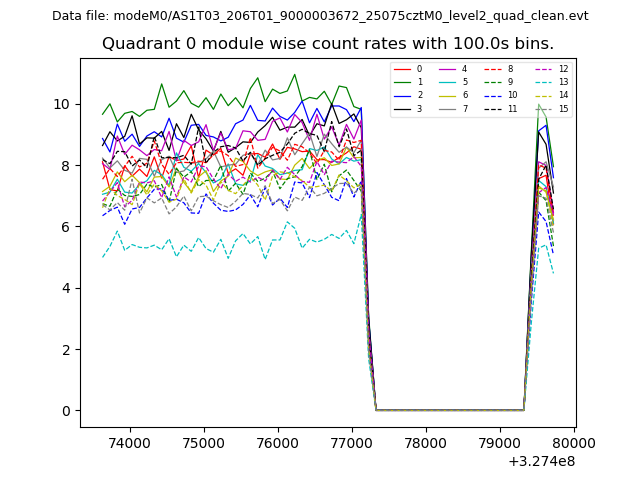 |
 |
| Module-wise count rates for Quadrant B Data is divided into 100 sec bins |
 |
 |
| Module-wise count rates for Quadrant C Data is divided into 100 sec bins |
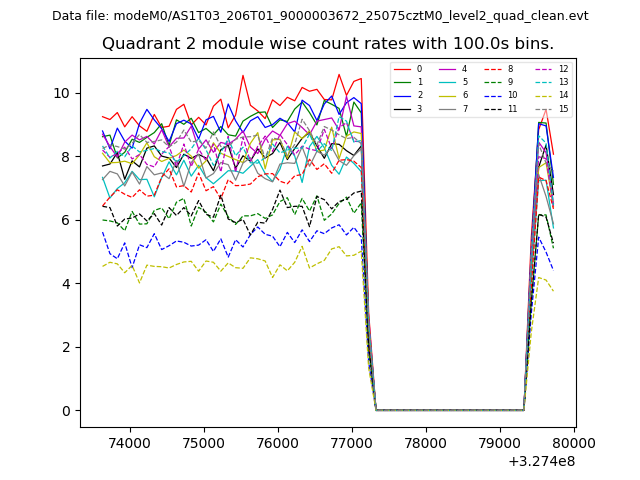 |
 |
| Module-wise count rates for Quadrant D Data is divided into 100 sec bins |
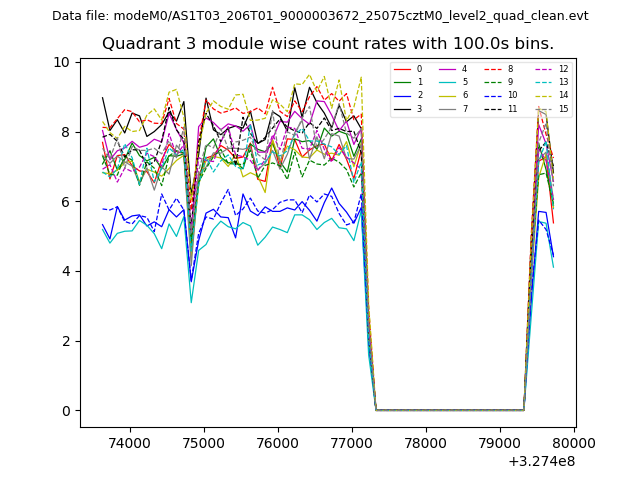 |
 |
| Parameter | Plot |
|---|---|
| CZT HV Monitor | 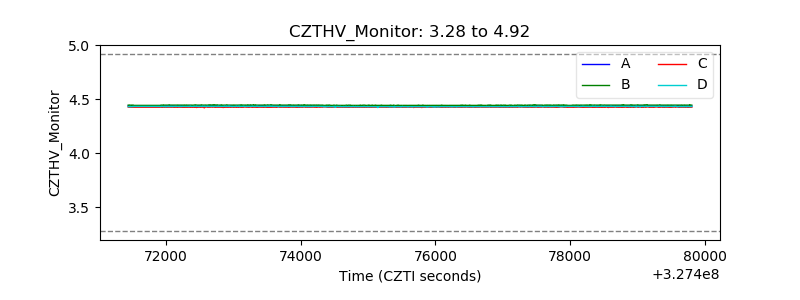 |
| D_VDD | 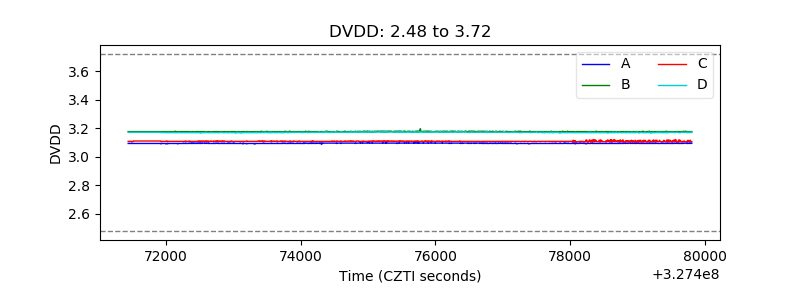 |
| Temperature 1 | 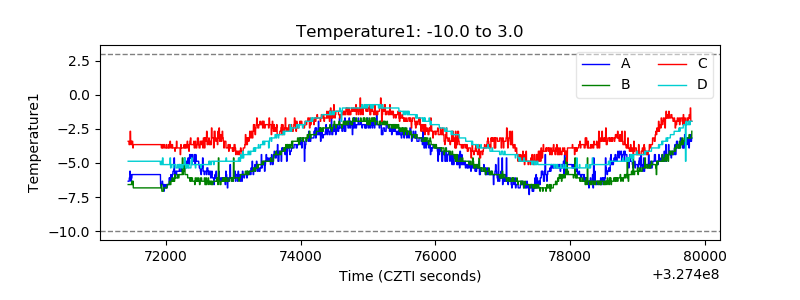 |
| Veto HV Monitor | 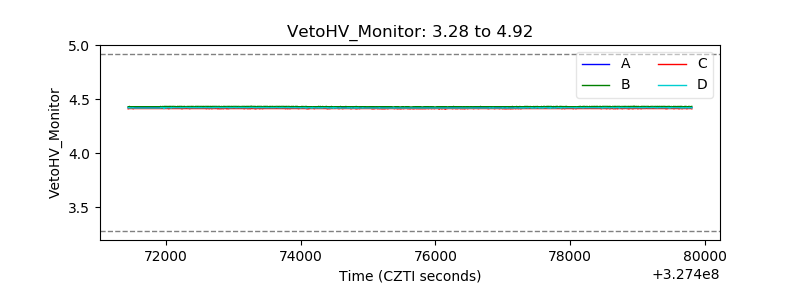 |
| Veto LLD | 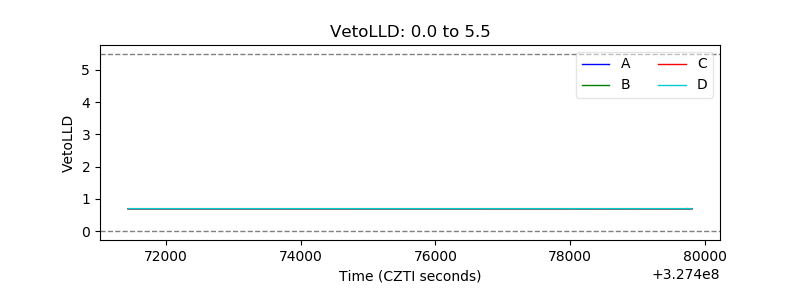 |
| Alpha Counter |  |
| _CPM_Rate |  |
| CZT Counter | 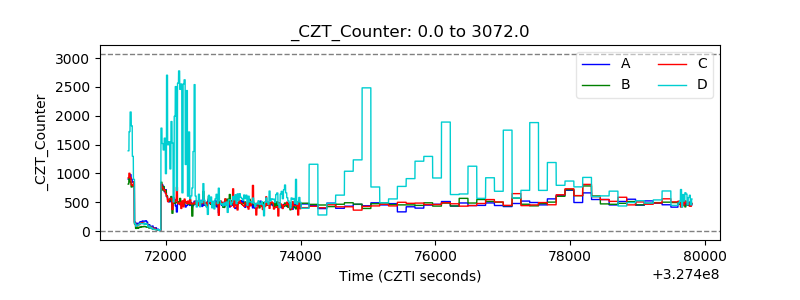 |
| +2.5 Volts monitor |  |
| +5 Volts monitor |  |
| _ROLL_ROT | 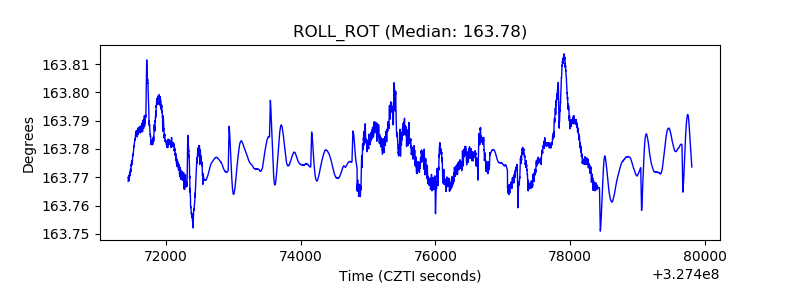 |
| _Roll_DEC | 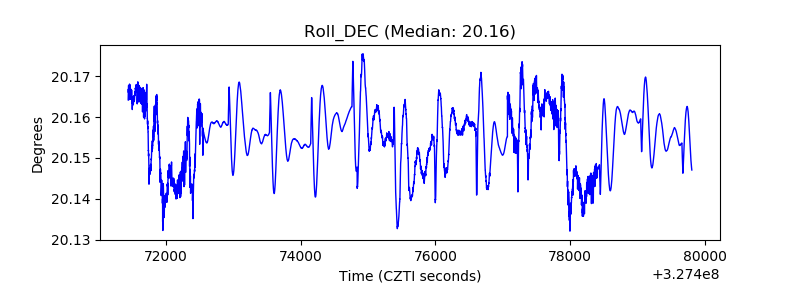 |
| _Roll_RA | 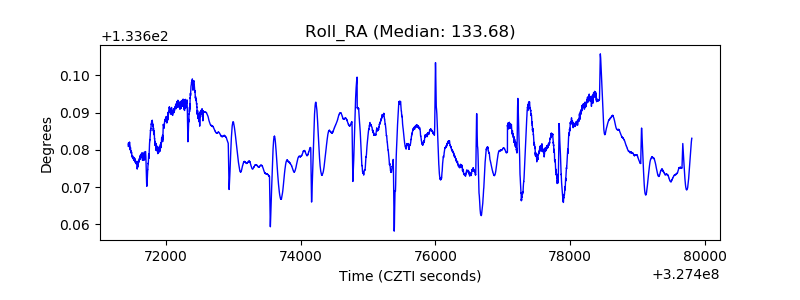 |
| Veto Counter | 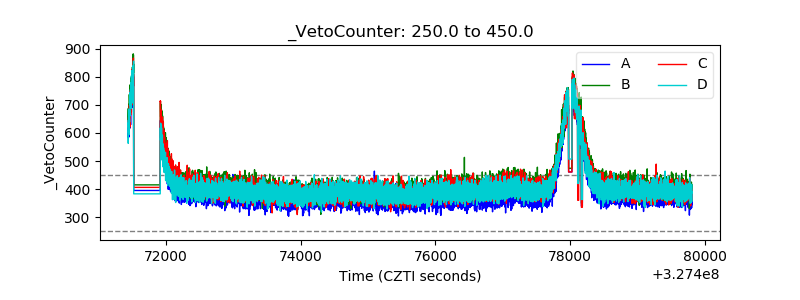 |