| Param | Original file | Final file |
|---|---|---|
| Filename | modeM0/AS1T03_206T01_9000003672_25076cztM0_level2.evt | modeM0/AS1T03_206T01_9000003672_25076cztM0_level2_quad_clean.evt |
| Size (bytes) | 539,801,280 | 89,009,280 |
| Size | 514.8 MB | 84.9 MB |
| Events in quadrant A | 3,462,003 | 562,057 |
| Events in quadrant B | 3,521,071 | 572,733 |
| Events in quadrant C | 3,460,402 | 540,919 |
| Events in quadrant D | 5,419,311 | 516,007 |
| Mode M9 | |||
|---|---|---|---|
| Quadrant | BADHDUFLAG | Total packets | Discarded packets |
| A | 0 | 3 | 0 |
| B | 0 | 3 | 0 |
| C | 0 | 3 | 0 |
| D | 0 | 3 | 0 |
| Mode SS | |||
|---|---|---|---|
| Quadrant | BADHDUFLAG | Total packets | Discarded packets |
| A | 0 | 148 | 0 |
| B | 0 | 148 | 0 |
| C | 0 | 148 | 0 |
| D | 0 | 148 | 0 |
| Mode M0 | |||
|---|---|---|---|
| Quadrant | BADHDUFLAG | Total packets | Discarded packets |
| A | 0 | 14877 | 1 |
| B | 0 | 14944 | 1 |
| C | 0 | 14780 | 1 |
| D | 0 | 20900 | 1 |
| Quadrant | Total seconds | Saturated seconds | Saturation percentage |
|---|---|---|---|
| A | 7227 | 161 | 2.227757% |
| B | 7227 | 165 | 2.283105% |
| C | 7228 | 191 | 2.642501% |
| D | 7228 | 283 | 3.915329% |
Noise dominated data is calculated using 1-second bins in cleaned event files. If a bin has >2000 counts, and if more than 50% of those come from <1% of pixels, then it is considered to be noise-dominated and hence unusable.
| Quadrant | # 1 sec bins | Bins with >0 counts | Bins with >2000 counts | High rate bins dominated by noise | Noise dominated (total time) | Noise dominated (detector-on time) | Marked lightcurve |
|---|---|---|---|---|---|---|---|
| A | 7522 | 7227 | 0 | 0 | 0.00% | 0.00% | 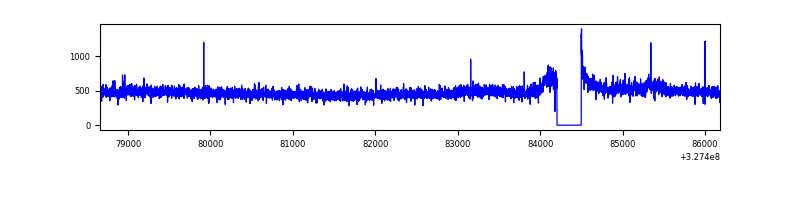 |
| B | 7522 | 7227 | 2 | 2 | 0.03% | 0.03% | 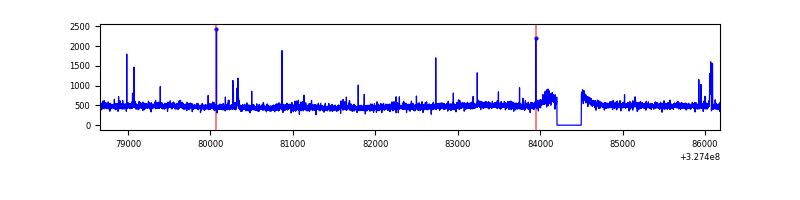 |
| C | 7523 | 7229 | 0 | 0 | 0.00% | 0.00% | 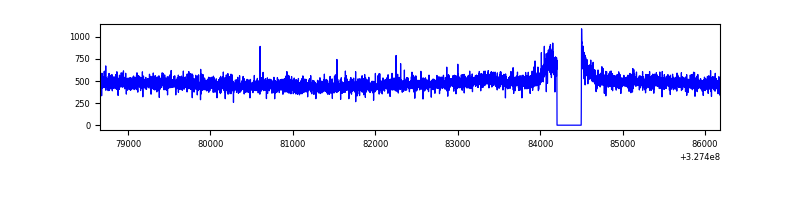 |
| D | 7523 | 7228 | 119 | 119 | 1.58% | 1.65% | 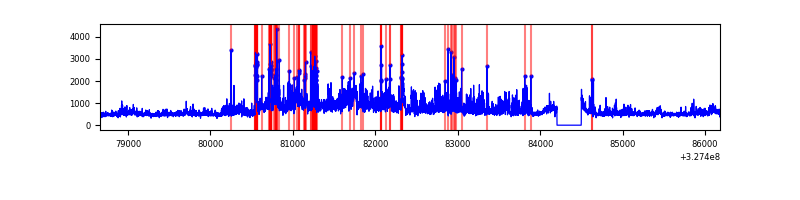 |
Top three noisy pixels from each quadrant. If the there are fewer than three noisy pixels in the level2.evt file, extra rows are filled as -1
| Pixel properties | Quadrant properties | ||||||
|---|---|---|---|---|---|---|---|
| Quadrant | DetID | PixID | Counts | Sigma | Mean | Median | Sigma |
| A | 13 | 34 | 57928 | 318.26 | 881 | 861 | 179.3 |
| A | 13 | 254 | 10957 | 56.31 | 881 | 861 | 179.3 |
| A | 3 | 137 | 8197 | 40.91 | 881 | 861 | 179.3 |
| B | 0 | 190 | 42044 | 242.05 | 880 | 856 | 170.2 |
| B | 10 | 251 | 22773 | 128.8 | 880 | 856 | 170.2 |
| B | 12 | 111 | 21313 | 120.22 | 880 | 856 | 170.2 |
| C | 14 | 238 | 134343 | 666.68 | 844 | 847 | 200.2 |
| C | 7 | 247 | 18073 | 86.03 | 844 | 847 | 200.2 |
| C | 8 | 128 | 9285 | 42.14 | 844 | 847 | 200.2 |
| D | 9 | 35 | 946125 | 4552.15 | 848 | 822 | 207.7 |
| D | 1 | 52 | 700822 | 3370.88 | 848 | 822 | 207.7 |
| D | 8 | 195 | 350103 | 1681.98 | 848 | 822 | 207.7 |
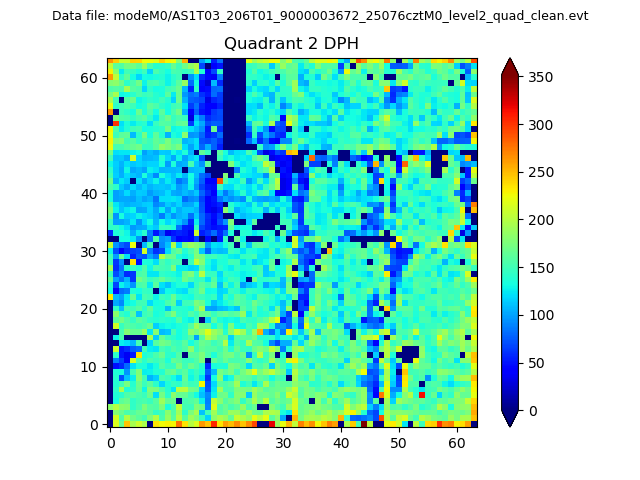
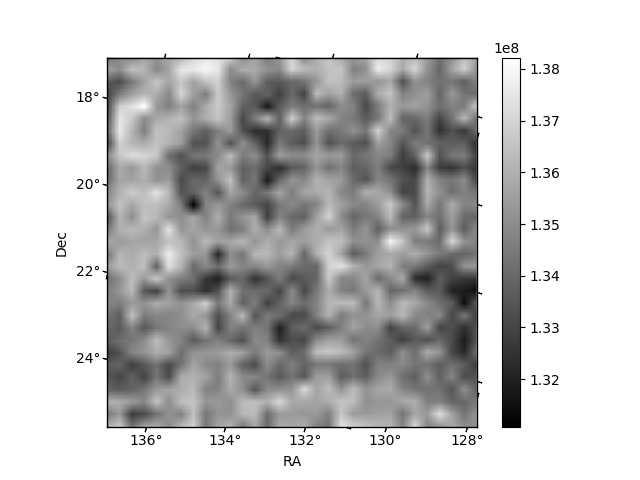
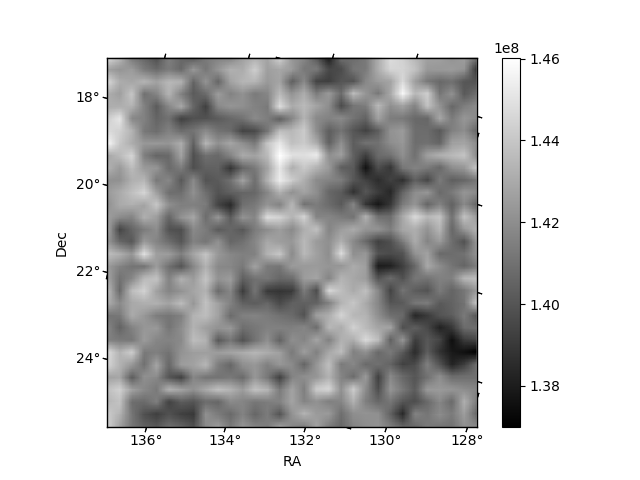
Histogram calculated using DETX and DETY for each event in the final _common_clean file
| Quadrant A | 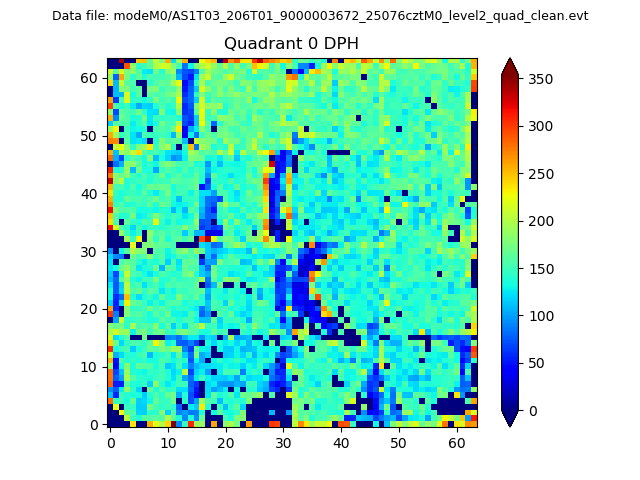 |
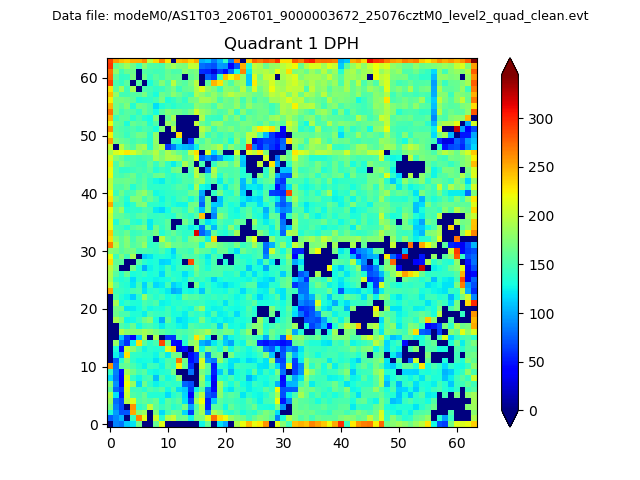 |
Quadrant B |
|---|---|---|---|
| Quadrant D | 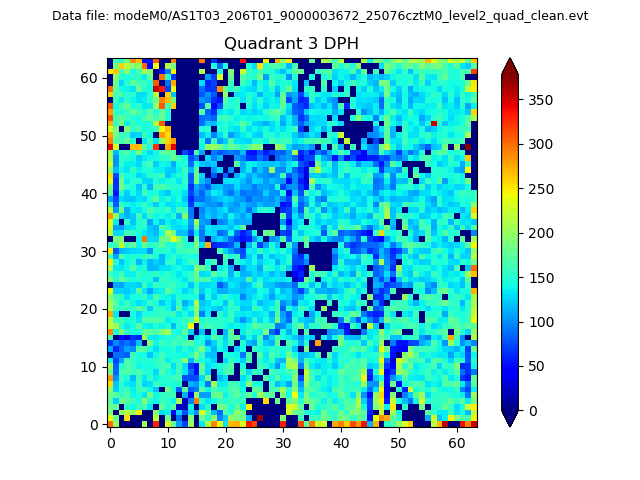 |
 |
Quadrant C |
| Plot type | Count rate plots | Images |
|---|---|---|
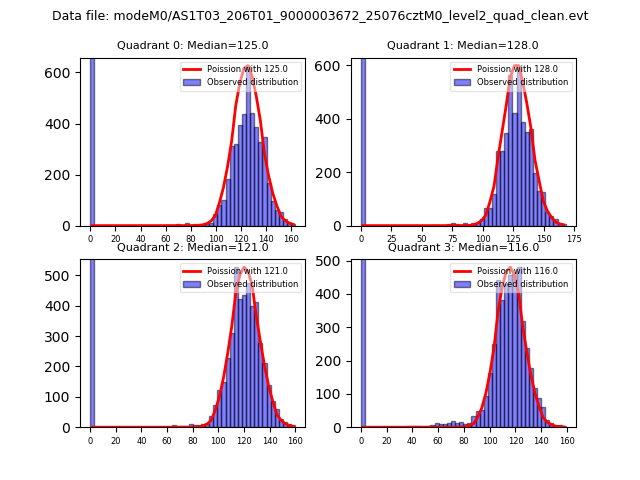
| Comparison with Poisson distribution Blue bars denote a histogram of data divided into 1 sec bins. Red curve is a Poisson curve with rate = median count rate of data. |
 |
 |
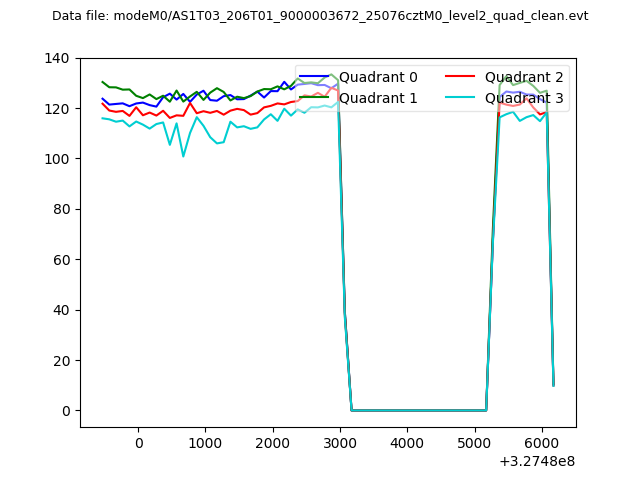
| Quadrant-wise count rates Data is divided into 100 sec bins |
 |
|
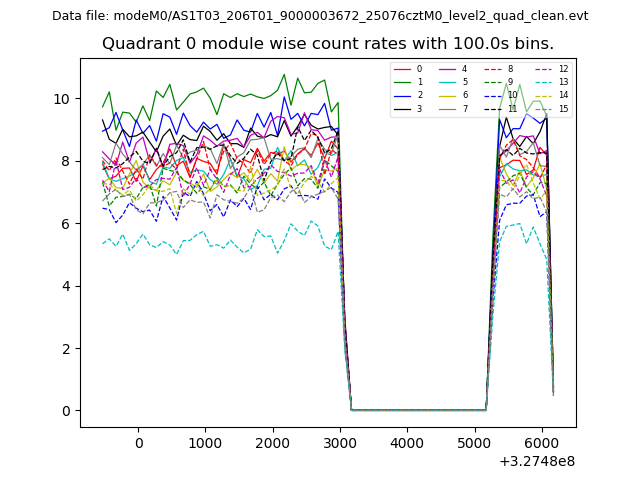
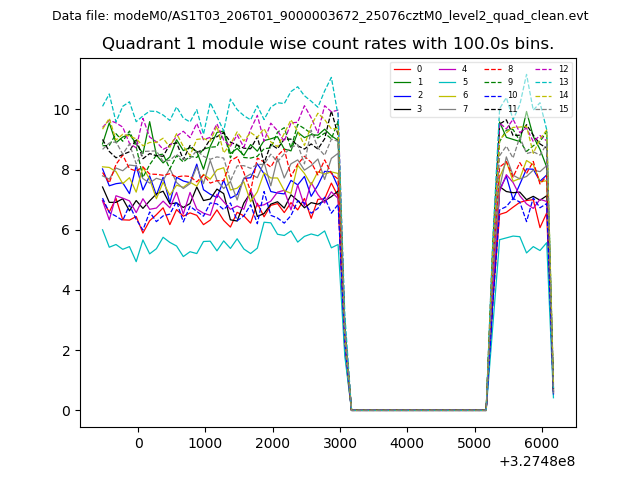
| Module-wise count rates for Quadrant A Data is divided into 100 sec bins |
 |
 |
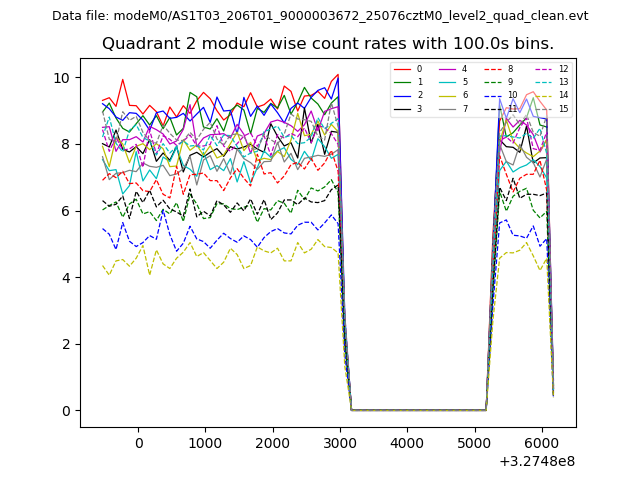
| Module-wise count rates for Quadrant B Data is divided into 100 sec bins |
 |
 |
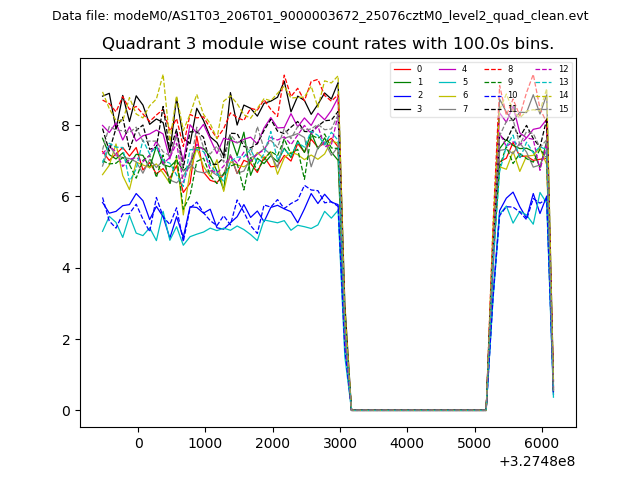
| Module-wise count rates for Quadrant C Data is divided into 100 sec bins |
 |
 |
| Module-wise count rates for Quadrant D Data is divided into 100 sec bins |
 |
 |
| Parameter | Plot |
|---|---|
| CZT HV Monitor | 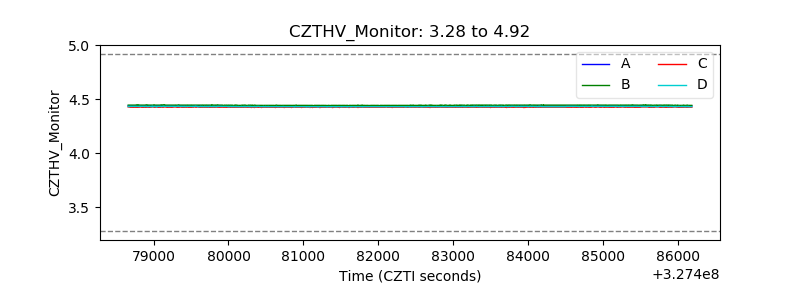 |
| D_VDD | 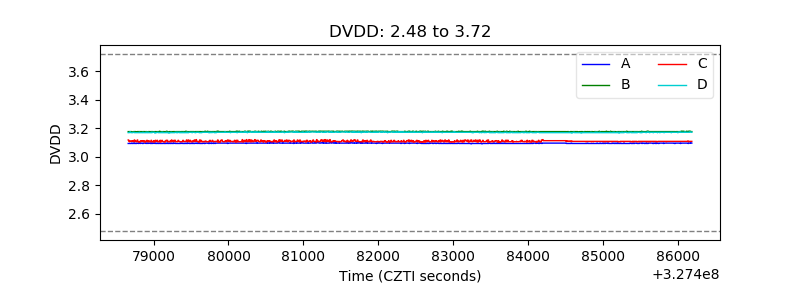 |
| Temperature 1 | 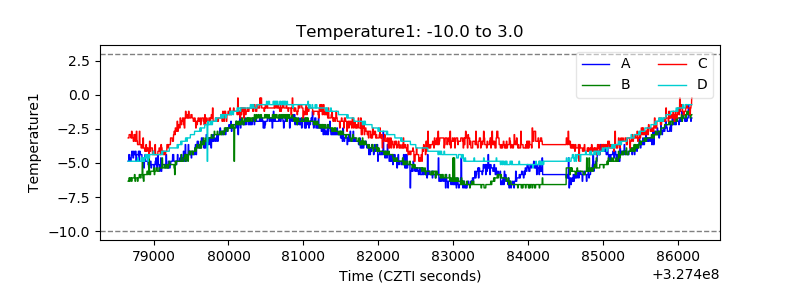 |
| Veto HV Monitor | 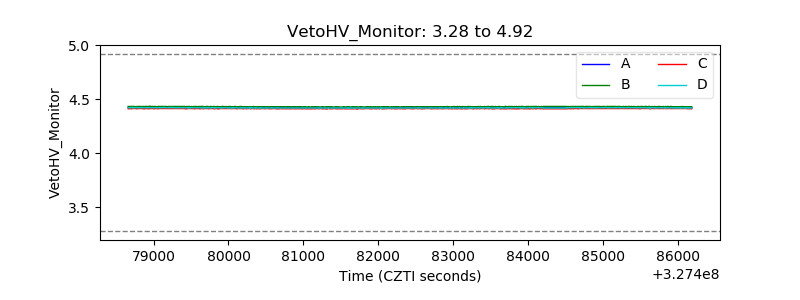 |
| Veto LLD | 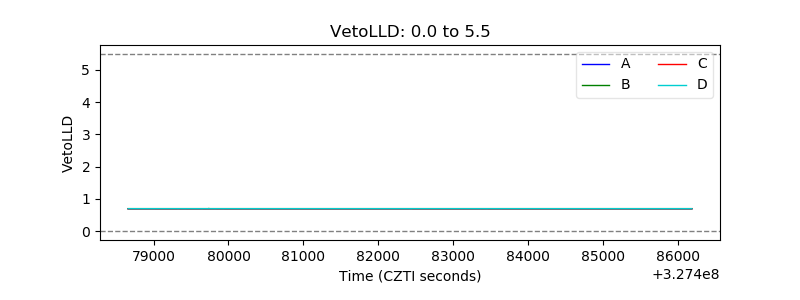 |
| Alpha Counter | 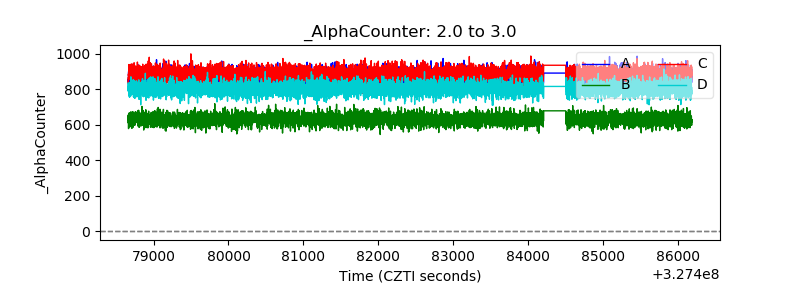 |
| _CPM_Rate | 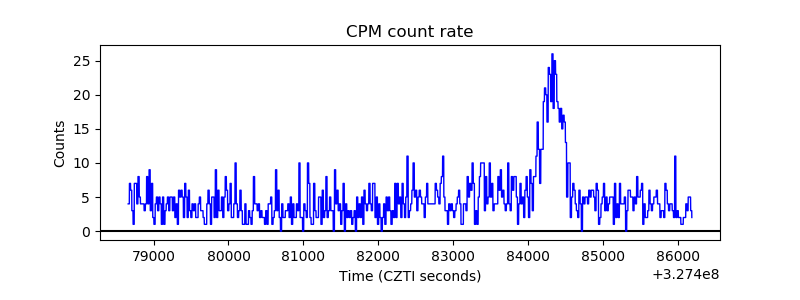 |
| CZT Counter | 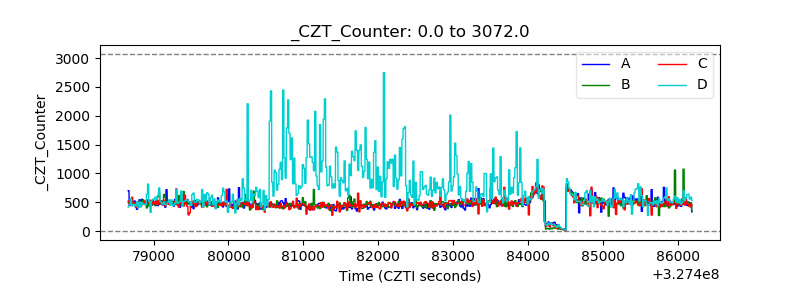 |
| +2.5 Volts monitor |  |
| +5 Volts monitor |  |
| _ROLL_ROT | 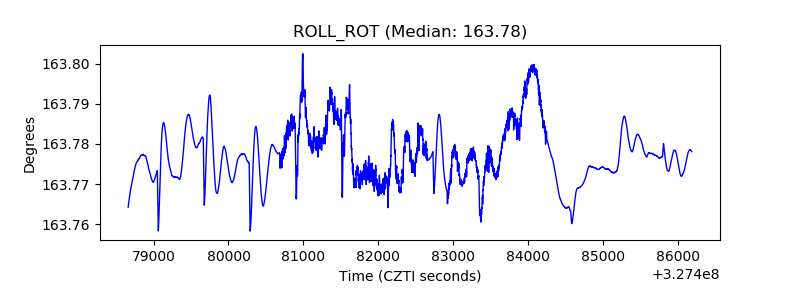 |
| _Roll_DEC | 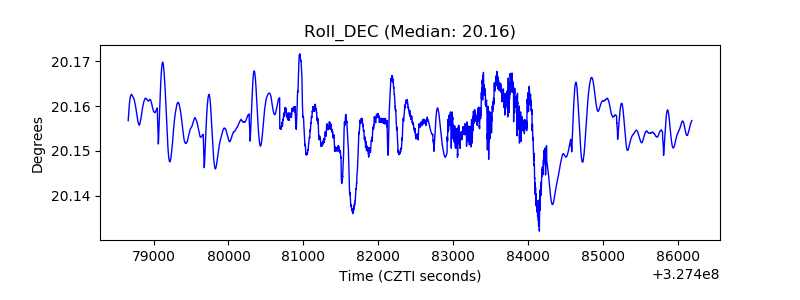 |
| _Roll_RA | 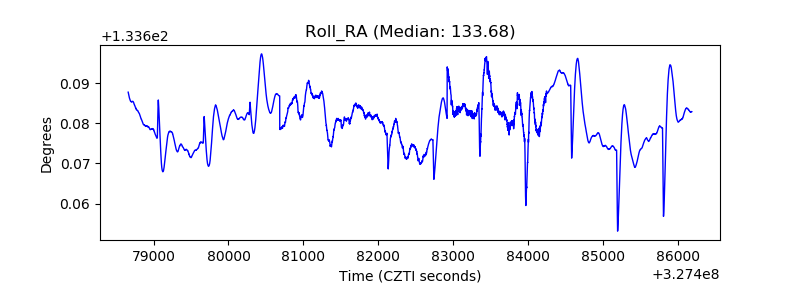 |
| Veto Counter | 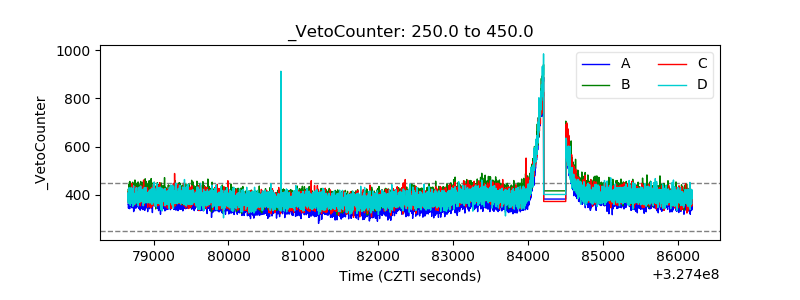 |