| Param | Original file | Final file |
|---|---|---|
| Filename | modeM0/AS1T03_206T01_9000003672_25078cztM0_level2.evt | modeM0/AS1T03_206T01_9000003672_25078cztM0_level2_quad_clean.evt |
| Size (bytes) | 940,867,200 | 172,442,880 |
| Size | 897.3 MB | 164.5 MB |
| Events in quadrant A | 6,072,542 | 1,114,467 |
| Events in quadrant B | 6,398,313 | 1,125,794 |
| Events in quadrant C | 5,999,574 | 1,070,598 |
| Events in quadrant D | 9,170,372 | 1,033,861 |
| Mode M9 | |||
|---|---|---|---|
| Quadrant | BADHDUFLAG | Total packets | Discarded packets |
| A | 0 | 12 | 0 |
| B | 0 | 12 | 0 |
| C | 0 | 12 | 0 |
| D | 0 | 12 | 0 |
| Mode SS | |||
|---|---|---|---|
| Quadrant | BADHDUFLAG | Total packets | Discarded packets |
| A | 0 | 258 | 0 |
| B | 0 | 258 | 0 |
| C | 0 | 258 | 0 |
| D | 0 | 258 | 0 |
| Mode M0 | |||
|---|---|---|---|
| Quadrant | BADHDUFLAG | Total packets | Discarded packets |
| A | 0 | 26147 | 2 |
| B | 0 | 26878 | 2 |
| C | 0 | 25921 | 2 |
| D | 0 | 36184 | 2 |
| Quadrant | Total seconds | Saturated seconds | Saturation percentage |
|---|---|---|---|
| A | 12706 | 135 | 1.062490% |
| B | 12707 | 175 | 1.377194% |
| C | 12707 | 190 | 1.495239% |
| D | 12707 | 254 | 1.998898% |
Noise dominated data is calculated using 1-second bins in cleaned event files. If a bin has >2000 counts, and if more than 50% of those come from <1% of pixels, then it is considered to be noise-dominated and hence unusable.
| Quadrant | # 1 sec bins | Bins with >0 counts | Bins with >2000 counts | High rate bins dominated by noise | Noise dominated (total time) | Noise dominated (detector-on time) | Marked lightcurve |
|---|---|---|---|---|---|---|---|
| A | 13881 | 12707 | 0 | 0 | 0.00% | 0.00% | 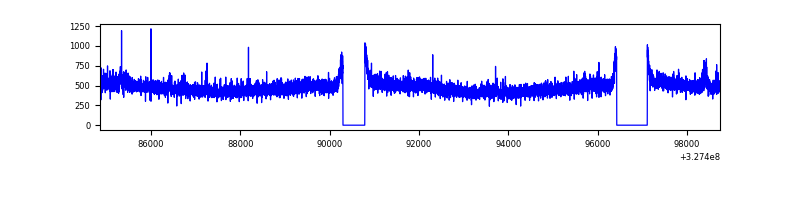 |
| B | 13882 | 12707 | 28 | 28 | 0.20% | 0.22% | 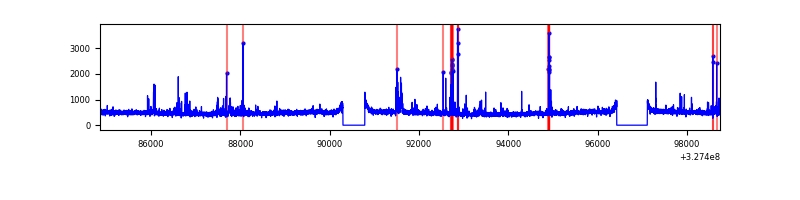 |
| C | 13882 | 12709 | 0 | 0 | 0.00% | 0.00% | 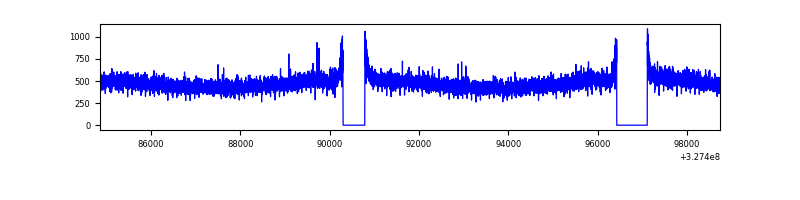 |
| D | 13882 | 12709 | 103 | 103 | 0.74% | 0.81% | 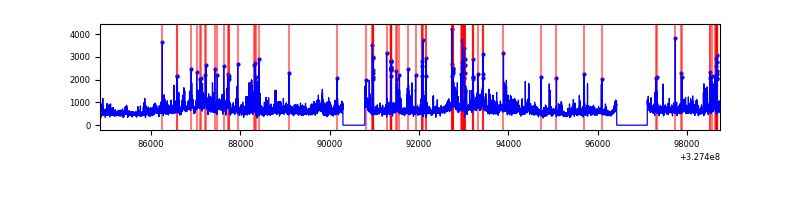 |
Top three noisy pixels from each quadrant. If the there are fewer than three noisy pixels in the level2.evt file, extra rows are filled as -1
| Pixel properties | Quadrant properties | ||||||
|---|---|---|---|---|---|---|---|
| Quadrant | DetID | PixID | Counts | Sigma | Mean | Median | Sigma |
| A | 13 | 34 | 108534 | 342.43 | 1545 | 1510 | 312.5 |
| A | 13 | 254 | 21613 | 64.32 | 1545 | 1510 | 312.5 |
| A | 3 | 137 | 14177 | 40.53 | 1545 | 1510 | 312.5 |
| B | 3 | 64 | 124509 | 419.46 | 1532 | 1493 | 293.3 |
| B | 0 | 229 | 101129 | 339.74 | 1532 | 1493 | 293.3 |
| B | 0 | 190 | 76485 | 255.71 | 1532 | 1493 | 293.3 |
| C | 14 | 238 | 232906 | 663.16 | 1476 | 1484 | 349.0 |
| C | 7 | 247 | 12688 | 32.11 | 1476 | 1484 | 349.0 |
| C | 13 | 61 | 10200 | 24.98 | 1476 | 1484 | 349.0 |
| D | 1 | 52 | 1057753 | 2909.28 | 1492 | 1450 | 363.1 |
| D | 8 | 195 | 946661 | 2603.31 | 1492 | 1450 | 363.1 |
| D | 9 | 35 | 842898 | 2317.52 | 1492 | 1450 | 363.1 |
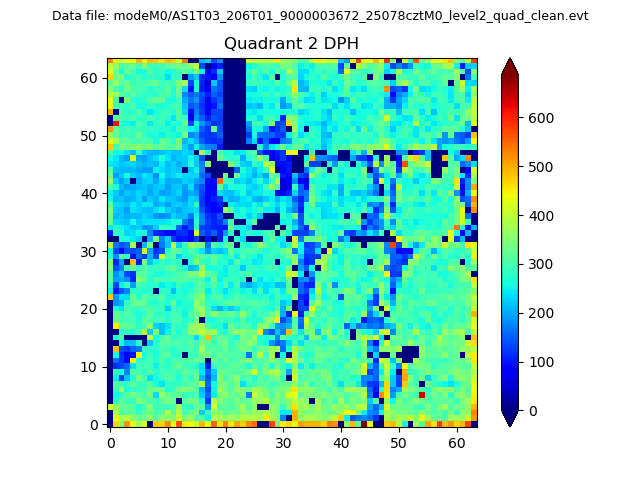
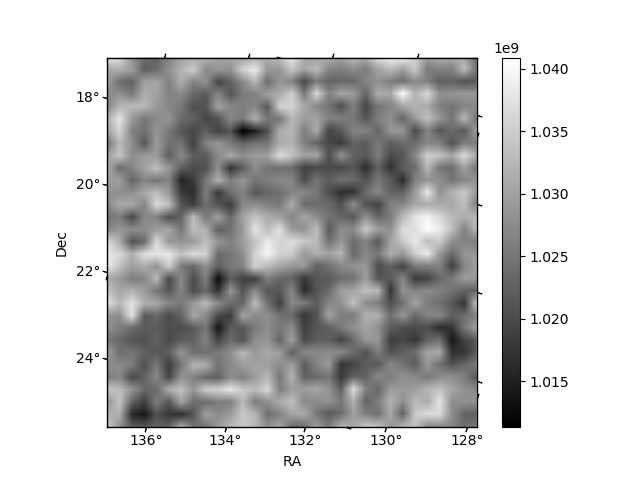
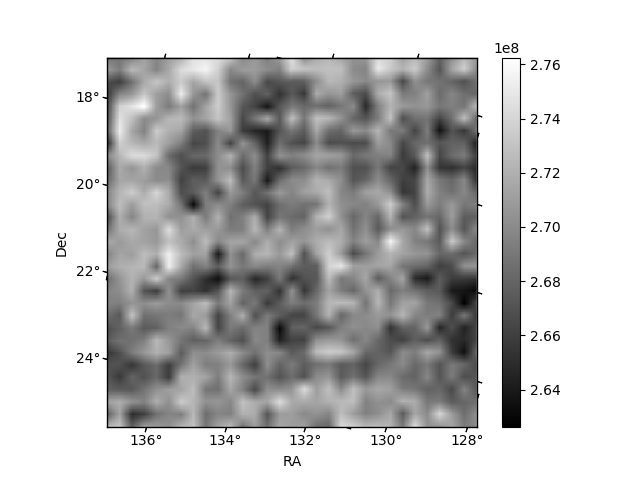
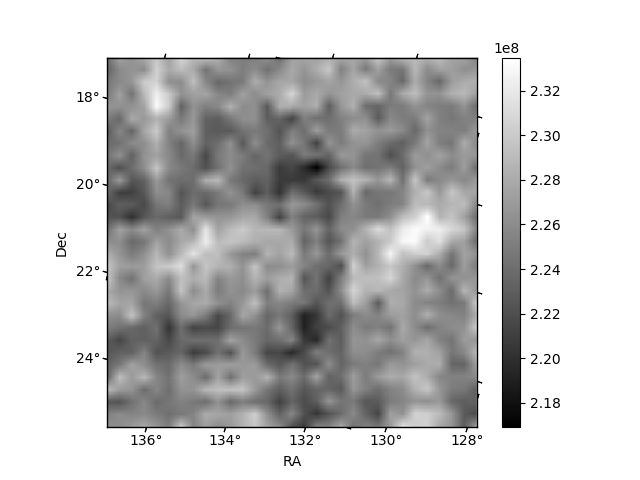
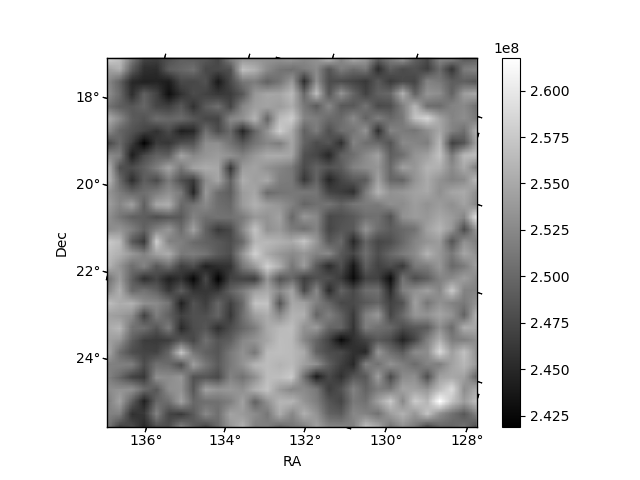
Histogram calculated using DETX and DETY for each event in the final _common_clean file
| Quadrant A | 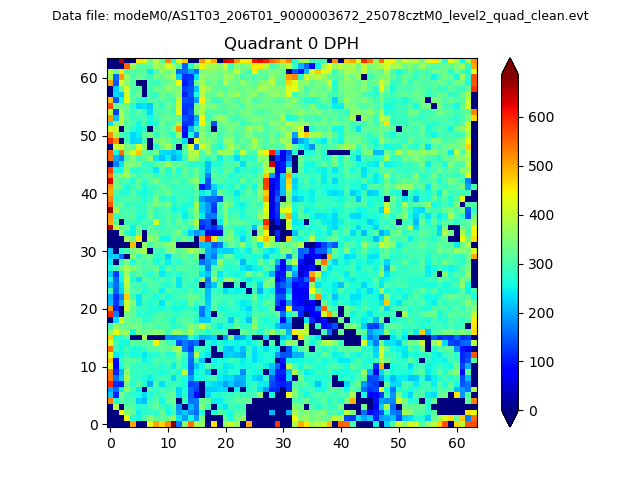 |
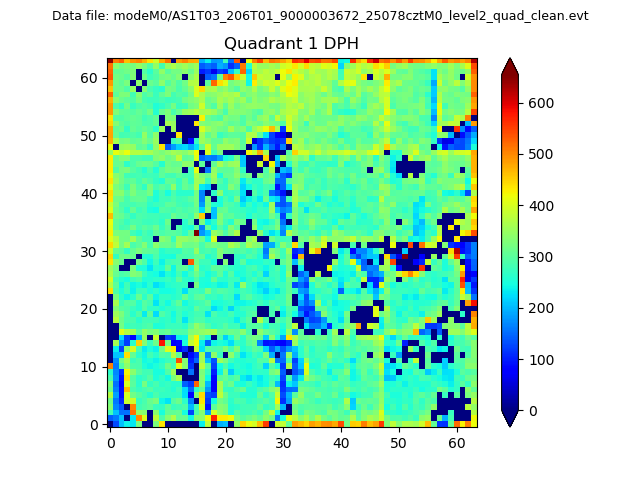 |
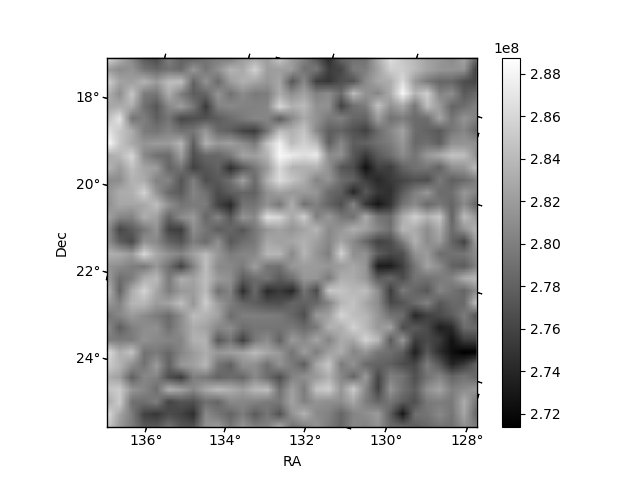
Quadrant B |
|---|---|---|---|
| Quadrant D | 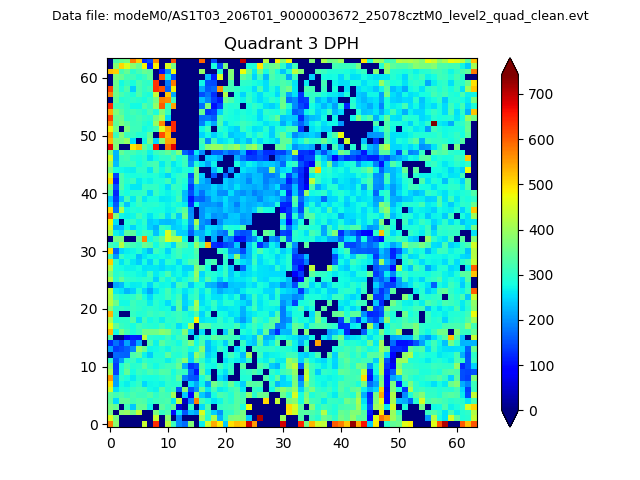 |
 |
Quadrant C |
| Plot type | Count rate plots | Images |
|---|---|---|
| Comparison with Poisson distribution Blue bars denote a histogram of data divided into 1 sec bins. Red curve is a Poisson curve with rate = median count rate of data. |
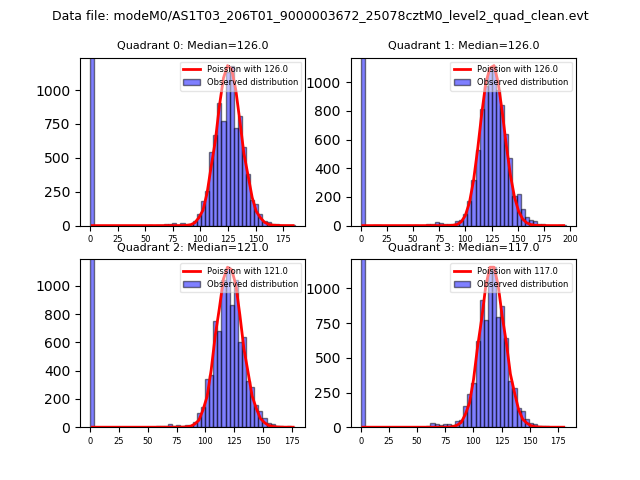 |
 |
| Quadrant-wise count rates Data is divided into 100 sec bins |
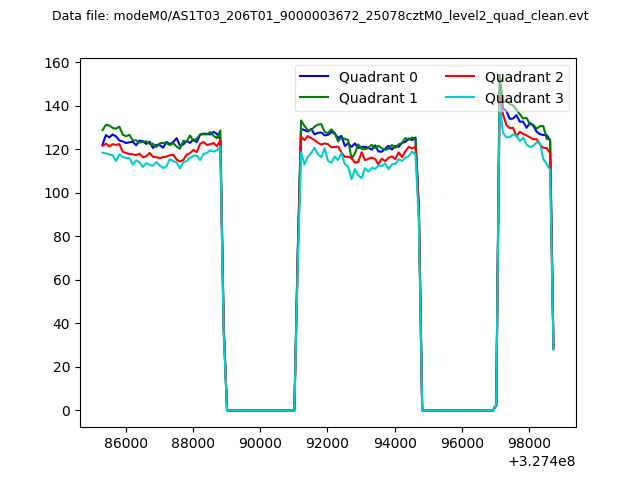 |
|
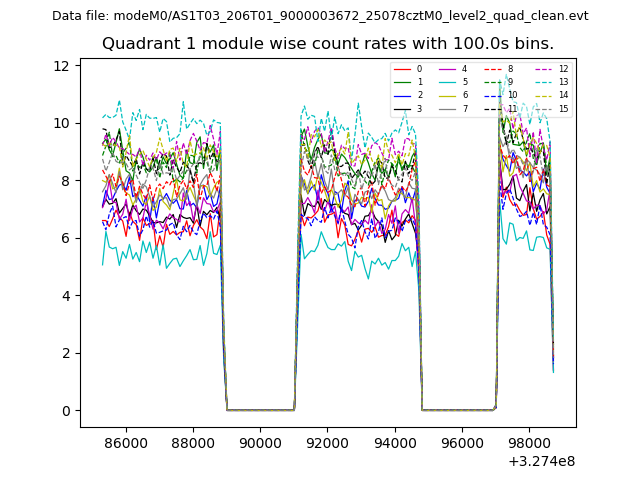
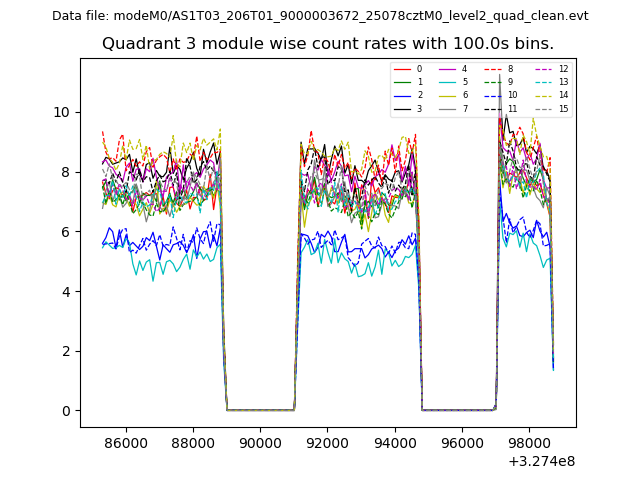
| Module-wise count rates for Quadrant A Data is divided into 100 sec bins |
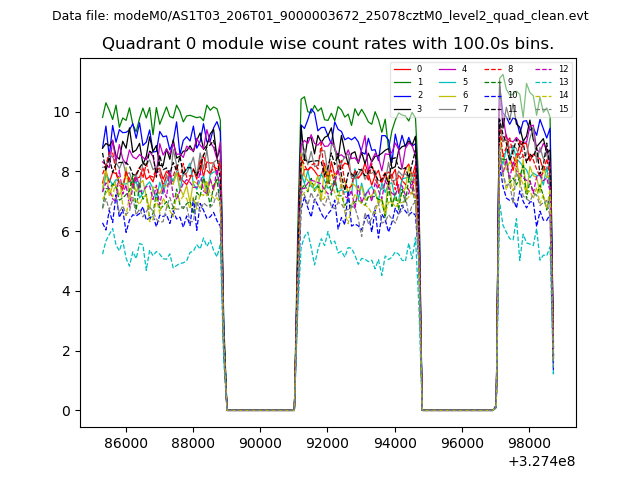 |
 |
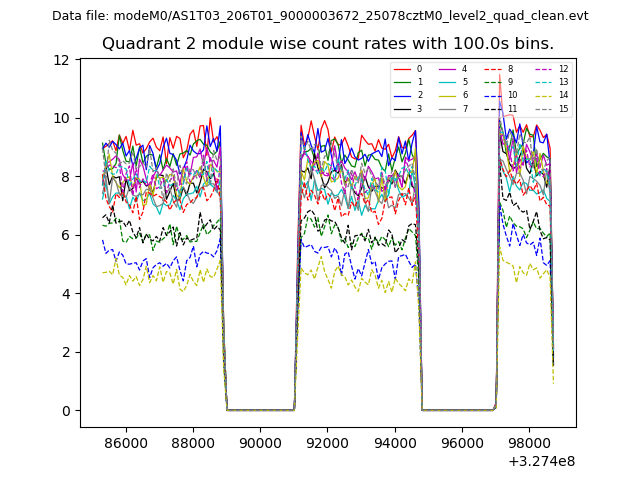
| Module-wise count rates for Quadrant B Data is divided into 100 sec bins |
 |
 |
| Module-wise count rates for Quadrant C Data is divided into 100 sec bins |
 |
 |
| Module-wise count rates for Quadrant D Data is divided into 100 sec bins |
 |
 |
| Parameter | Plot |
|---|---|
| CZT HV Monitor | 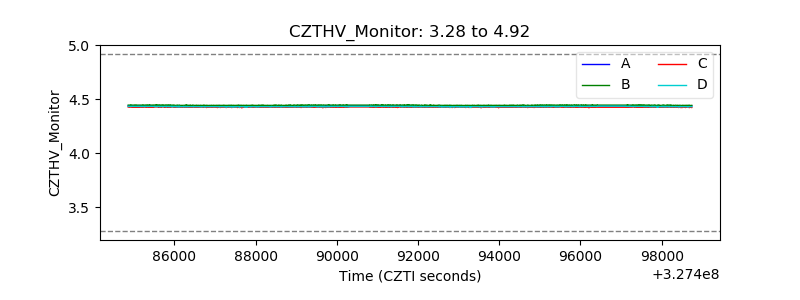 |
| D_VDD | 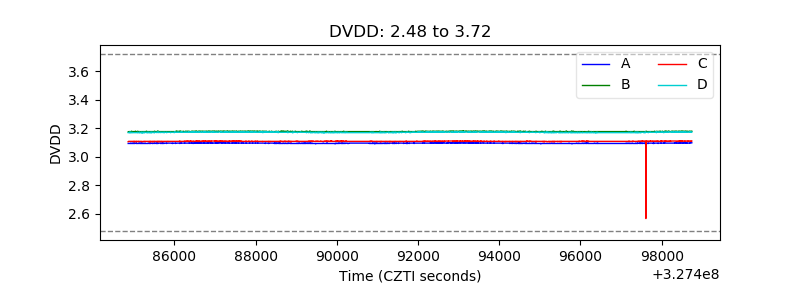 |
| Temperature 1 | 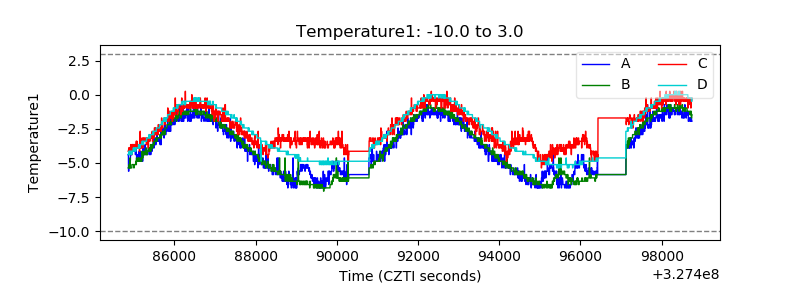 |
| Veto HV Monitor | 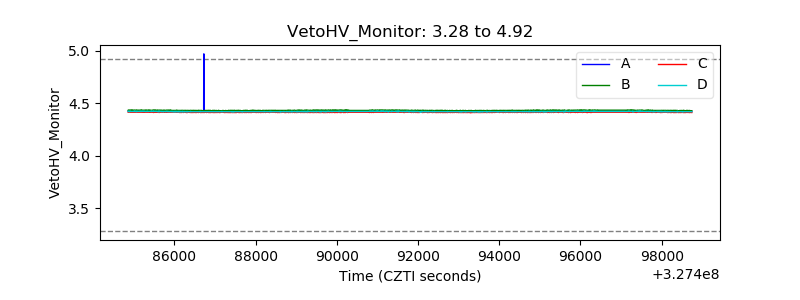 |
| Veto LLD | 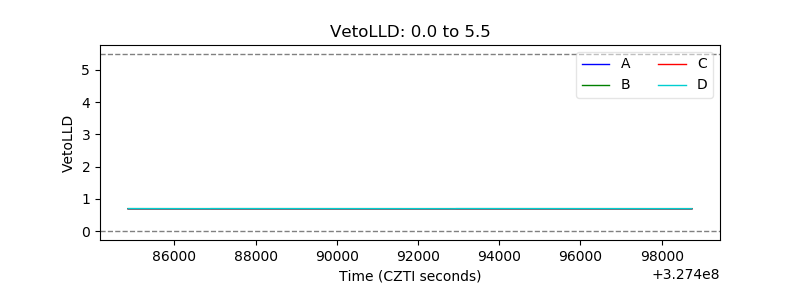 |
| Alpha Counter | 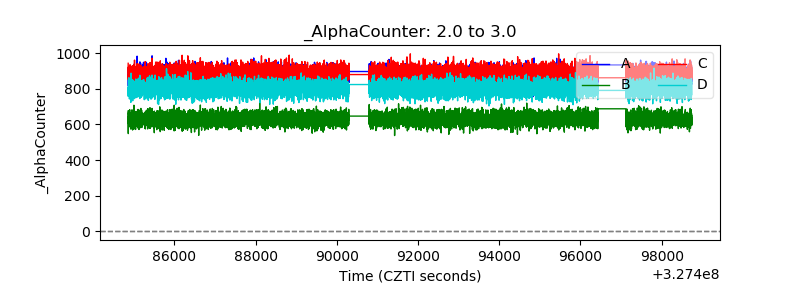 |
| _CPM_Rate |  |
| CZT Counter | 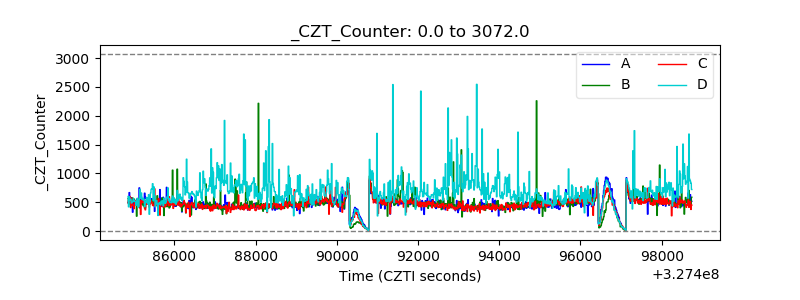 |
| +2.5 Volts monitor | 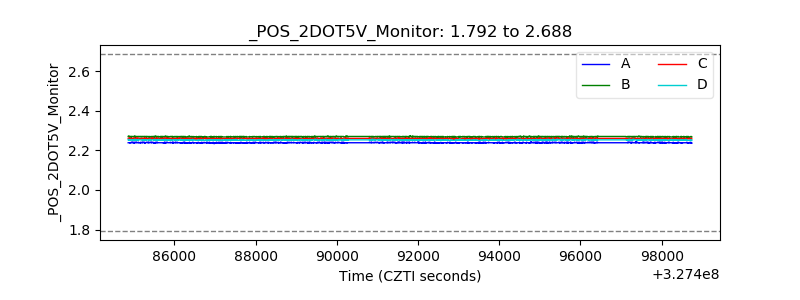 |
| +5 Volts monitor | 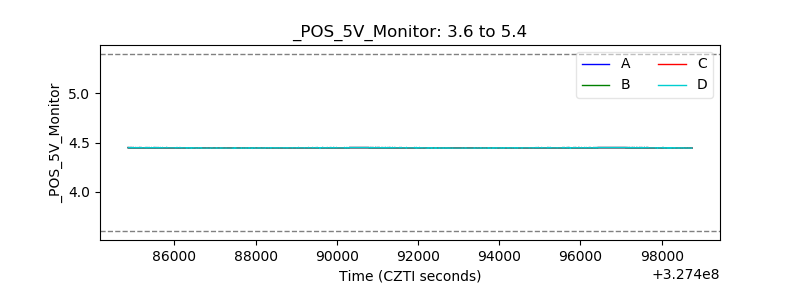 |
| _ROLL_ROT | 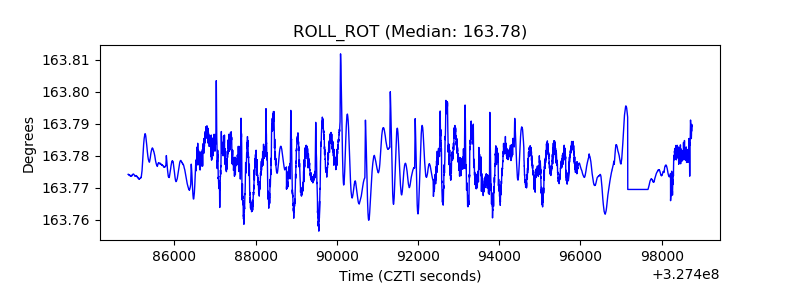 |
| _Roll_DEC | 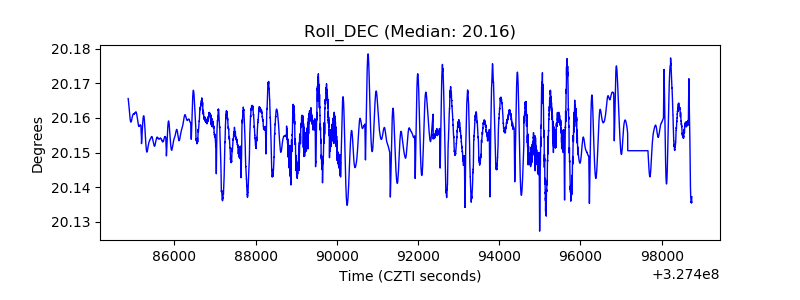 |
| _Roll_RA | 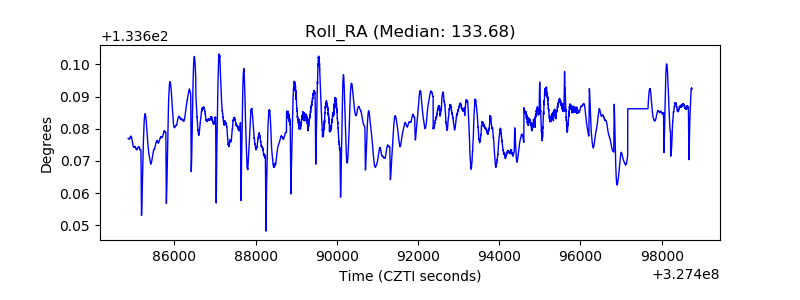 |
| Veto Counter | 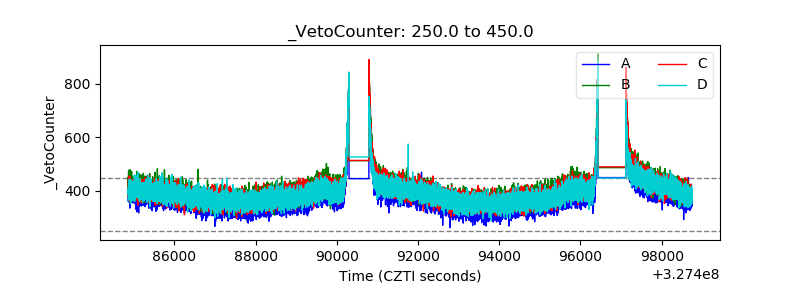 |