| Param | Original file | Final file |
|---|---|---|
| Filename | modeM0/AS1T03_206T01_9000003672_25079cztM0_level2.evt | modeM0/AS1T03_206T01_9000003672_25079cztM0_level2_quad_clean.evt |
| Size (bytes) | 472,841,280 | 90,527,040 |
| Size | 450.9 MB | 86.3 MB |
| Events in quadrant A | 3,105,074 | 586,011 |
| Events in quadrant B | 3,427,196 | 590,452 |
| Events in quadrant C | 3,082,288 | 562,458 |
| Events in quadrant D | 4,270,108 | 549,828 |
| Mode M9 | |||
|---|---|---|---|
| Quadrant | BADHDUFLAG | Total packets | Discarded packets |
| A | 0 | 9 | 0 |
| B | 0 | 9 | 0 |
| C | 0 | 9 | 0 |
| D | 0 | 9 | 0 |
| Mode SS | |||
|---|---|---|---|
| Quadrant | BADHDUFLAG | Total packets | Discarded packets |
| A | 0 | 132 | 0 |
| B | 0 | 132 | 0 |
| C | 0 | 132 | 0 |
| D | 0 | 132 | 0 |
| Mode M0 | |||
|---|---|---|---|
| Quadrant | BADHDUFLAG | Total packets | Discarded packets |
| A | 0 | 13457 | 1 |
| B | 0 | 14253 | 1 |
| C | 0 | 13319 | 1 |
| D | 0 | 17163 | 1 |
| Quadrant | Total seconds | Saturated seconds | Saturation percentage |
|---|---|---|---|
| A | 6490 | 48 | 0.739599% |
| B | 6491 | 103 | 1.586813% |
| C | 6491 | 67 | 1.032198% |
| D | 6491 | 95 | 1.463565% |
Noise dominated data is calculated using 1-second bins in cleaned event files. If a bin has >2000 counts, and if more than 50% of those come from <1% of pixels, then it is considered to be noise-dominated and hence unusable.
| Quadrant | # 1 sec bins | Bins with >0 counts | Bins with >2000 counts | High rate bins dominated by noise | Noise dominated (total time) | Noise dominated (detector-on time) | Marked lightcurve |
|---|---|---|---|---|---|---|---|
| A | 7350 | 6490 | 0 | 0 | 0.00% | 0.00% | 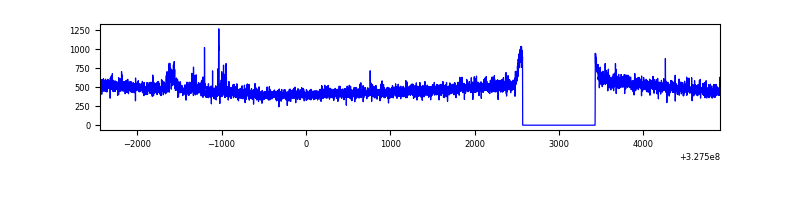 |
| B | 7351 | 6491 | 41 | 41 | 0.56% | 0.63% | 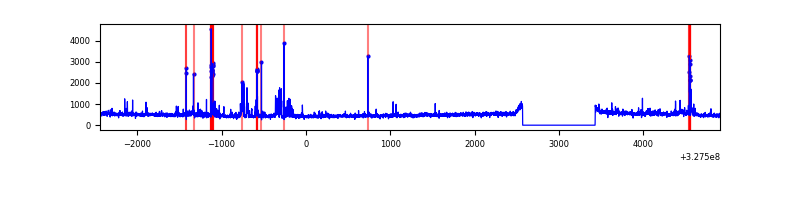 |
| C | 7351 | 6492 | 1 | 1 | 0.01% | 0.02% | 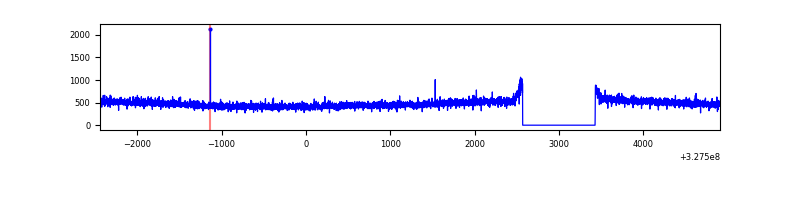 |
| D | 7351 | 6491 | 31 | 31 | 0.42% | 0.48% | 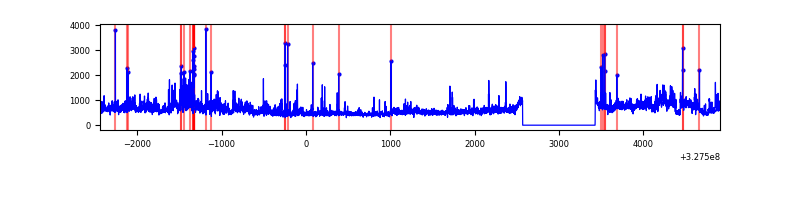 |
Top three noisy pixels from each quadrant. If the there are fewer than three noisy pixels in the level2.evt file, extra rows are filled as -1
| Pixel properties | Quadrant properties | ||||||
|---|---|---|---|---|---|---|---|
| Quadrant | DetID | PixID | Counts | Sigma | Mean | Median | Sigma |
| A | 13 | 34 | 56288 | 343.82 | 790 | 771 | 161.5 |
| A | 13 | 254 | 10603 | 60.89 | 790 | 771 | 161.5 |
| A | 3 | 137 | 7045 | 38.86 | 790 | 771 | 161.5 |
| B | 0 | 229 | 92209 | 611.75 | 783 | 764 | 149.5 |
| B | 5 | 172 | 84262 | 558.58 | 783 | 764 | 149.5 |
| B | 3 | 64 | 77349 | 512.34 | 783 | 764 | 149.5 |
| C | 14 | 238 | 119353 | 661.69 | 757 | 760 | 179.2 |
| C | 7 | 247 | 6112 | 29.86 | 757 | 760 | 179.2 |
| C | 1 | 16 | 5656 | 27.32 | 757 | 760 | 179.2 |
| D | 8 | 195 | 501557 | 2661.4 | 768 | 745 | 188.2 |
| D | 9 | 35 | 378221 | 2005.97 | 768 | 745 | 188.2 |
| D | 1 | 52 | 240115 | 1272.05 | 768 | 745 | 188.2 |
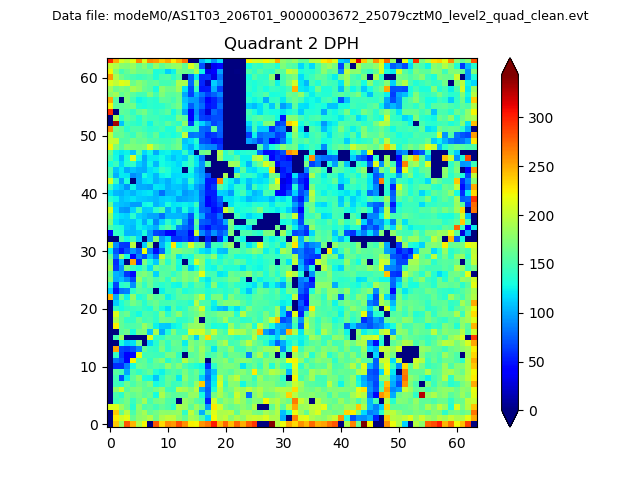
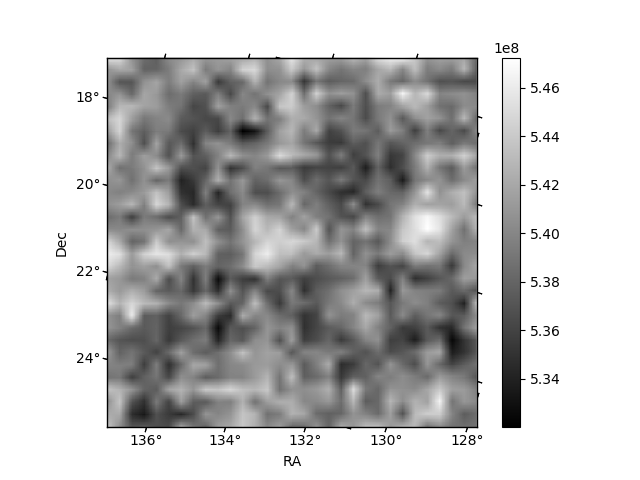
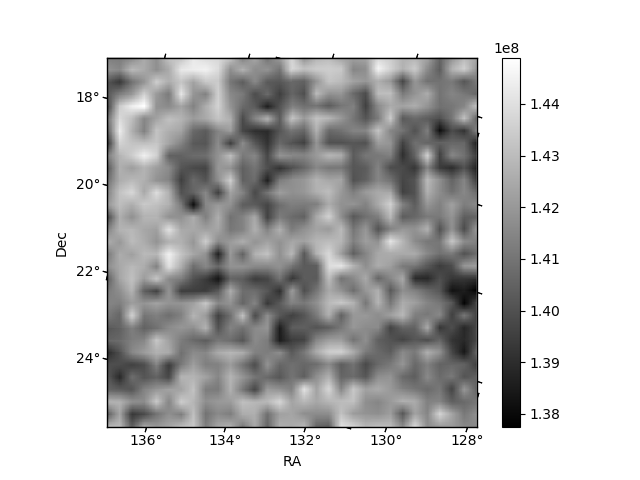
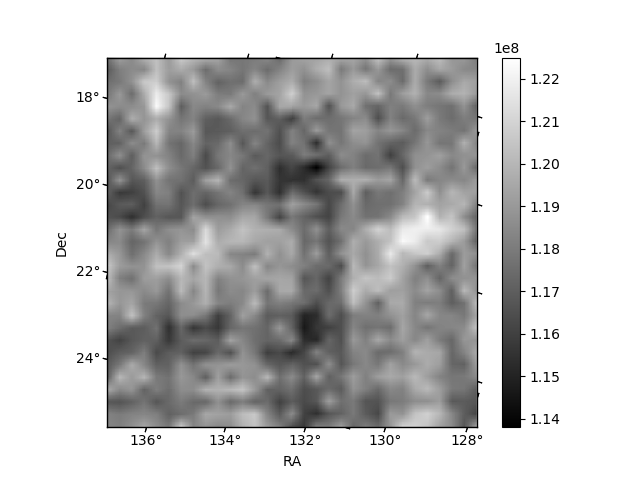
Histogram calculated using DETX and DETY for each event in the final _common_clean file
| Quadrant A | 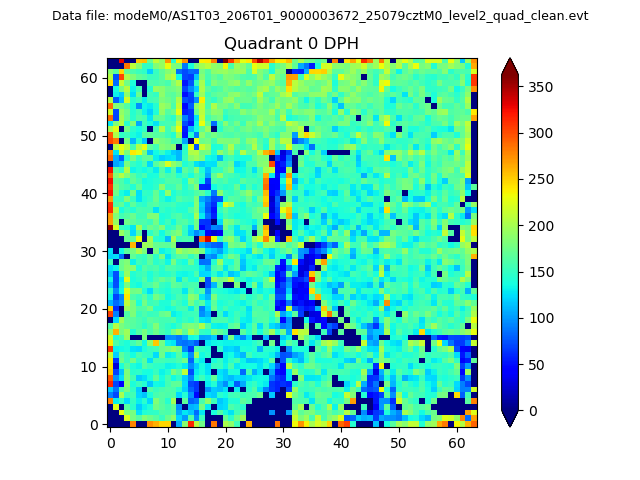 |
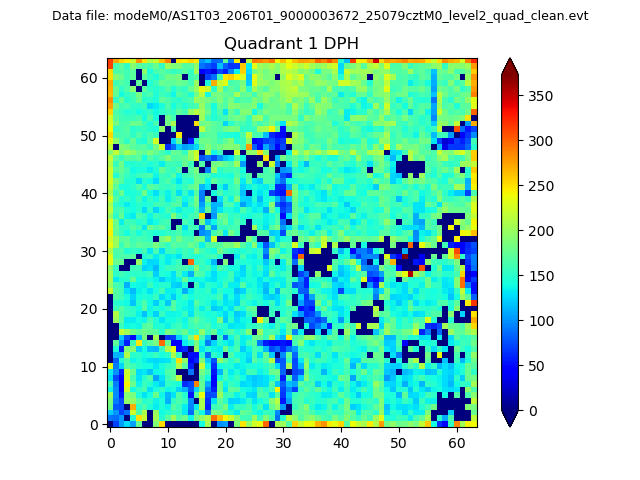 |
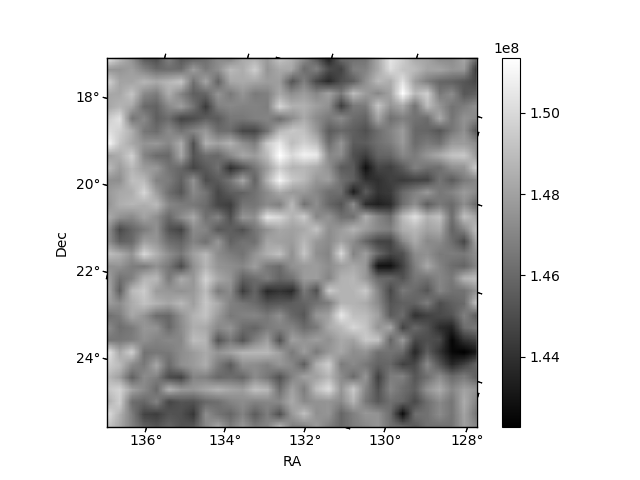
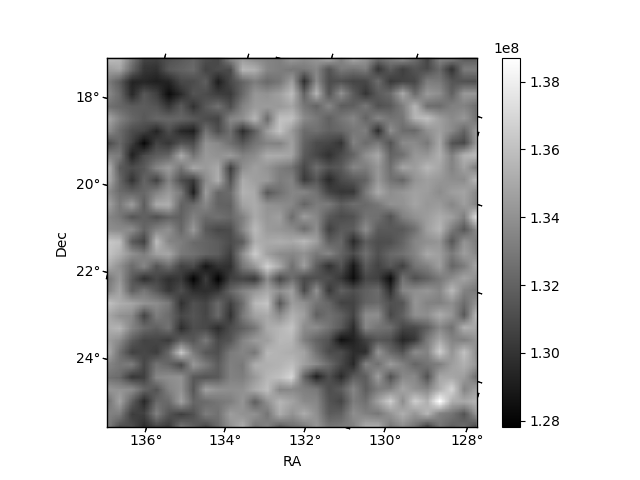
Quadrant B |
|---|---|---|---|
| Quadrant D | 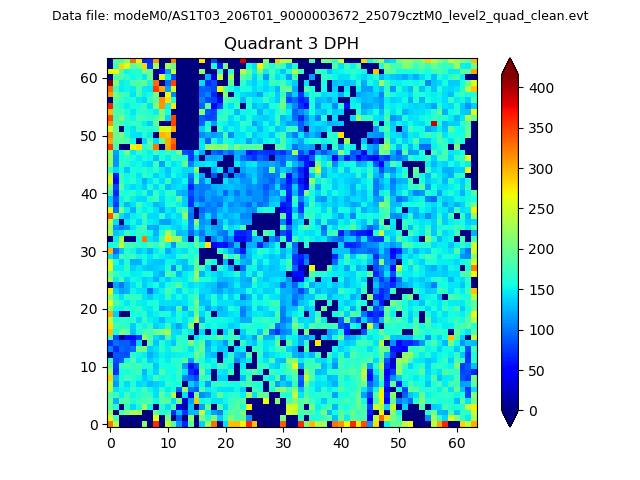 |
 |
Quadrant C |
| Plot type | Count rate plots | Images |
|---|---|---|
| Comparison with Poisson distribution Blue bars denote a histogram of data divided into 1 sec bins. Red curve is a Poisson curve with rate = median count rate of data. |
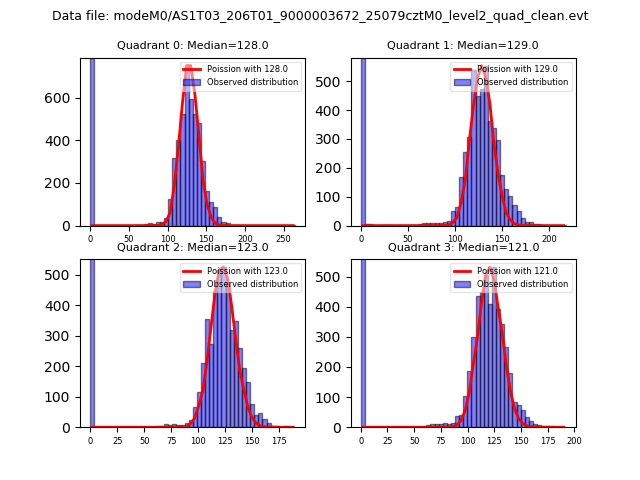 |
 |
| Quadrant-wise count rates Data is divided into 100 sec bins |
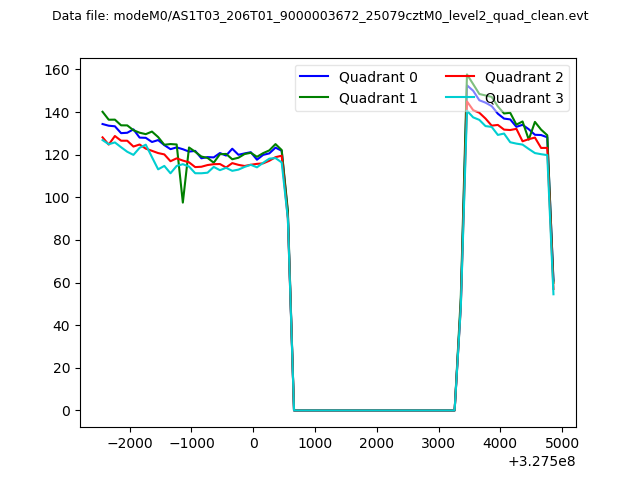 |
|
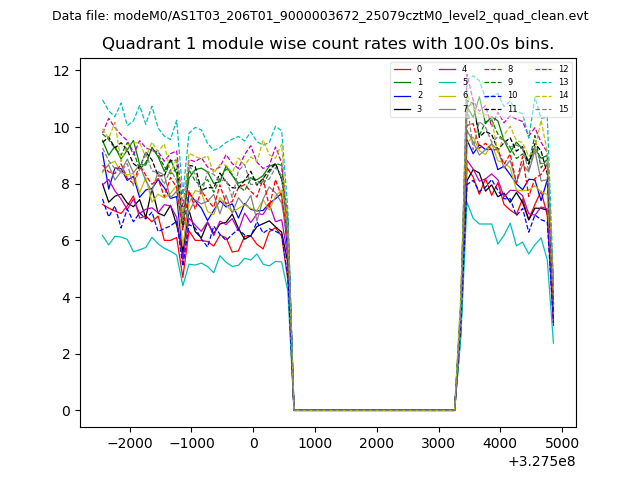
| Module-wise count rates for Quadrant A Data is divided into 100 sec bins |
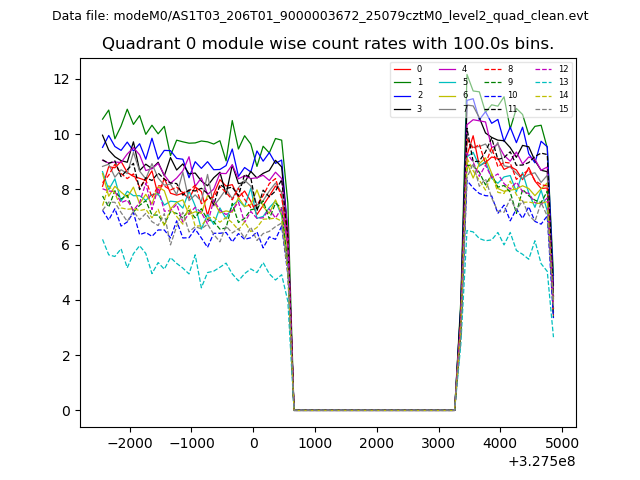 |
 |
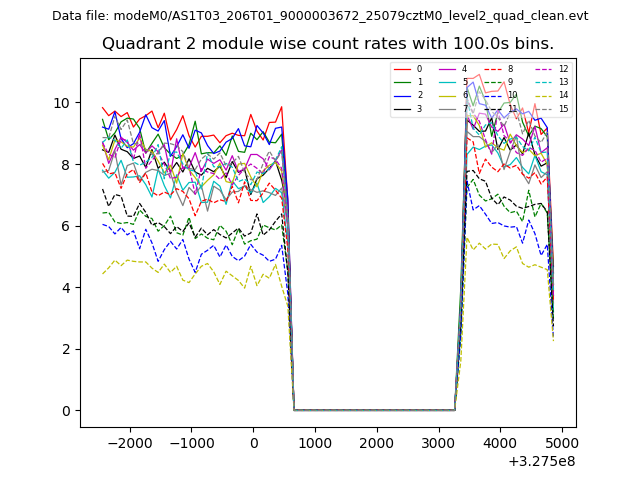
| Module-wise count rates for Quadrant B Data is divided into 100 sec bins |
 |
 |
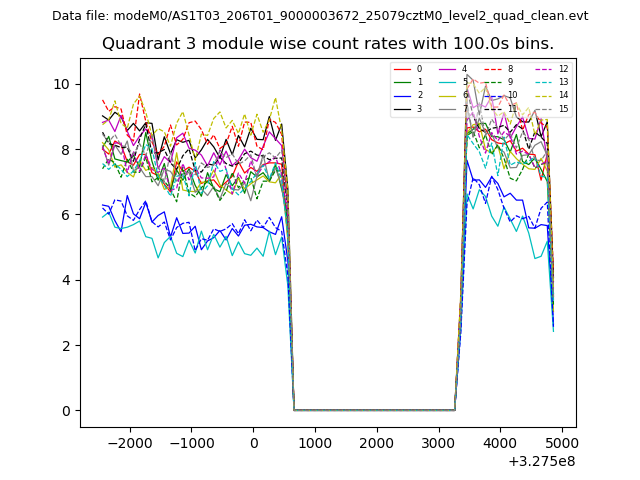
| Module-wise count rates for Quadrant C Data is divided into 100 sec bins |
 |
 |
| Module-wise count rates for Quadrant D Data is divided into 100 sec bins |
 |
 |
| Parameter | Plot |
|---|---|
| CZT HV Monitor | 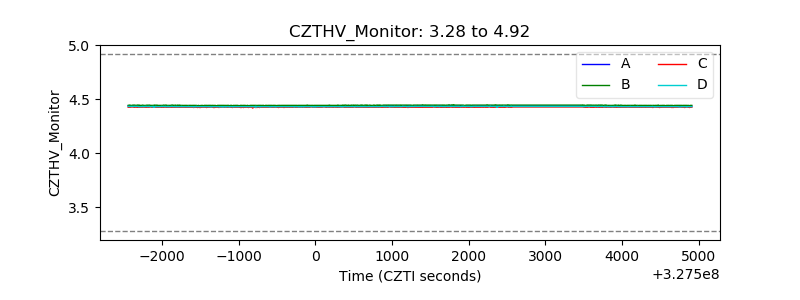 |
| D_VDD | 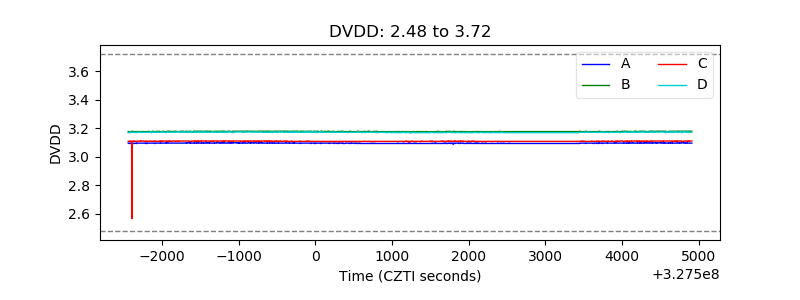 |
| Temperature 1 | 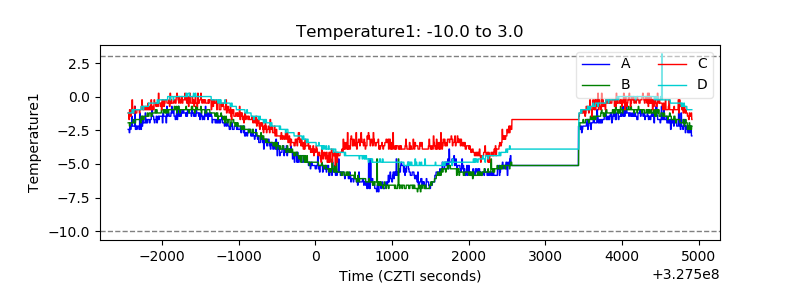 |
| Veto HV Monitor | 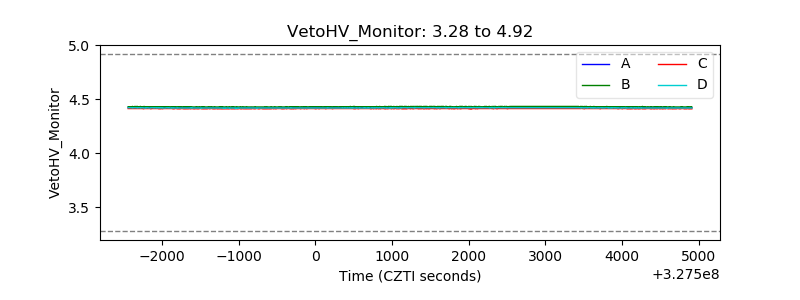 |
| Veto LLD | 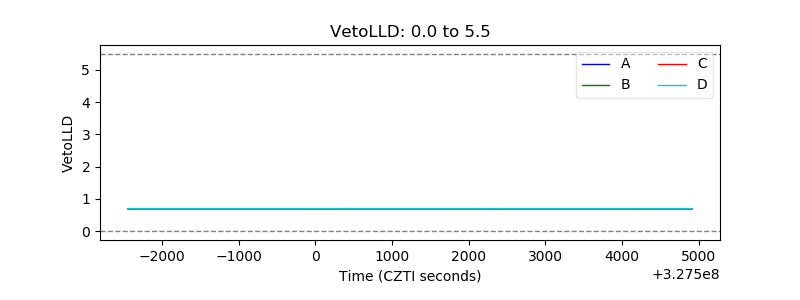 |
| Alpha Counter | 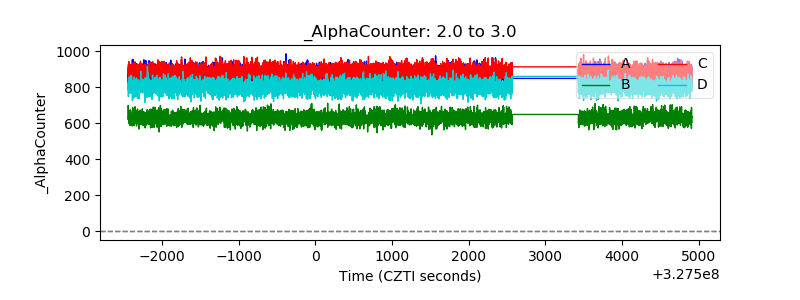 |
| _CPM_Rate | 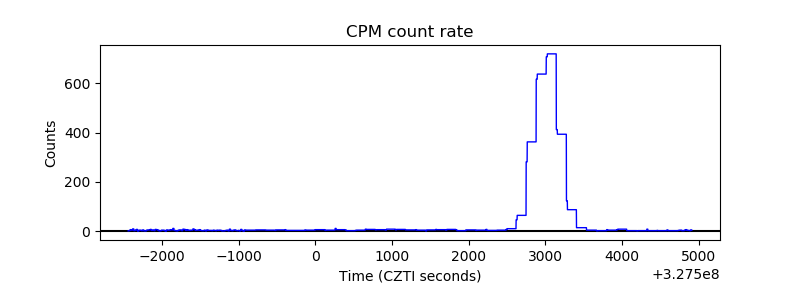 |
| CZT Counter | 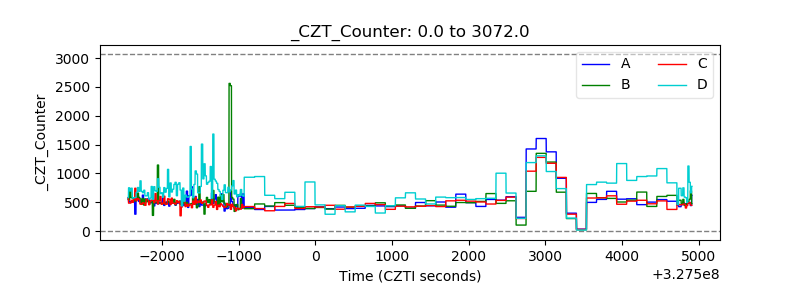 |
| +2.5 Volts monitor |  |
| +5 Volts monitor | 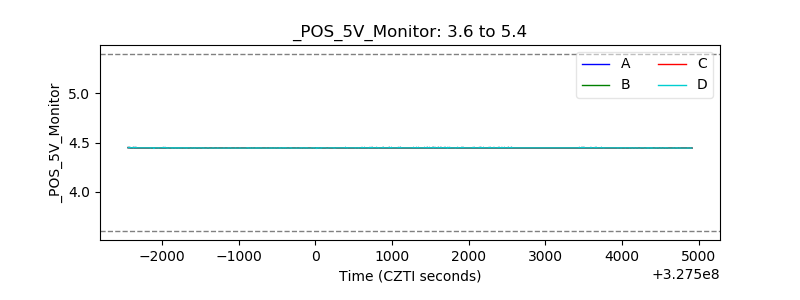 |
| _ROLL_ROT | 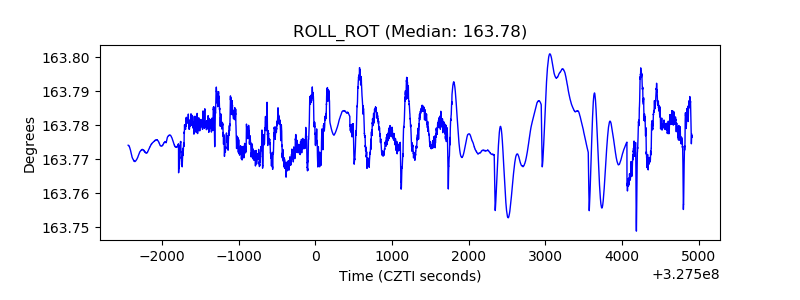 |
| _Roll_DEC | 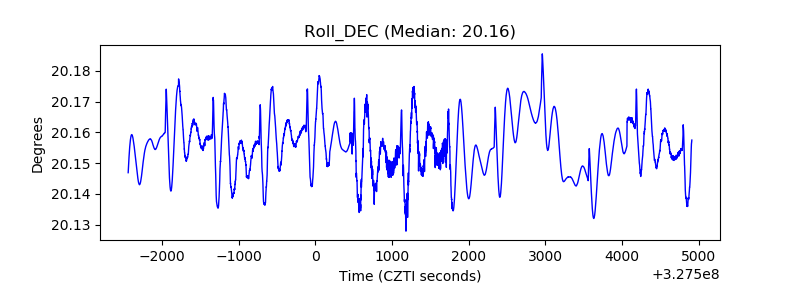 |
| _Roll_RA | 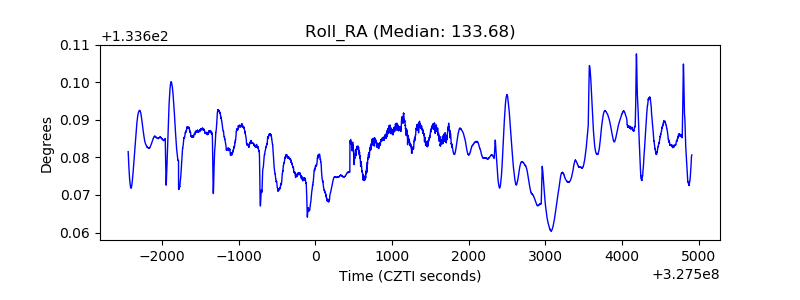 |
| Veto Counter | 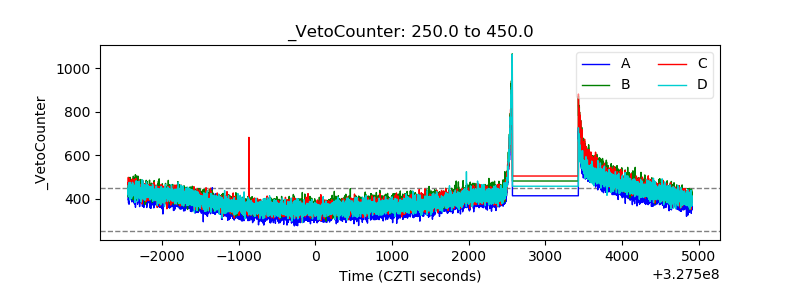 |