| Param | Original file | Final file |
|---|---|---|
| Filename | modeM0/AS1T03_206T01_9000003672_25080cztM0_level2.evt | modeM0/AS1T03_206T01_9000003672_25080cztM0_level2_quad_clean.evt |
| Size (bytes) | 476,579,520 | 81,593,280 |
| Size | 454.5 MB | 77.8 MB |
| Events in quadrant A | 2,905,058 | 524,203 |
| Events in quadrant B | 3,184,591 | 532,937 |
| Events in quadrant C | 2,937,656 | 504,175 |
| Events in quadrant D | 4,989,616 | 481,055 |
| Mode M9 | |||
|---|---|---|---|
| Quadrant | BADHDUFLAG | Total packets | Discarded packets |
| A | 0 | 10 | 0 |
| B | 0 | 10 | 0 |
| C | 0 | 10 | 0 |
| D | 0 | 10 | 0 |
| Mode SS | |||
|---|---|---|---|
| Quadrant | BADHDUFLAG | Total packets | Discarded packets |
| A | 0 | 63 | 0 |
| B | 0 | 63 | 0 |
| C | 0 | 63 | 0 |
| D | 0 | 63 | 0 |
| Mode M0 | |||
|---|---|---|---|
| Quadrant | BADHDUFLAG | Total packets | Discarded packets |
| A | 0 | 12663 | 0 |
| B | 0 | 13445 | 0 |
| C | 0 | 12679 | 0 |
| D | 0 | 19125 | 0 |
| Quadrant | Total seconds | Saturated seconds | Saturation percentage |
|---|---|---|---|
| A | 6130 | 36 | 0.587276% |
| B | 6131 | 55 | 0.897080% |
| C | 6131 | 63 | 1.027565% |
| D | 6131 | 190 | 3.099005% |
Noise dominated data is calculated using 1-second bins in cleaned event files. If a bin has >2000 counts, and if more than 50% of those come from <1% of pixels, then it is considered to be noise-dominated and hence unusable.
| Quadrant | # 1 sec bins | Bins with >0 counts | Bins with >2000 counts | High rate bins dominated by noise | Noise dominated (total time) | Noise dominated (detector-on time) | Marked lightcurve |
|---|---|---|---|---|---|---|---|
| A | 7165 | 6130 | 0 | 0 | 0.00% | 0.00% | 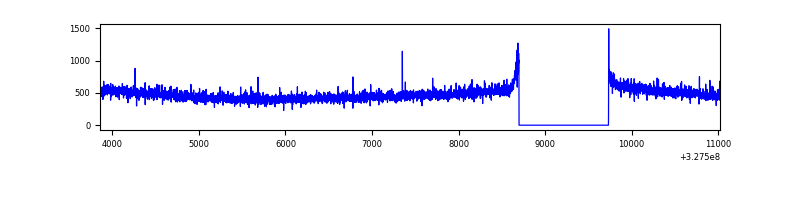 |
| B | 7166 | 6132 | 12 | 12 | 0.17% | 0.20% | 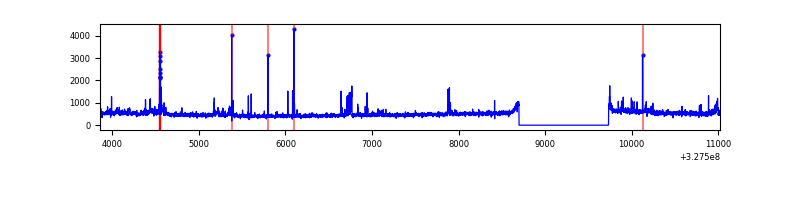 |
| C | 7166 | 6132 | 2 | 2 | 0.03% | 0.03% | 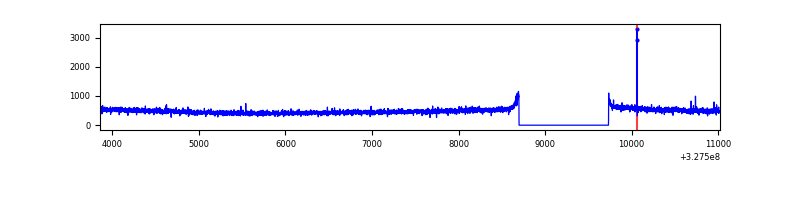 |
| D | 7166 | 6132 | 146 | 146 | 2.04% | 2.38% | 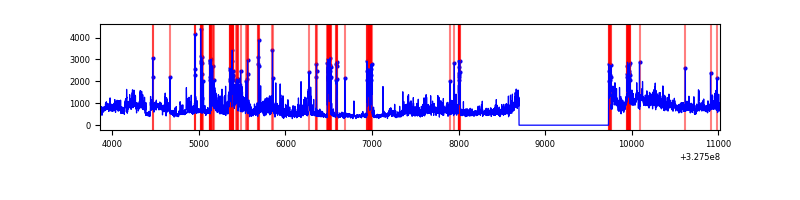 |
Top three noisy pixels from each quadrant. If the there are fewer than three noisy pixels in the level2.evt file, extra rows are filled as -1
| Pixel properties | Quadrant properties | ||||||
|---|---|---|---|---|---|---|---|
| Quadrant | DetID | PixID | Counts | Sigma | Mean | Median | Sigma |
| A | 13 | 254 | 9941 | 60.6 | 750 | 733 | 151.9 |
| A | 3 | 137 | 6680 | 39.14 | 750 | 733 | 151.9 |
| A | 0 | 226 | 6619 | 38.74 | 750 | 733 | 151.9 |
| B | 5 | 172 | 89575 | 626.26 | 747 | 731 | 141.9 |
| B | 0 | 190 | 85154 | 595.1 | 747 | 731 | 141.9 |
| B | 10 | 247 | 48036 | 333.45 | 747 | 731 | 141.9 |
| C | 14 | 238 | 113587 | 667.54 | 720 | 724 | 169.1 |
| C | 0 | 207 | 8479 | 45.87 | 720 | 724 | 169.1 |
| C | 13 | 61 | 5223 | 26.61 | 720 | 724 | 169.1 |
| D | 8 | 195 | 802215 | 4544.94 | 724 | 703 | 176.4 |
| D | 9 | 35 | 638502 | 3616.62 | 724 | 703 | 176.4 |
| D | 1 | 52 | 613652 | 3475.7 | 724 | 703 | 176.4 |
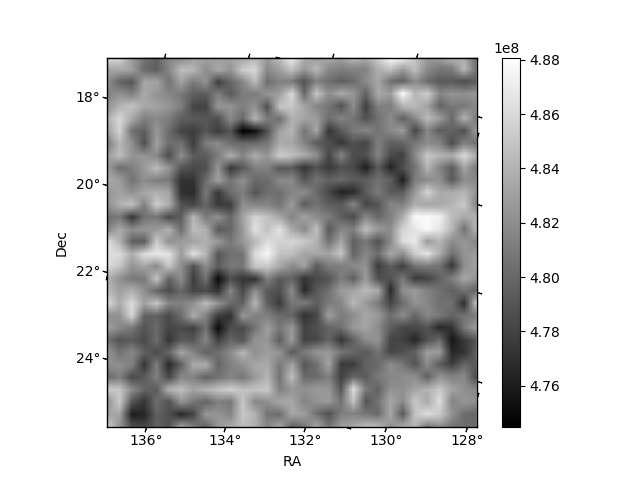
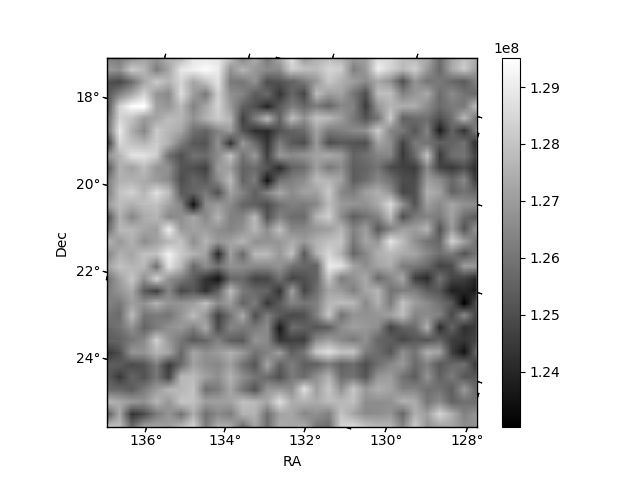
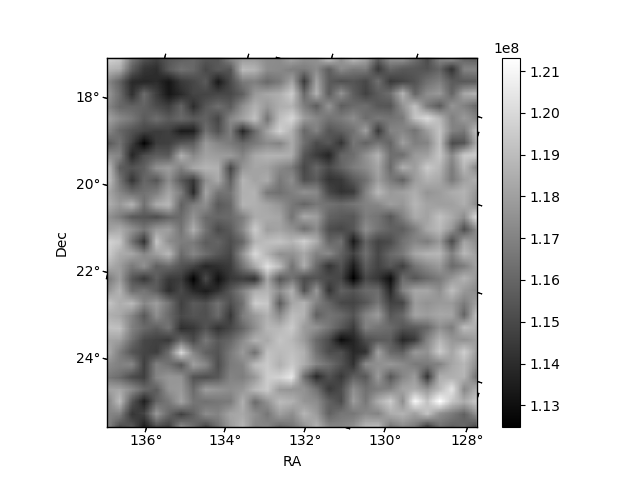
Histogram calculated using DETX and DETY for each event in the final _common_clean file
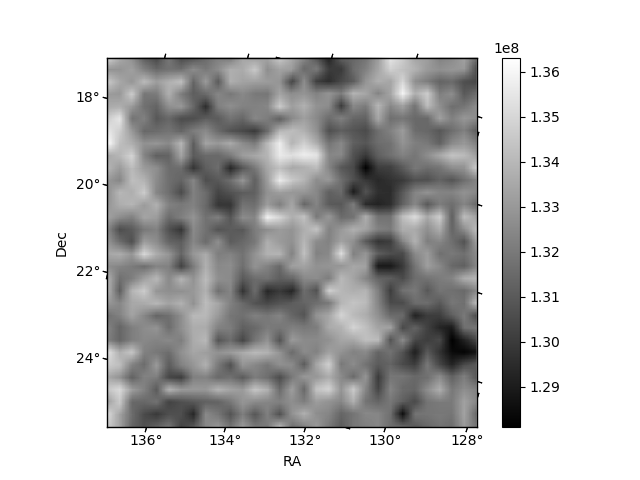
| Quadrant A | 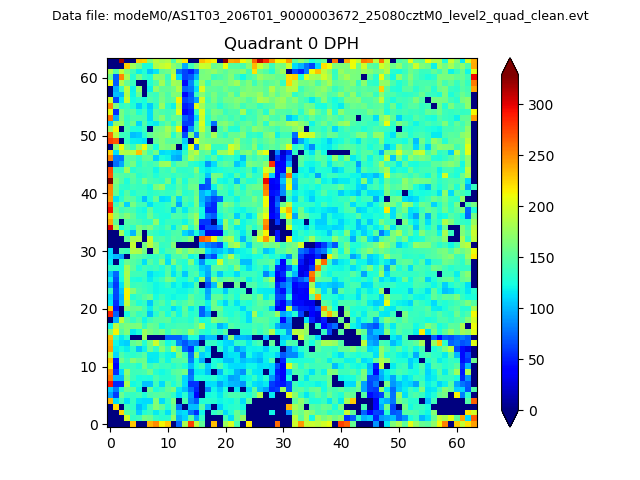 |
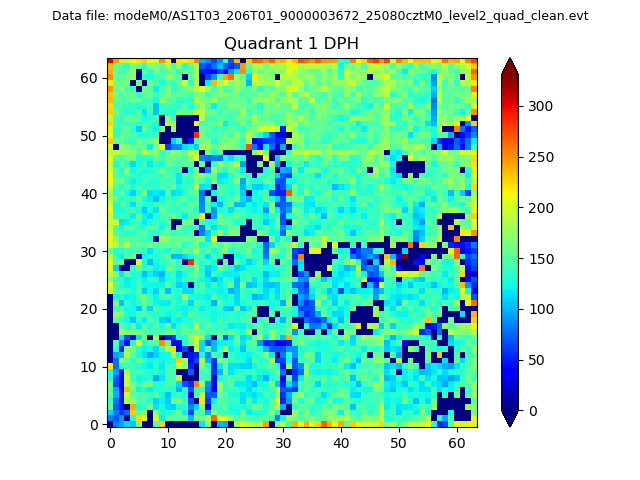 |
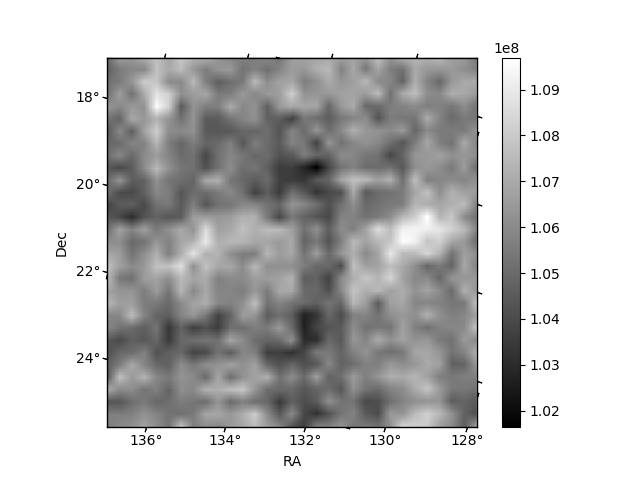
Quadrant B |
|---|---|---|---|
| Quadrant D |  |
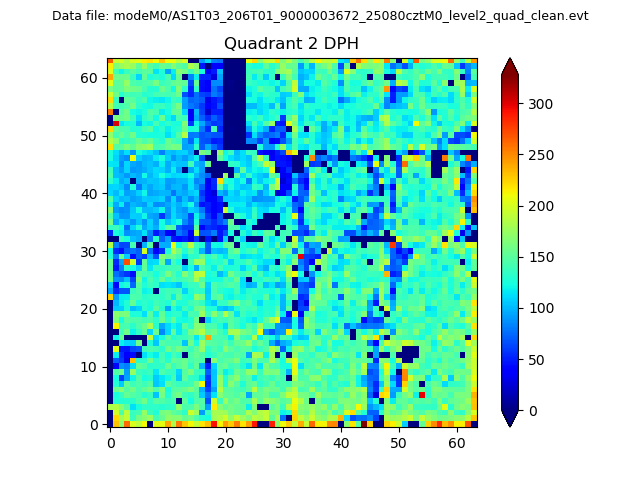 |
Quadrant C |
| Plot type | Count rate plots | Images |
|---|---|---|
| Comparison with Poisson distribution Blue bars denote a histogram of data divided into 1 sec bins. Red curve is a Poisson curve with rate = median count rate of data. |
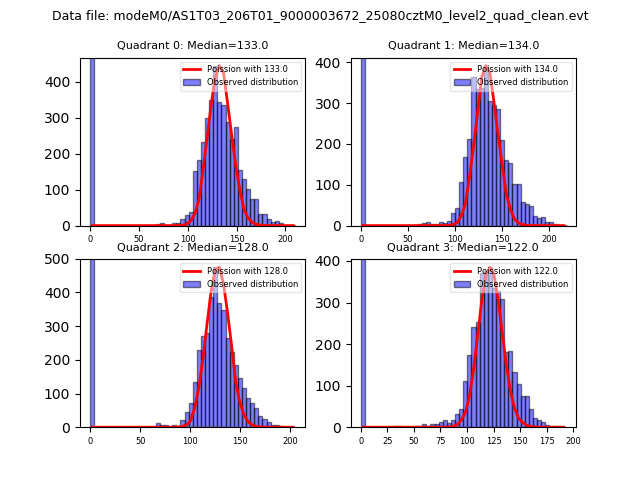 |
 |
| Quadrant-wise count rates Data is divided into 100 sec bins |
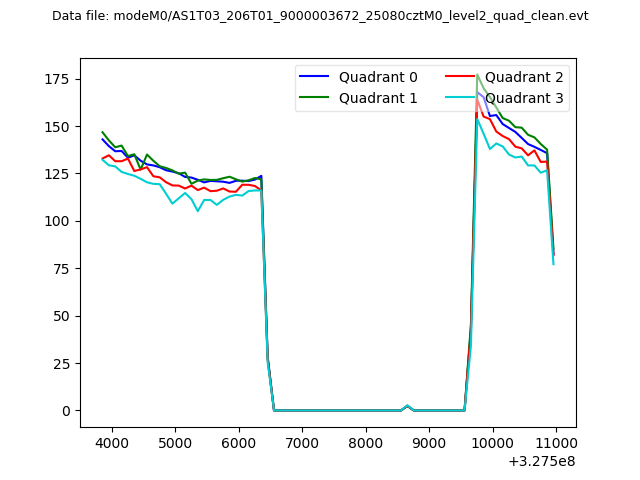 |
|
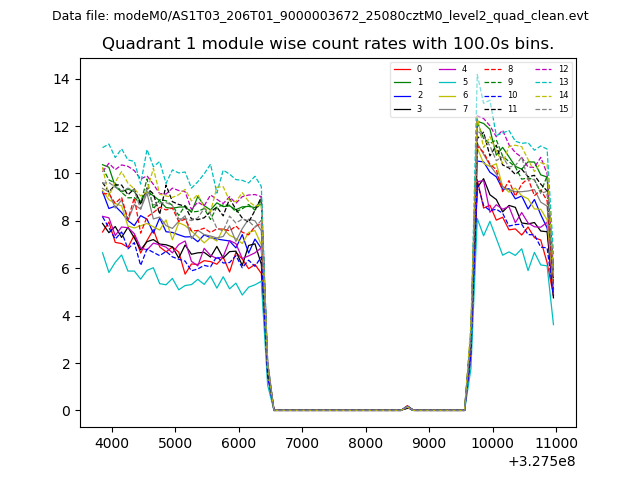
| Module-wise count rates for Quadrant A Data is divided into 100 sec bins |
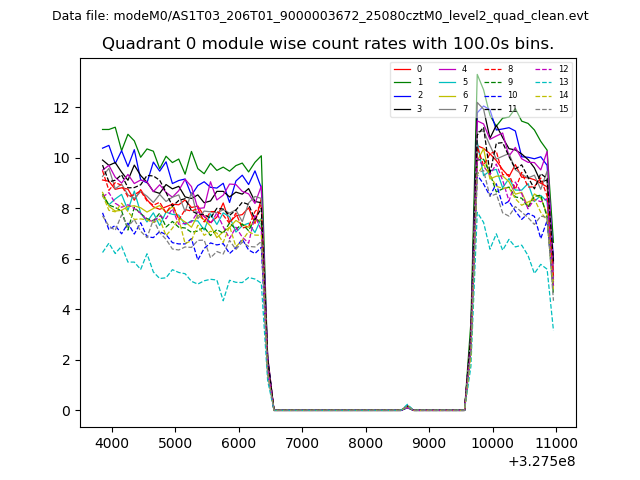 |
 |
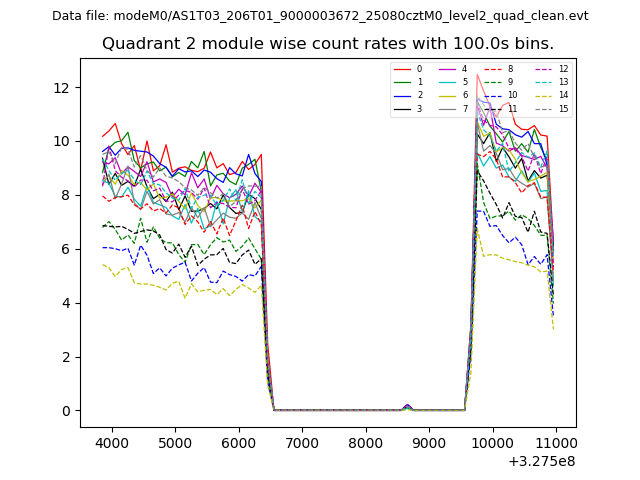
| Module-wise count rates for Quadrant B Data is divided into 100 sec bins |
 |
 |
| Module-wise count rates for Quadrant C Data is divided into 100 sec bins |
 |
 |
| Module-wise count rates for Quadrant D Data is divided into 100 sec bins |
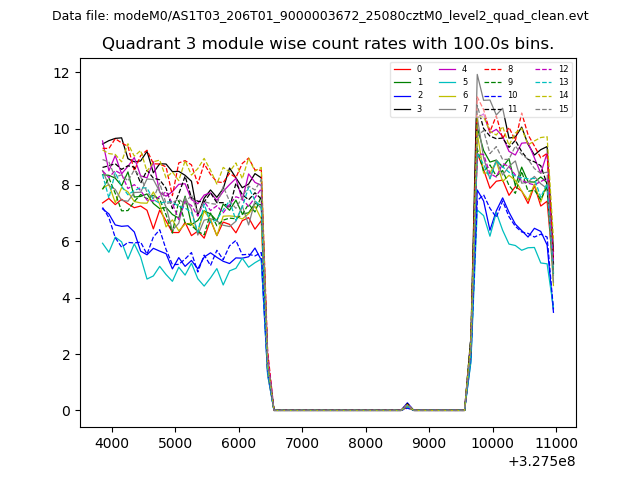 |
 |
| Parameter | Plot |
|---|---|
| CZT HV Monitor | 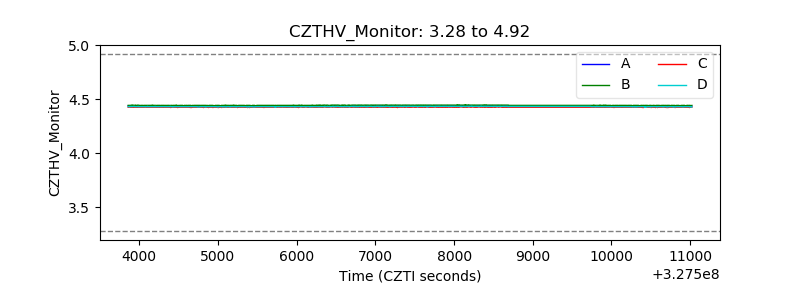 |
| D_VDD | 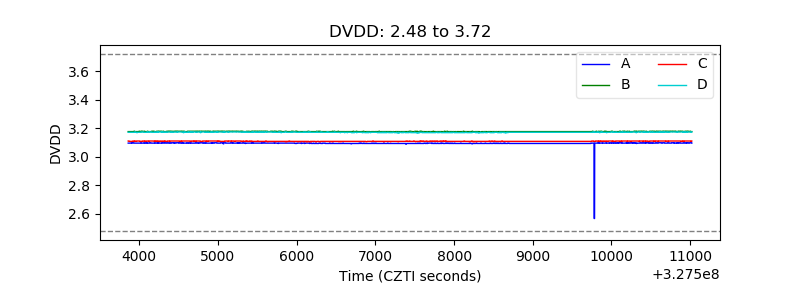 |
| Temperature 1 | 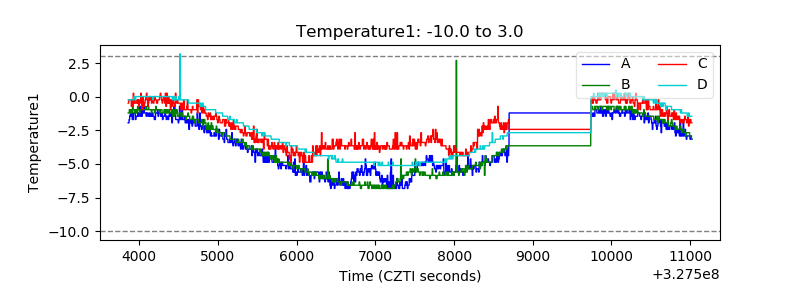 |
| Veto HV Monitor |  |
| Veto LLD | 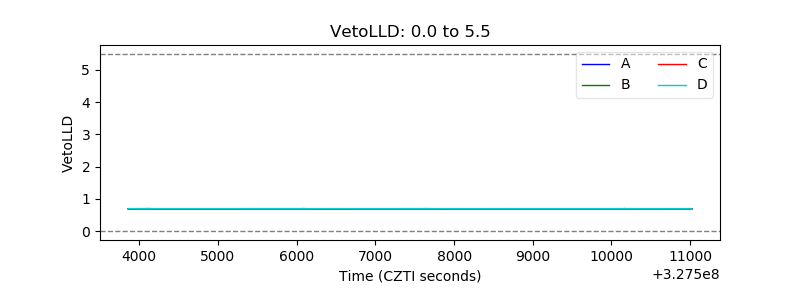 |
| Alpha Counter | 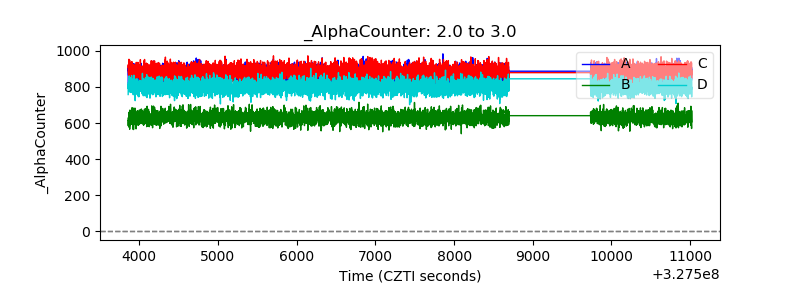 |
| _CPM_Rate |  |
| CZT Counter | 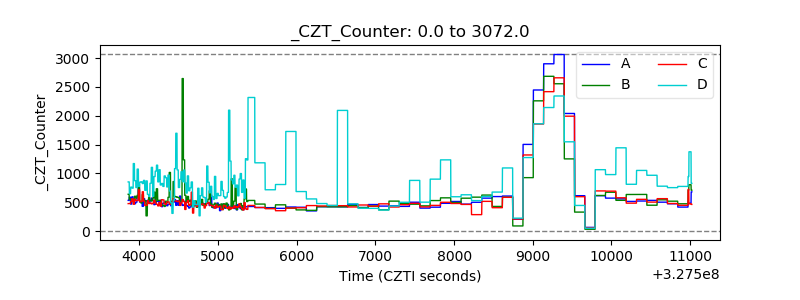 |
| +2.5 Volts monitor | 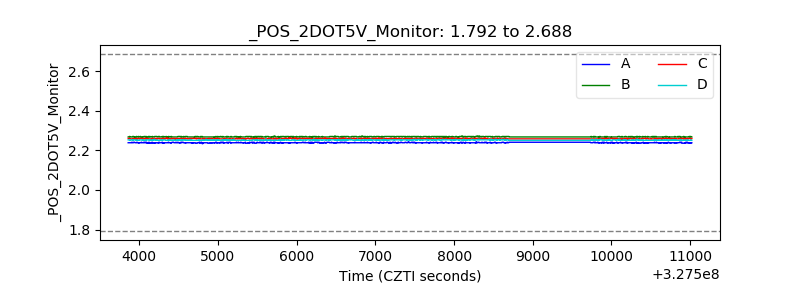 |
| +5 Volts monitor |  |
| _ROLL_ROT | 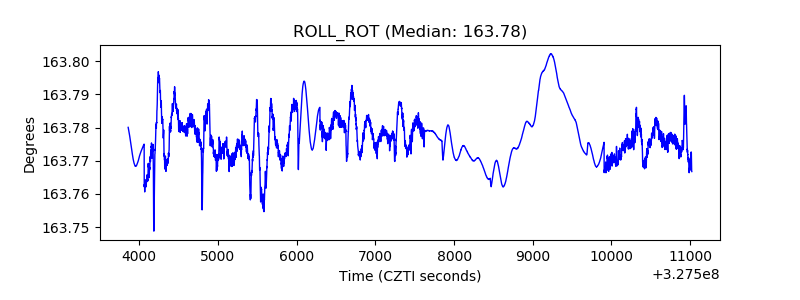 |
| _Roll_DEC | 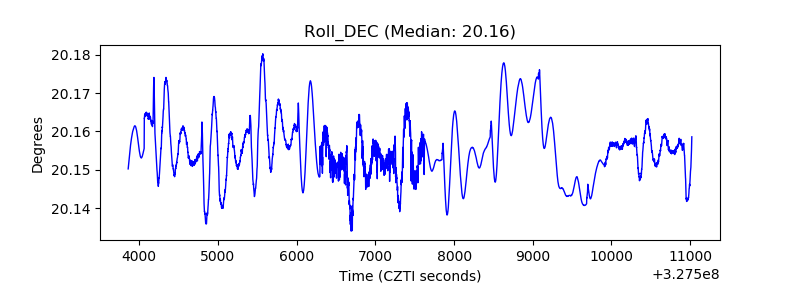 |
| _Roll_RA | 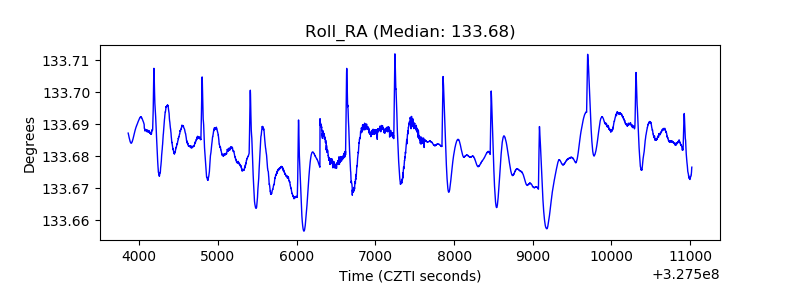 |
| Veto Counter | 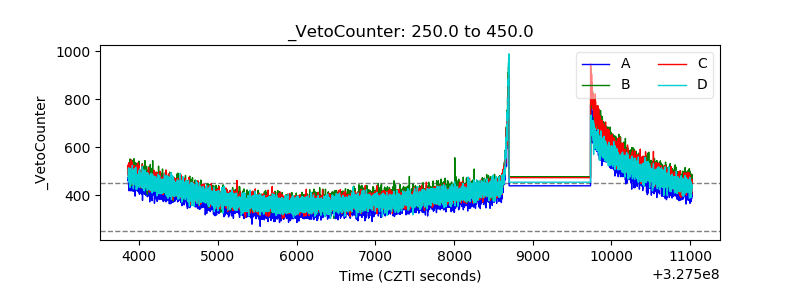 |