| Param | Original file | Final file |
|---|---|---|
| Filename | modeM0/AS1T03_206T01_9000003672_25083cztM0_level2.evt | modeM0/AS1T03_206T01_9000003672_25083cztM0_level2_quad_clean.evt |
| Size (bytes) | 501,367,680 | 94,619,520 |
| Size | 478.1 MB | 90.2 MB |
| Events in quadrant A | 3,148,664 | 627,511 |
| Events in quadrant B | 3,546,160 | 642,167 |
| Events in quadrant C | 3,216,504 | 599,613 |
| Events in quadrant D | 4,849,567 | 560,543 |
| Mode M9 | |||
|---|---|---|---|
| Quadrant | BADHDUFLAG | Total packets | Discarded packets |
| A | 0 | 14 | 0 |
| B | 0 | 15 | 0 |
| C | 0 | 15 | 0 |
| D | 0 | 15 | 0 |
| Mode SS | |||
|---|---|---|---|
| Quadrant | BADHDUFLAG | Total packets | Discarded packets |
| A | 0 | 128 | 64 |
| B | 0 | 128 | 64 |
| C | 0 | 128 | 64 |
| D | 0 | 128 | 64 |
| Mode M0 | |||
|---|---|---|---|
| Quadrant | BADHDUFLAG | Total packets | Discarded packets |
| A | 0 | 13256 | 0 |
| B | 0 | 14590 | 0 |
| C | 0 | 13388 | 0 |
| D | 0 | 18701 | 0 |
| Quadrant | Total seconds | Saturated seconds | Saturation percentage |
|---|---|---|---|
| A | 6236 | 36 | 0.577293% |
| B | 6236 | 88 | 1.411161% |
| C | 6236 | 74 | 1.186658% |
| D | 6235 | 198 | 3.175621% |
Noise dominated data is calculated using 1-second bins in cleaned event files. If a bin has >2000 counts, and if more than 50% of those come from <1% of pixels, then it is considered to be noise-dominated and hence unusable.
| Quadrant | # 1 sec bins | Bins with >0 counts | Bins with >2000 counts | High rate bins dominated by noise | Noise dominated (total time) | Noise dominated (detector-on time) | Marked lightcurve |
|---|---|---|---|---|---|---|---|
| A | 7486 | 6237 | 0 | 0 | 0.00% | 0.00% | 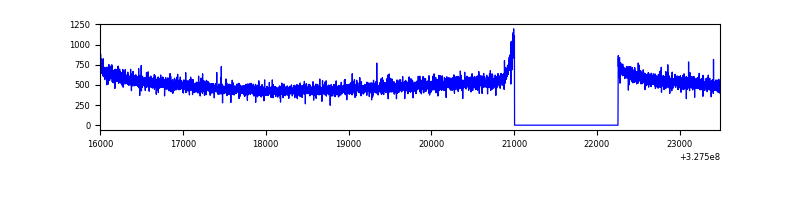 |
| B | 7486 | 6237 | 29 | 29 | 0.39% | 0.46% | 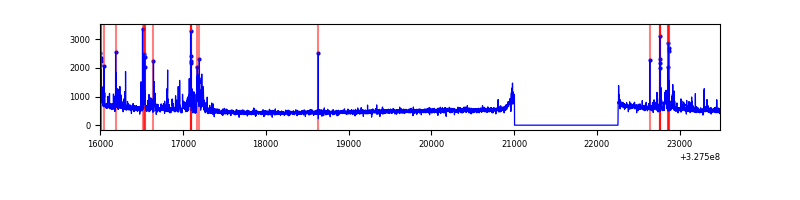 |
| C | 7486 | 6237 | 0 | 0 | 0.00% | 0.00% | 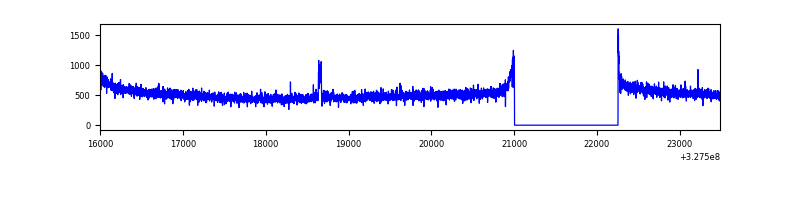 |
| D | 7485 | 6236 | 130 | 130 | 1.74% | 2.08% | 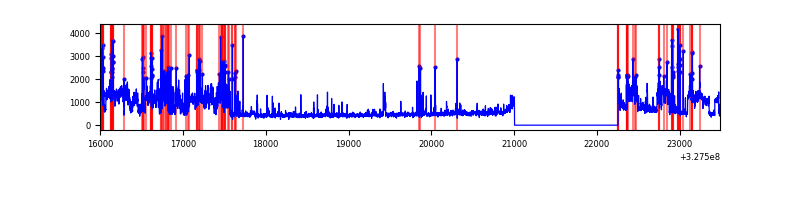 |
Top three noisy pixels from each quadrant. If the there are fewer than three noisy pixels in the level2.evt file, extra rows are filled as -1
| Pixel properties | Quadrant properties | ||||||
|---|---|---|---|---|---|---|---|
| Quadrant | DetID | PixID | Counts | Sigma | Mean | Median | Sigma |
| A | 13 | 254 | 11818 | 67.9 | 815 | 800 | 162.3 |
| A | 0 | 226 | 7144 | 39.1 | 815 | 800 | 162.3 |
| A | 3 | 137 | 6724 | 36.51 | 815 | 800 | 162.3 |
| B | 0 | 229 | 147380 | 956.92 | 817 | 799 | 153.2 |
| B | 5 | 172 | 78907 | 509.91 | 817 | 799 | 153.2 |
| B | 0 | 190 | 66456 | 428.63 | 817 | 799 | 153.2 |
| C | 14 | 238 | 124414 | 675.34 | 782 | 786 | 183.1 |
| C | 7 | 247 | 28022 | 148.78 | 782 | 786 | 183.1 |
| C | 1 | 16 | 11282 | 57.34 | 782 | 786 | 183.1 |
| D | 9 | 35 | 1080261 | 5704.85 | 776 | 753 | 189.2 |
| D | 1 | 52 | 283055 | 1491.88 | 776 | 753 | 189.2 |
| D | 12 | 233 | 216770 | 1141.58 | 776 | 753 | 189.2 |
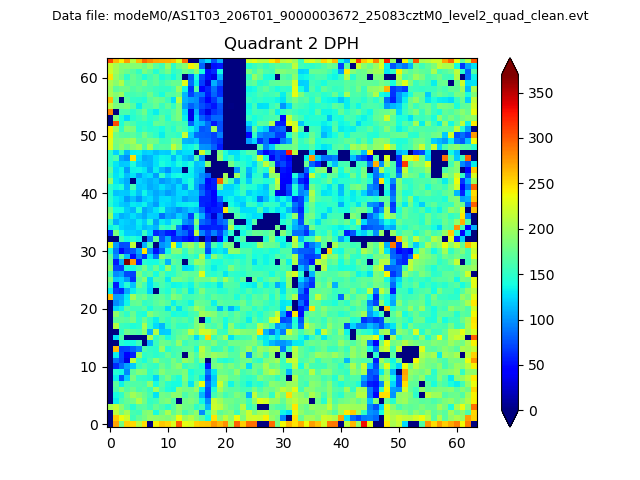
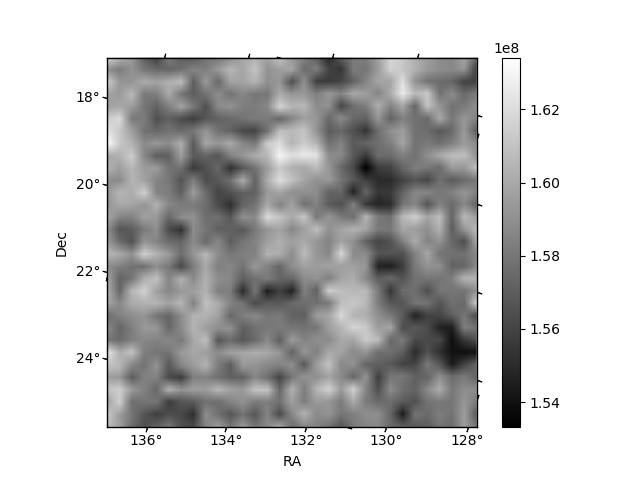
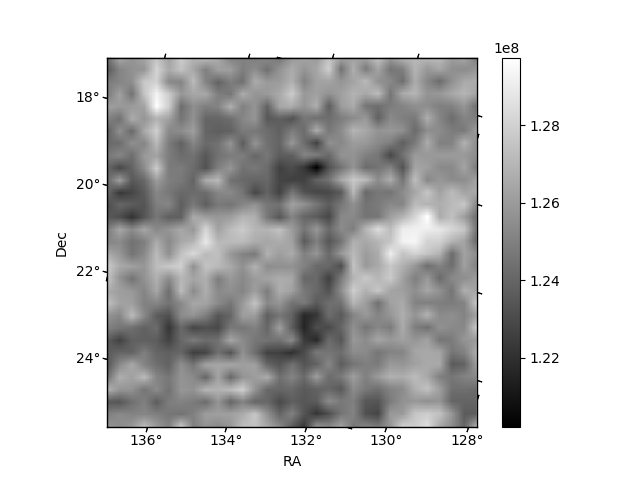
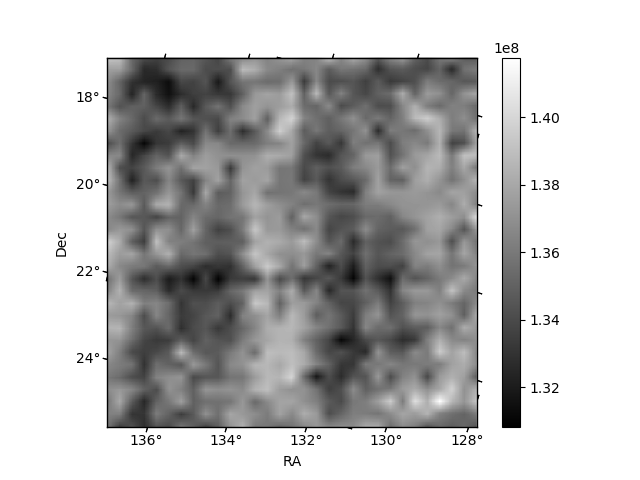
Histogram calculated using DETX and DETY for each event in the final _common_clean file
| Quadrant A | 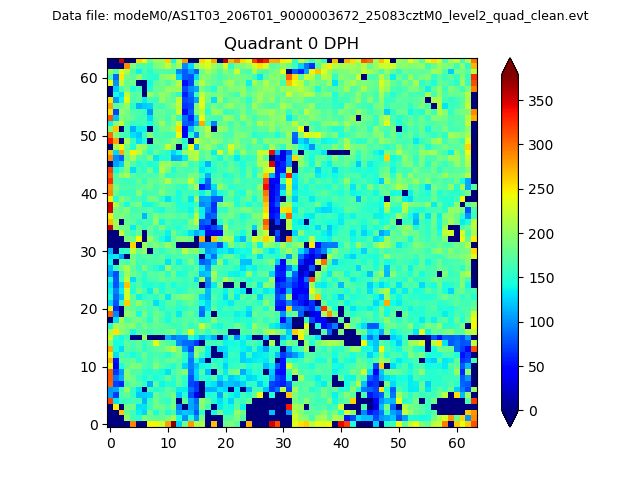 |
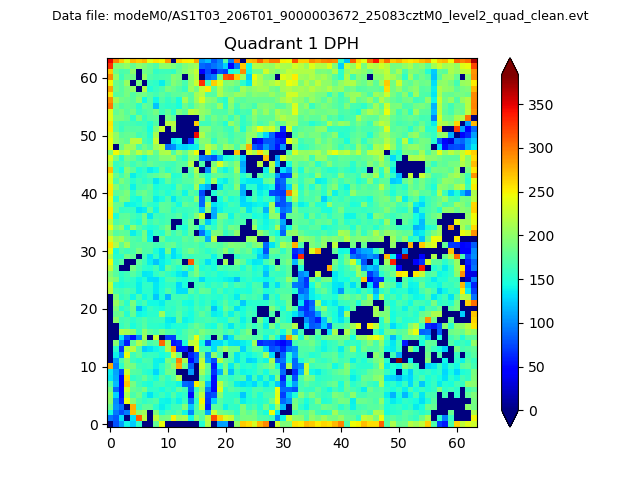 |
Quadrant B |
|---|---|---|---|
| Quadrant D | 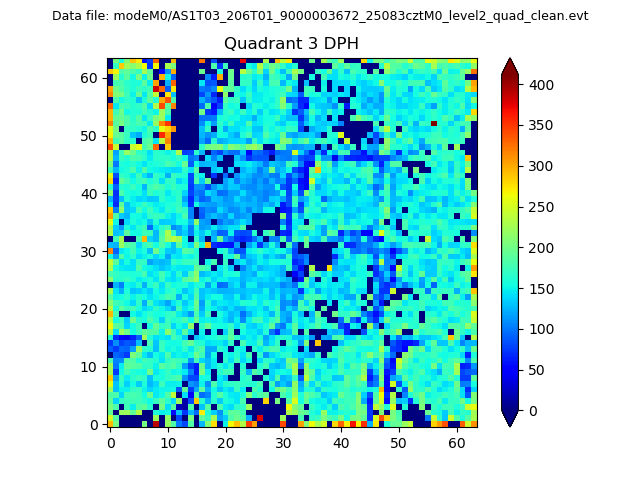 |
 |
Quadrant C |
| Plot type | Count rate plots | Images |
|---|---|---|
| Comparison with Poisson distribution Blue bars denote a histogram of data divided into 1 sec bins. Red curve is a Poisson curve with rate = median count rate of data. |
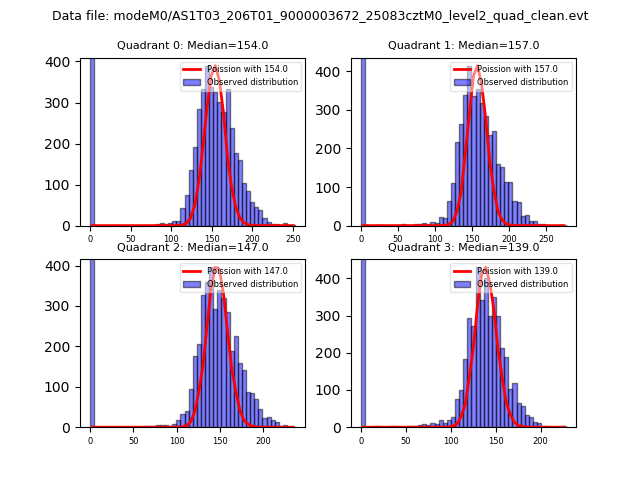 |
 |
| Quadrant-wise count rates Data is divided into 100 sec bins |
 |
|
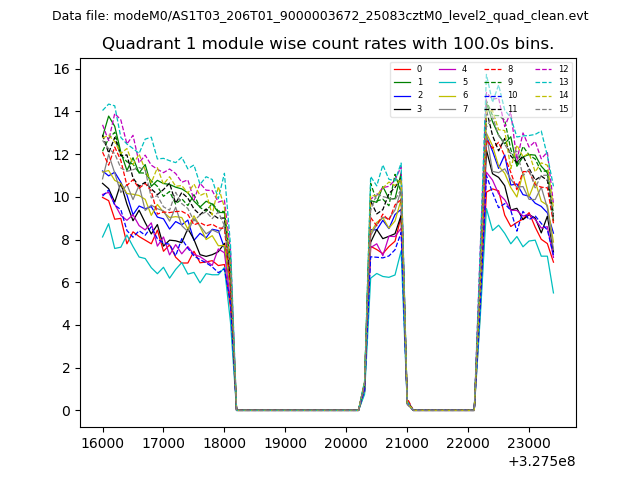
| Module-wise count rates for Quadrant A Data is divided into 100 sec bins |
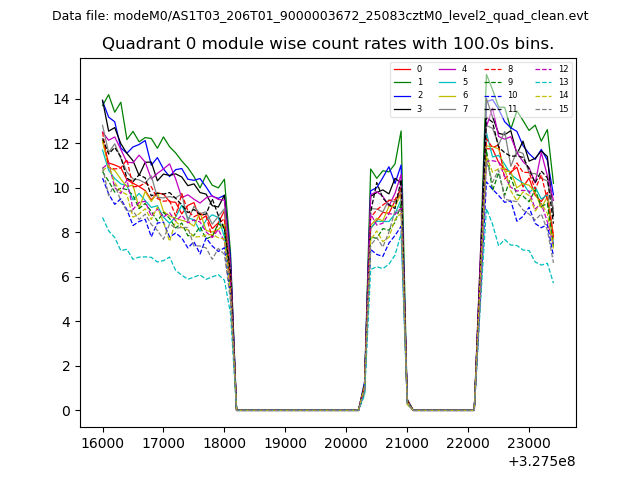 |
 |
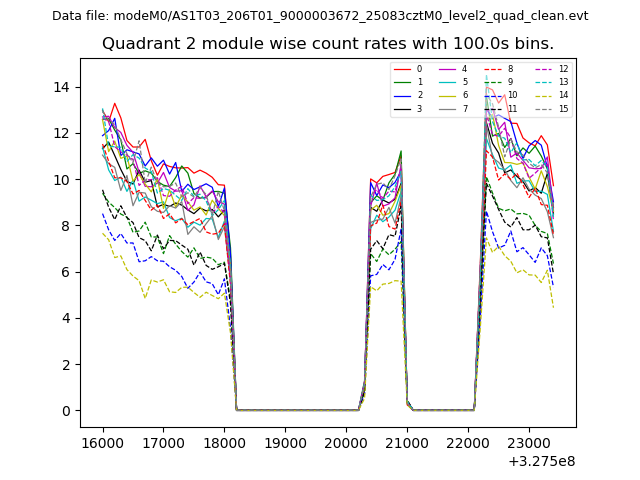
| Module-wise count rates for Quadrant B Data is divided into 100 sec bins |
 |
 |
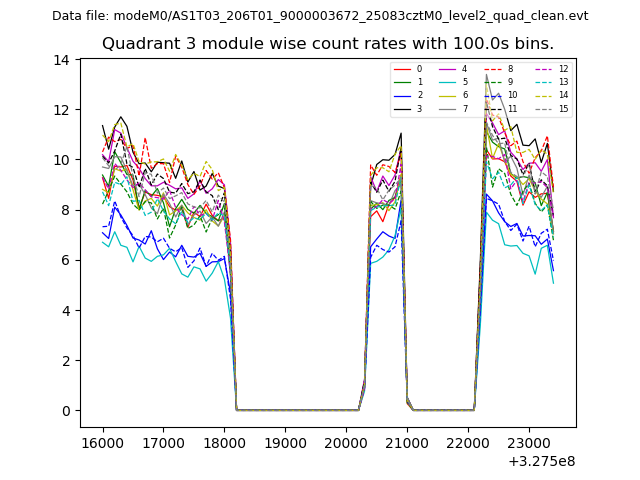
| Module-wise count rates for Quadrant C Data is divided into 100 sec bins |
 |
 |
| Module-wise count rates for Quadrant D Data is divided into 100 sec bins |
 |
 |
| Parameter | Plot |
|---|---|
| CZT HV Monitor | 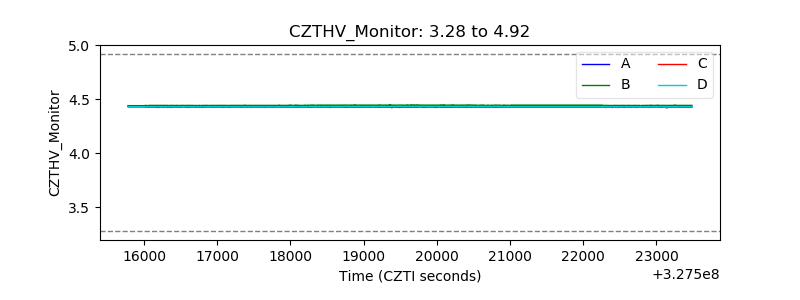 |
| D_VDD | 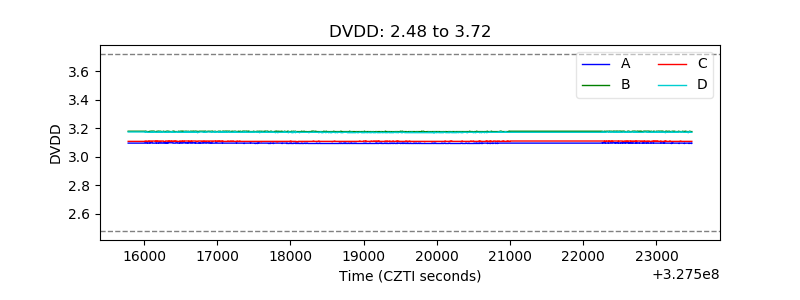 |
| Temperature 1 | 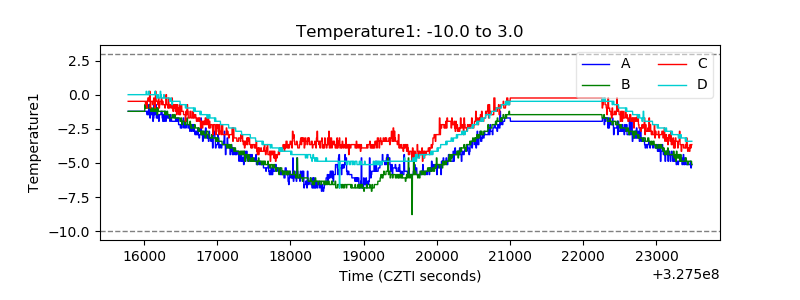 |
| Veto HV Monitor | 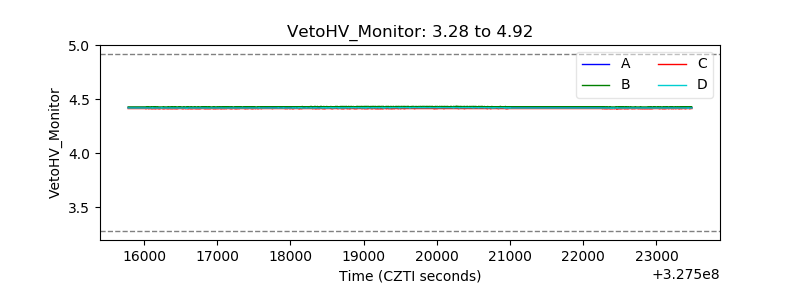 |
| Veto LLD | 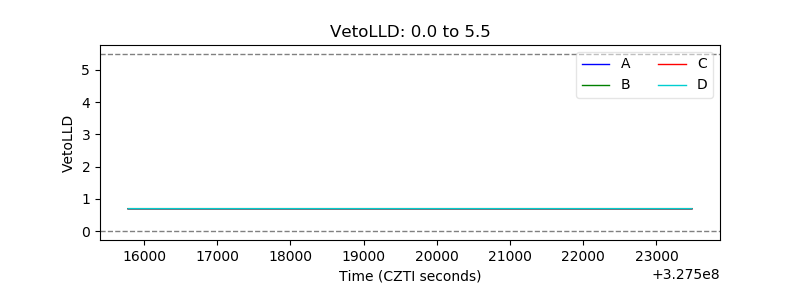 |
| Alpha Counter |  |
| _CPM_Rate | 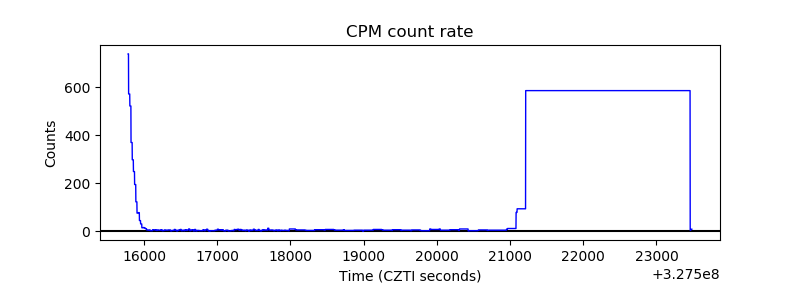 |
| CZT Counter | 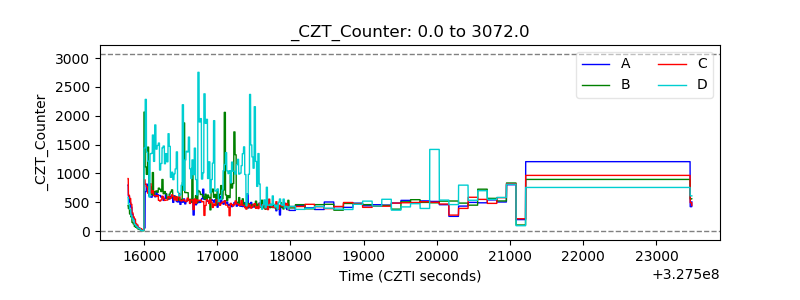 |
| +2.5 Volts monitor |  |
| +5 Volts monitor |  |
| _ROLL_ROT | 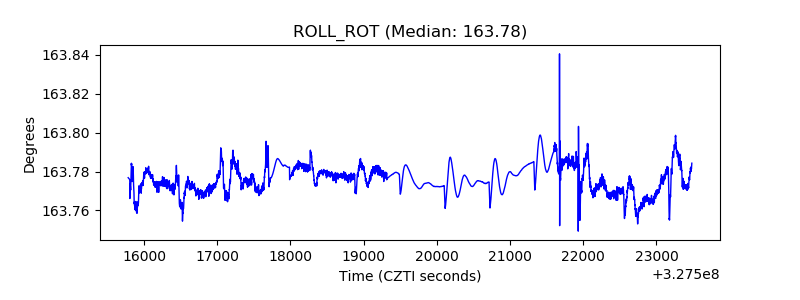 |
| _Roll_DEC | 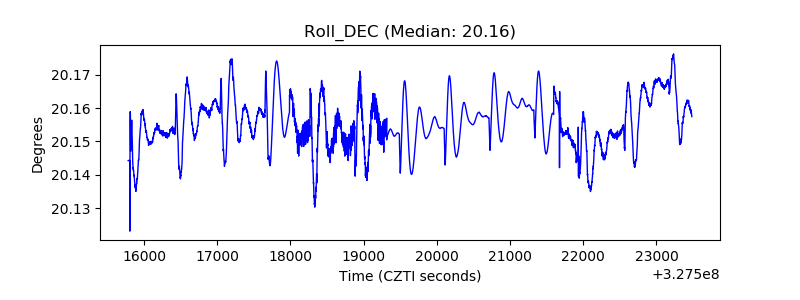 |
| _Roll_RA | 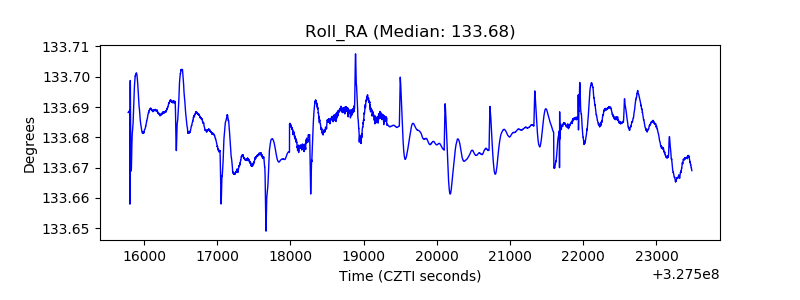 |
| Veto Counter | 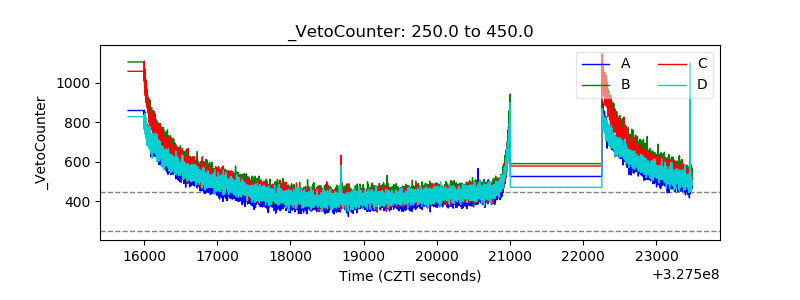 |