| Param | Original file | Final file |
|---|---|---|
| Filename | modeM0/AS1T03_206T01_9000003672_25084cztM0_level2.evt | modeM0/AS1T03_206T01_9000003672_25084cztM0_level2_quad_clean.evt |
| Size (bytes) | 492,033,600 | 93,888,000 |
| Size | 469.2 MB | 89.5 MB |
| Events in quadrant A | 3,144,804 | 624,371 |
| Events in quadrant B | 3,345,231 | 645,599 |
| Events in quadrant C | 3,188,043 | 595,902 |
| Events in quadrant D | 4,811,881 | 553,744 |
| Mode M9 | |||
|---|---|---|---|
| Quadrant | BADHDUFLAG | Total packets | Discarded packets |
| A | 0 | 15 | 0 |
| B | 0 | 16 | 0 |
| C | 0 | 16 | 0 |
| D | 0 | 16 | 0 |
| Mode SS | |||
|---|---|---|---|
| Quadrant | BADHDUFLAG | Total packets | Discarded packets |
| A | 0 | 122 | 61 |
| B | 0 | 122 | 61 |
| C | 0 | 122 | 61 |
| D | 0 | 122 | 61 |
| Mode M0 | |||
|---|---|---|---|
| Quadrant | BADHDUFLAG | Total packets | Discarded packets |
| A | 0 | 12996 | 0 |
| B | 0 | 13662 | 0 |
| C | 0 | 13077 | 0 |
| D | 0 | 18480 | 0 |
| Quadrant | Total seconds | Saturated seconds | Saturation percentage |
|---|---|---|---|
| A | 6071 | 29 | 0.477681% |
| B | 6071 | 53 | 0.873003% |
| C | 6070 | 74 | 1.219110% |
| D | 6070 | 193 | 3.179572% |
Noise dominated data is calculated using 1-second bins in cleaned event files. If a bin has >2000 counts, and if more than 50% of those come from <1% of pixels, then it is considered to be noise-dominated and hence unusable.
| Quadrant | # 1 sec bins | Bins with >0 counts | Bins with >2000 counts | High rate bins dominated by noise | Noise dominated (total time) | Noise dominated (detector-on time) | Marked lightcurve |
|---|---|---|---|---|---|---|---|
| A | 7421 | 6072 | 0 | 0 | 0.00% | 0.00% | 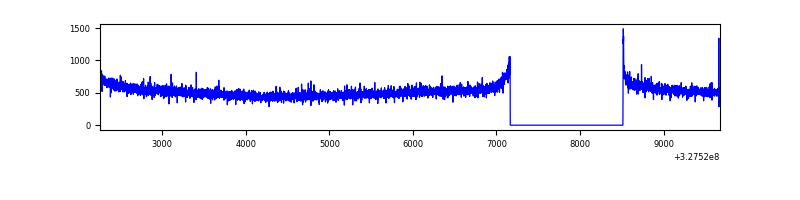 |
| B | 7421 | 6072 | 12 | 12 | 0.16% | 0.20% | 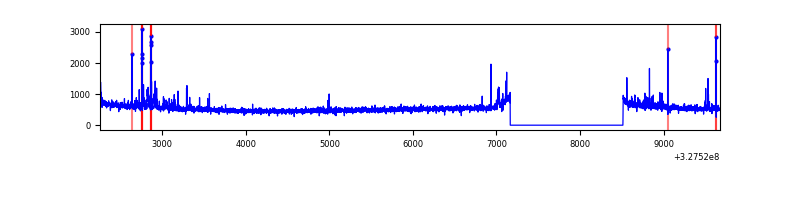 |
| C | 7420 | 6071 | 3 | 3 | 0.04% | 0.05% | 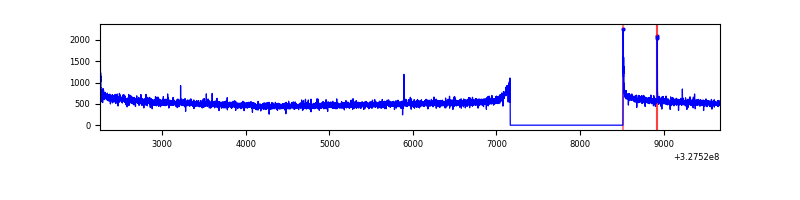 |
| D | 7420 | 6071 | 123 | 123 | 1.66% | 2.03% | 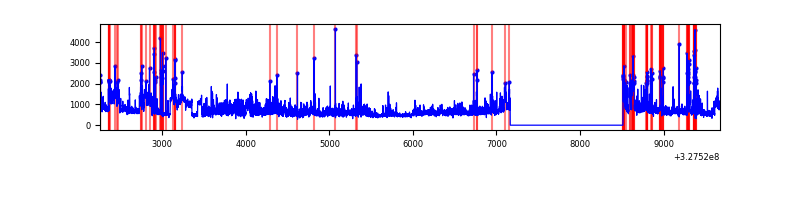 |
Top three noisy pixels from each quadrant. If the there are fewer than three noisy pixels in the level2.evt file, extra rows are filled as -1
| Pixel properties | Quadrant properties | ||||||
|---|---|---|---|---|---|---|---|
| Quadrant | DetID | PixID | Counts | Sigma | Mean | Median | Sigma |
| A | 13 | 254 | 11575 | 66.36 | 812 | 798 | 162.4 |
| A | 13 | 34 | 8421 | 46.94 | 812 | 798 | 162.4 |
| A | 0 | 226 | 7212 | 39.49 | 812 | 798 | 162.4 |
| B | 0 | 190 | 50571 | 328.75 | 818 | 801 | 151.4 |
| B | 0 | 229 | 44963 | 291.71 | 818 | 801 | 151.4 |
| B | 5 | 172 | 34882 | 225.12 | 818 | 801 | 151.4 |
| C | 14 | 238 | 124734 | 688.67 | 775 | 784 | 180.0 |
| C | 0 | 10 | 15280 | 80.54 | 775 | 784 | 180.0 |
| C | 7 | 247 | 12810 | 66.82 | 775 | 784 | 180.0 |
| D | 8 | 195 | 621015 | 3307.46 | 768 | 746 | 187.5 |
| D | 9 | 35 | 604463 | 3219.2 | 768 | 746 | 187.5 |
| D | 1 | 52 | 245544 | 1305.34 | 768 | 746 | 187.5 |
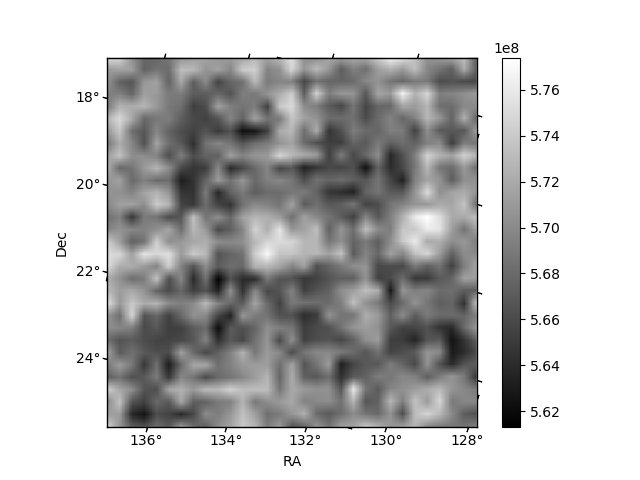
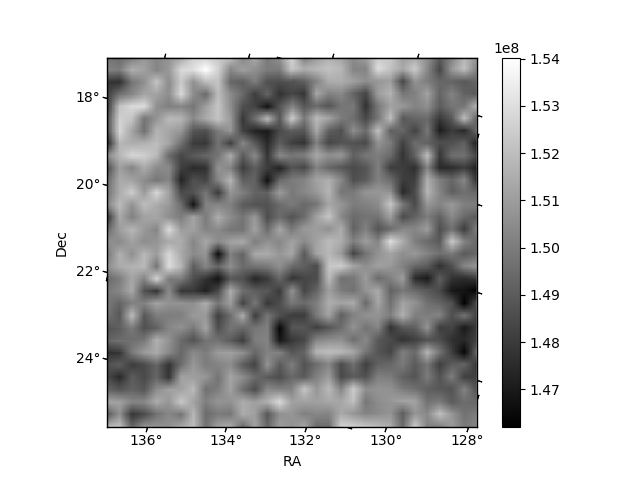
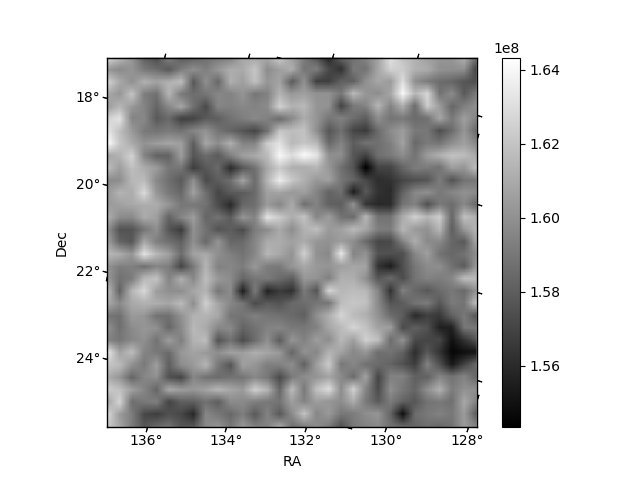
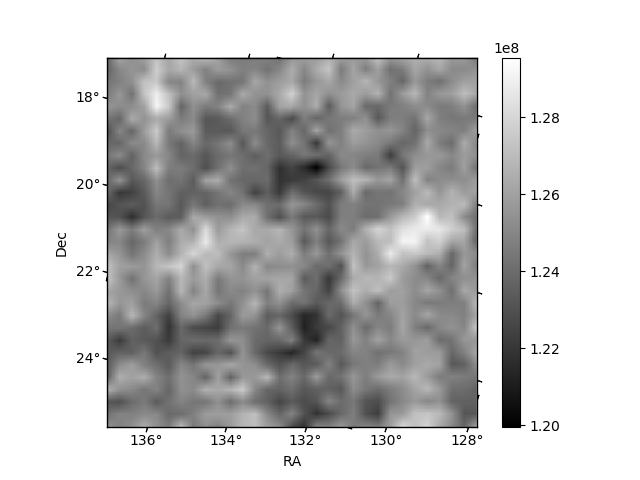
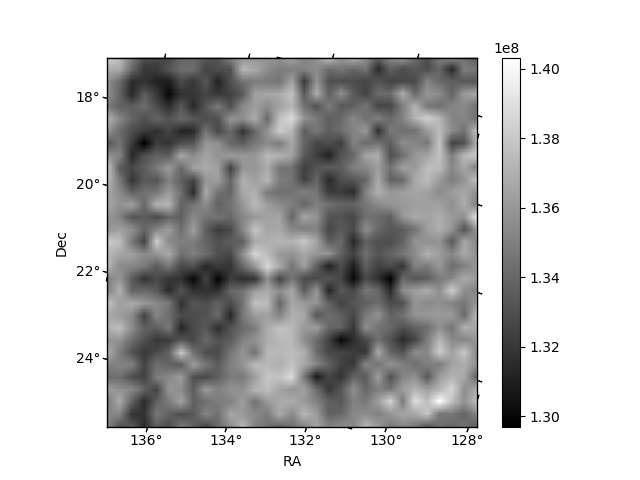
Histogram calculated using DETX and DETY for each event in the final _common_clean file
| Quadrant A | 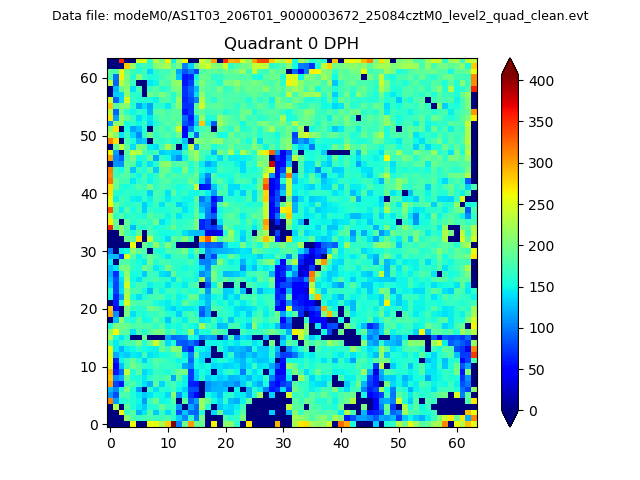 |
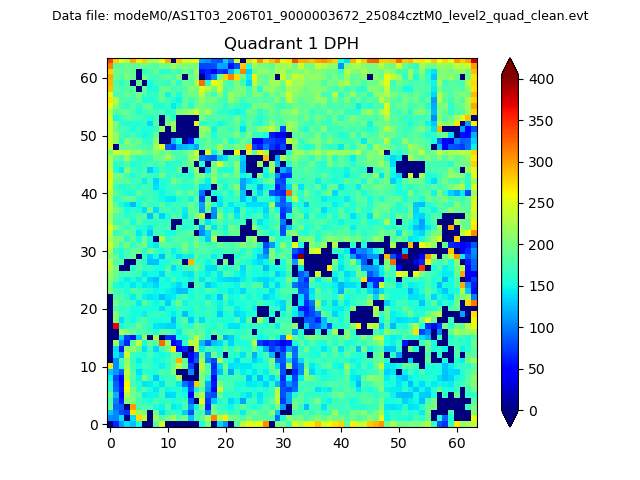 |
Quadrant B |
|---|---|---|---|
| Quadrant D | 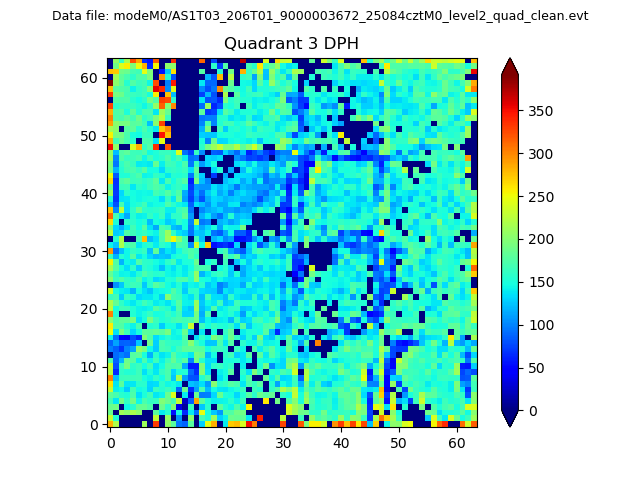 |
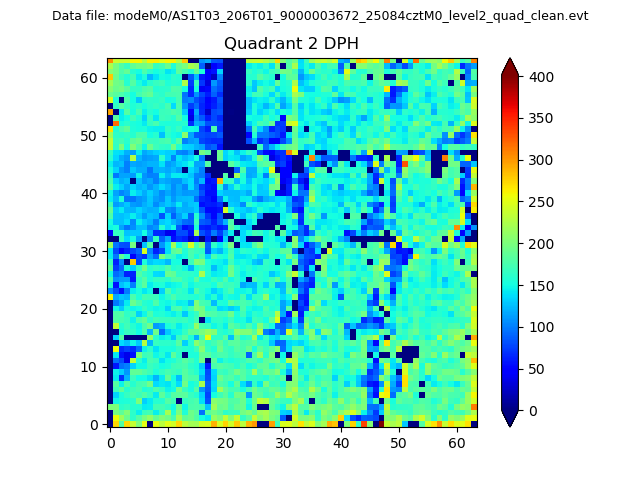 |
Quadrant C |
| Plot type | Count rate plots | Images |
|---|---|---|
| Comparison with Poisson distribution Blue bars denote a histogram of data divided into 1 sec bins. Red curve is a Poisson curve with rate = median count rate of data. |
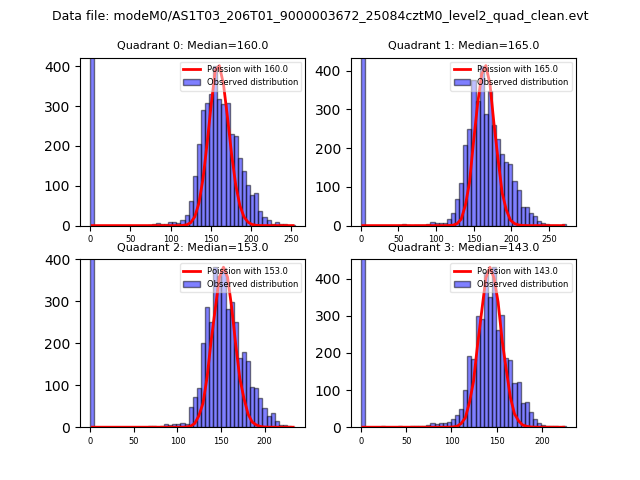 |
 |
| Quadrant-wise count rates Data is divided into 100 sec bins |
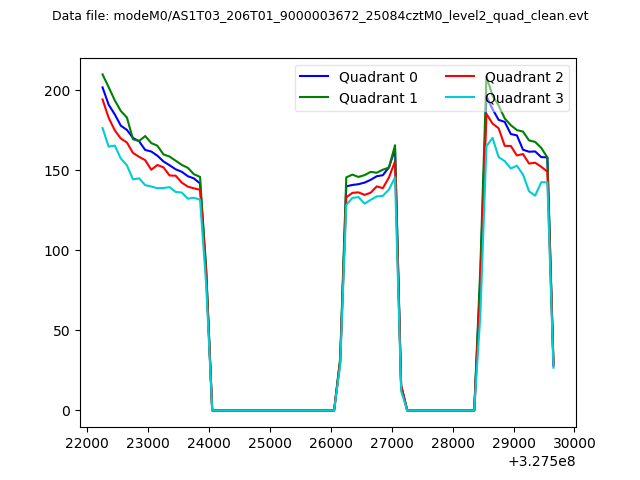 |
|
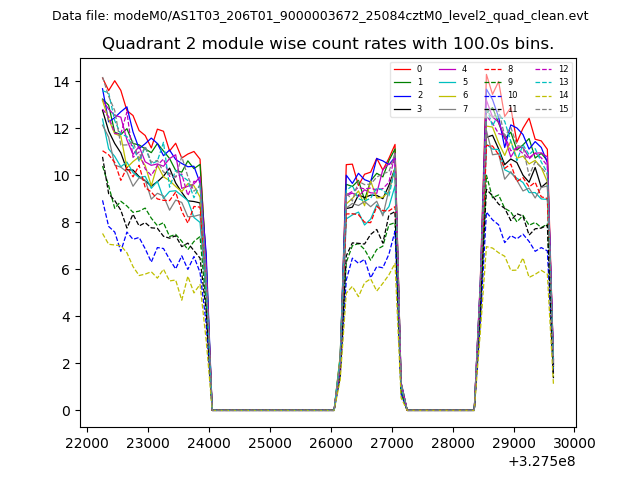
| Module-wise count rates for Quadrant A Data is divided into 100 sec bins |
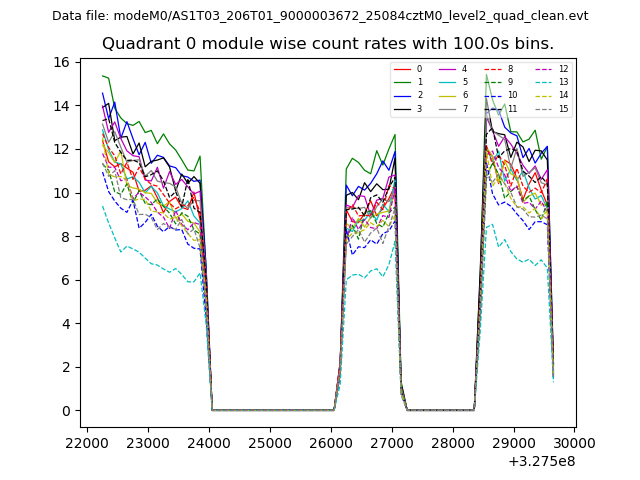 |
 |
| Module-wise count rates for Quadrant B Data is divided into 100 sec bins |
 |
 |
| Module-wise count rates for Quadrant C Data is divided into 100 sec bins |
 |
 |
| Module-wise count rates for Quadrant D Data is divided into 100 sec bins |
 |
 |
| Parameter | Plot |
|---|---|
| CZT HV Monitor | 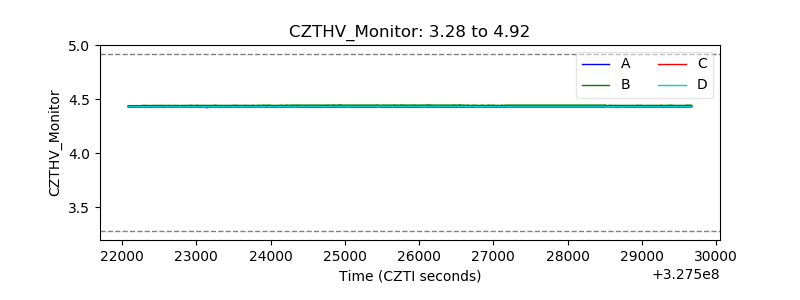 |
| D_VDD | 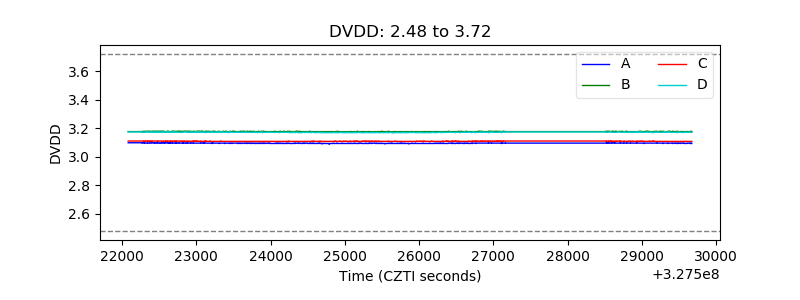 |
| Temperature 1 | 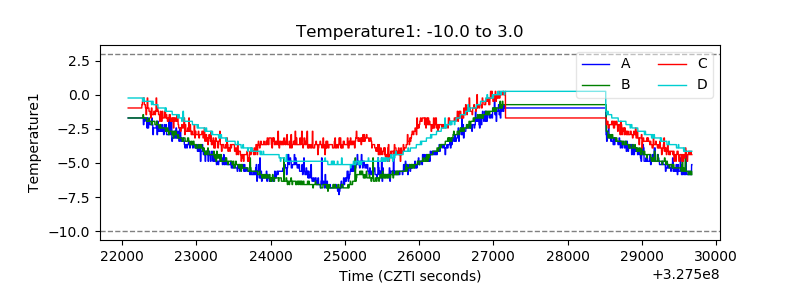 |
| Veto HV Monitor | 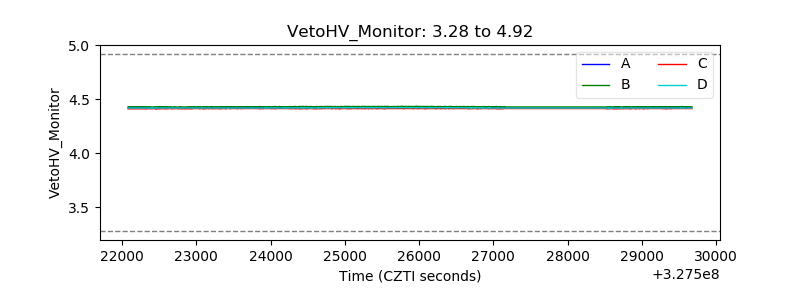 |
| Veto LLD | 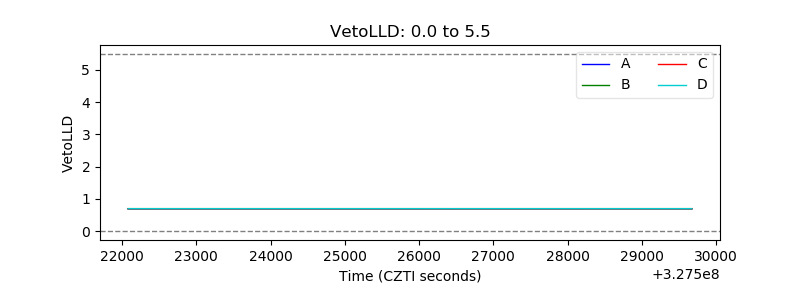 |
| Alpha Counter | 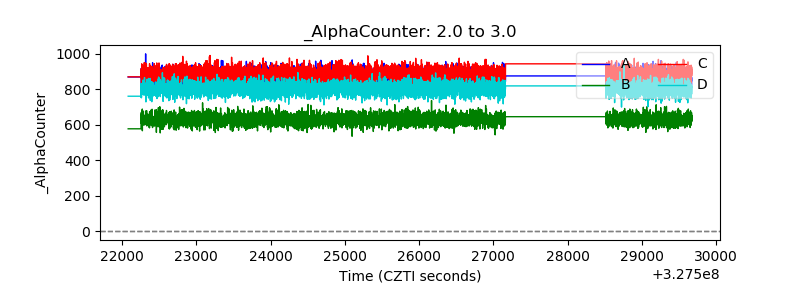 |
| _CPM_Rate | 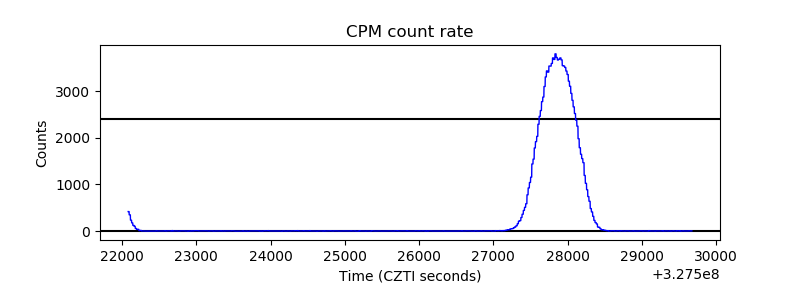 |
| CZT Counter | 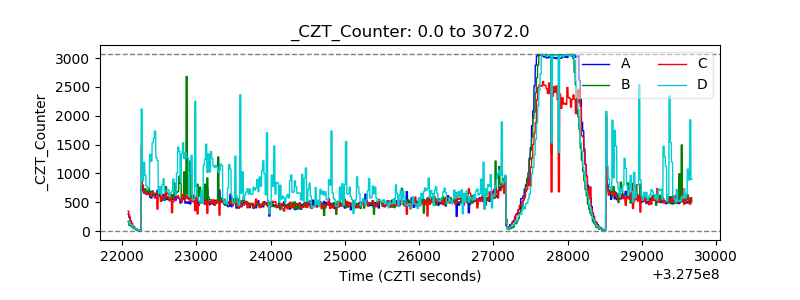 |
| +2.5 Volts monitor |  |
| +5 Volts monitor | 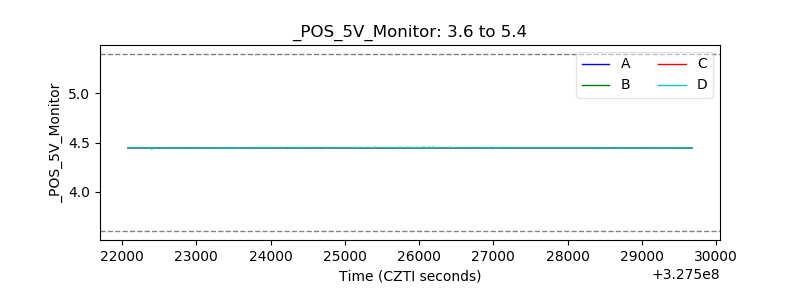 |
| _ROLL_ROT | 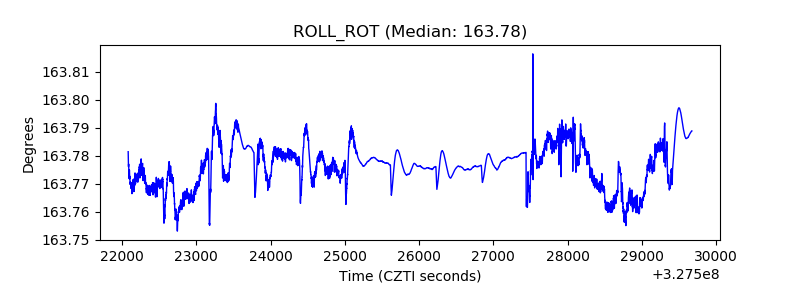 |
| _Roll_DEC | 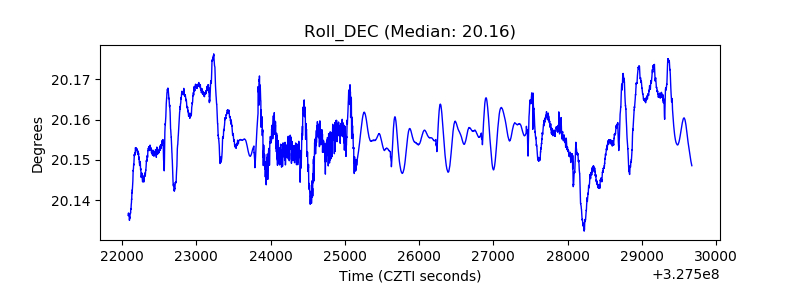 |
| _Roll_RA | 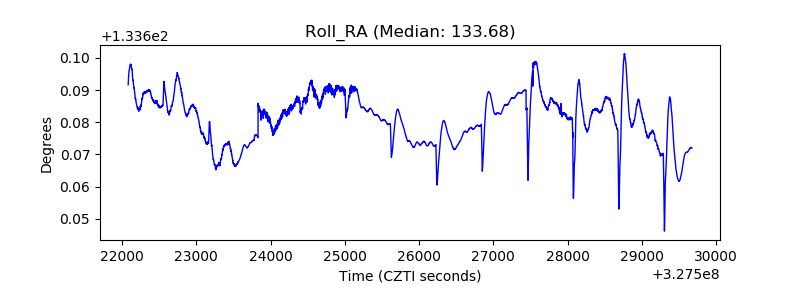 |
| Veto Counter |  |